. 2015 Aug;47(8):926-32.
doi: 10.1038/ng.3354. Epub 2015 Jul 13.

Mutations in SLC25A46, encoding a UGO1-like protein, cause an optic atrophy spectrum disorder

Affiliations

Mutations in SLC25A46, encoding a UGO1-like protein, cause an optic atrophy spectrum disorder

Alexander J Abrams et al. Nat Genet. 2015 Aug.

Abstract

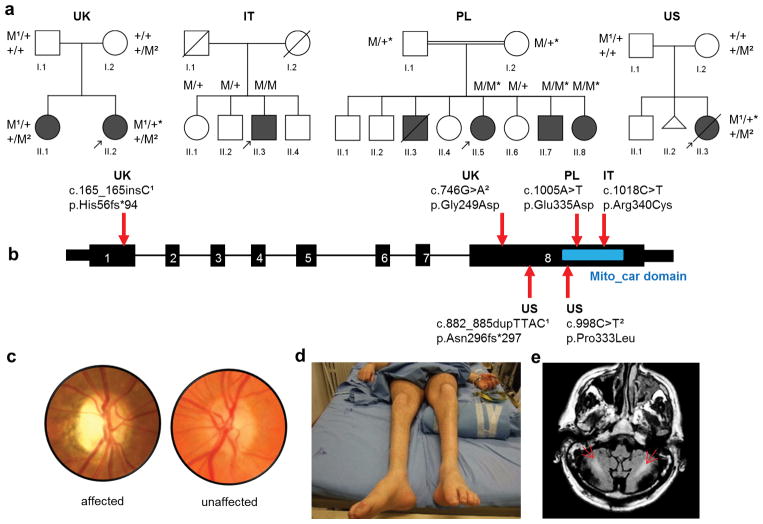
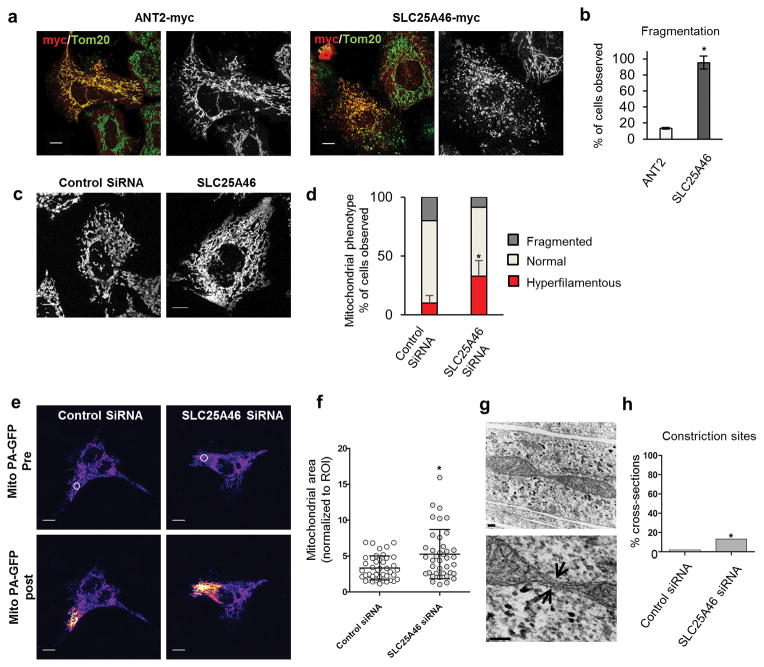
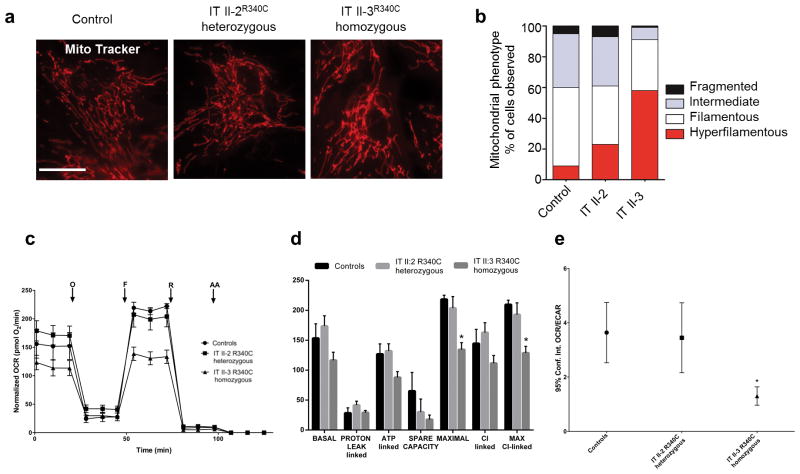
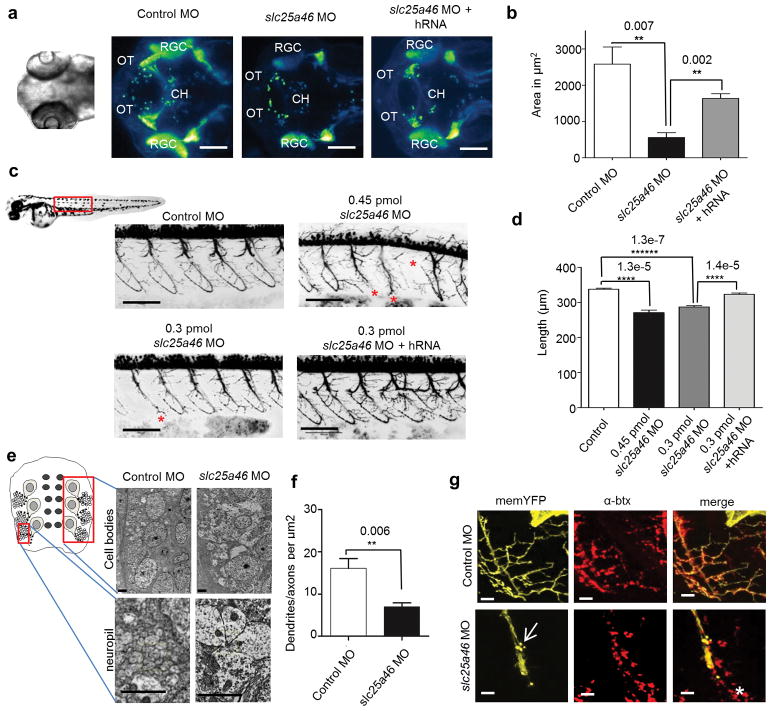
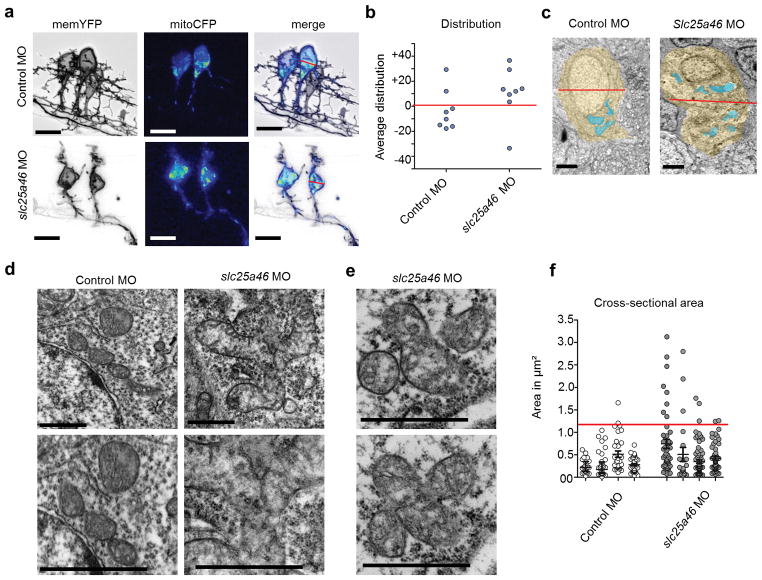
Dominant optic atrophy (DOA) and axonal peripheral neuropathy (Charcot-Marie-Tooth type 2, or CMT2) are hereditary neurodegenerative disorders most commonly caused by mutations in the canonical mitochondrial fusion genes OPA1 and MFN2, respectively. In yeast, homologs of OPA1 (Mgm1) and MFN2 (Fzo1) work in concert with Ugo1, for which no human equivalent has been identified thus far. By whole-exome sequencing of patients with optic atrophy and CMT2, we identified four families with recessive mutations in SLC25A46. We demonstrate that SLC25A46, like Ugo1, is a modified carrier protein that has been recruited to the outer mitochondrial membrane and interacts with the inner membrane remodeling protein mitofilin (Fcj1). Loss of function in cultured cells and in zebrafish unexpectedly leads to increased mitochondrial connectivity, while severely affecting the development and maintenance of neurons in the fish. The discovery of SLC25A46 strengthens the genetic overlap between optic atrophy and CMT2 while exemplifying a new class of modified solute transporters linked to mitochondrial dynamics.


Conflict of interest statement

Competing financial interests

The authors declare no competing financial interests

Figures

Figure 1
Figure 1
Pedigrees and clinical features of optic atrophy “plus” syndromes with variants in SLC25A46. (a) Affected individuals (filled symbols); Deceased individuals (symbols with slashes); miscarriage (triangle); mutant allele (M); wild type allele (+); individuals in whom whole exomes were sequenced (*); probands (arrows). (b) Schematic gene diagram of SLC25A46, NM_138773, located on chromosome 5, cDNA: 1,257 bp, 418 aa, with positions of associated mutations indicated by arrows. The conserved mitochondrial carrier domain is indicated by a blue rectangle. (c) Image of the optic disc from patient UK II-2 shows primary temporal optic nerve pallor when compared to an unaffected individual. (d) Photograph of the legs of patient IT II-3 shows muscle wasting stereotypic of CMT2. (e) MRI shows bilateral hyperintensity of white matter (arrows) in the cerebellum, on FLAIR T2-weighted image, of patient IT II-3.
Figure 2
Figure 2
SLC25A46 localizes to the outer mitochondrial membrane and interacts with mitofilin on the inner membrane. (a) High resolution confocal images of COS-7 cells co-transfected with SLC25A46-HA and Mitofilin-myc. TOM20 and Mitofilin-myc were used as markers of the outer and inner mitochondrial membranes respectively. Scale bar=1 μm. Linear profiles of the fluorescence intensity in arbitrary units along 2 μm dashed lines in merged images. (b) Mitochondria (M) isolated from SLC25A46-HA transfected HEK293T cells were submitted to brief sonication and centrifugation to fractionate soluble (S) and membrane-bound proteins. The pellet was subjected to alkaline extraction to separate soluble membrane extrinsic (CS) and membrane intrinsic (P) proteins. Equivalent volumes of each fraction were analyzed by immunoblotting with antibodies against the soluble matrix protein mHSP70, the extrinsic membrane protein SDHA, the intrinsic membrane protein COX2 and HA. (c) Mitochondria and mitoplasts prepared by hypotonic swelling of mitochondria from HEK293T cells expressing SLC25A46-HA were treated with proteinase K where indicated. After treatment samples were analyzed by immunoblotting with antibodies against the outer membrane protein TOM20, the inner membrane proteins TIM50 and COX2 and HA. (d) Co-sedimentation of SLC25A46-HA and mitoflin in a linear 7–20% sucrose gradient. Hemoglobin, a 67 kDa protein, and lactate dehydrogenase (LDH), a 130 kDa protein, were used to calibrate the gradient. M: mitochondria. Ex: total mitochondrial extract. Two exposures are shown for each protein. (e) Co-immunoprecipitation in HEK293T cells co-transfected with mitofilin-myc and SLC25A46-HA or SLC25A46-HA and myc-tagged mitochondria-targeted GFP as negative control.
Figure 3
Figure 3
SLC25A46 levels regulate mitochondrial morphology. (a) SLC25A46 overexpression causes fragmentation of the mitochondrial network in HeLa cells in comparison to ANT2. (b) Percentage of transfected cells with fragmented mitochondria from three independent experiments. Error bars indicate standard deviation (s.d.). One-sided T-test was used to determine significance. P value = 0.00004. ANT2 n=22; SLC25A46 n=21. (c) HeLa cells treated with siRNAs and stained with Tom20. Mitochondria are more hyperfilamentous when the SLC25A46 is knocked down. (d) Quantification of mitochondrial morphology. Mean and s.d. were calculated from three independent experiments. Control siRNA n=219; SLC25A46 siRNA n=214 (e) The instantaneous diffusion of matrix-targeted, photoactivated GFP was used to assess mitochondrial connectivity. The region of interest (ROI) white circle in the pre-activation image was targeted with the laser, while the corresponding signal in the post-activation image represents the extent of the mitochondrial connectivity. (f) Quantification of the activated mitochondrial area in the post-activation image normalized to the ROI of the pre-activated image. Error bars represents s.d. and P value was calculated by one tailed T-test P = 0.0009. Control siRNA n=42; SLC25A46 siRNA n=38. (g) Representative electron micrographs of a mitochondrial cross-section with constriction sites (arrows) in SLC25A46 siRNA treated COS-7 cells. (h) Percentage of cross-sections with visible constriction sites; 2 out of 103 control versus 11 out 81 in the knockdown. Error bars represents s.d. and significance was determined by a 2-tailed Fisher’s exact test, P value 0.0028. Scale bars (a,c,e) = 10 μm; (g) = 100 nm top, 200 nm bottom.
Figure 4
Figure 4
Patient fibroblasts have hyper-filamentous mitochondria and are respiratory deficient. (a) Patient fibroblasts from IT II-3, homozygous for SLC25A46R340C, have a hyper-filamentous and interconnected mitochondrial network in comparison to unaffected heterozygous sibling IT II-2 and control. Scale bars = 25 μm. (b) The distribution of mitochondrial morphology into three categories by blind test in human fibroblasts: P=0.001, calculated with chi square test for control, IT II-2, and IT II-3. Control n=200; IT II-2 n=200; IT II-3 n = 200. (c) Oxygen consumption rate (OCR) traces in control and mutant fibroblasts, expressed as pMolesO2/min, after the injection of oligomycin (O), FCCP (F), rotenone (R) and antimycin A (AA). The homozygous IT II-3 fibroblasts show reduced OCR compared to controls and heterozygous IT II-2 fibroblasts. OCR values are normalized to protein content. Error bars indicate the standard error of mean (s.e.m.) of four independent experiments. (d) BASAL, PROTON LEAK-linked, ATP-linked, MAXIMAL, Complex I-linked, MAXIMAL Complex I-linked respiration and SPARE CAPACITY were calculated from OCR traces and reported in the graph as mean ± SEM. Dunnett’s test of control vs mutant fibroblasts was performed, * indicates p<0.01. (e) Analysis of OCR/ECAR in basal conditions. Extra-cellular acidification rate (ECAR), is an indicator of lactic acid production. The reduced OCR/ECAR ratio observed in the homozygous IT II-3 fibroblasts suggests the occurrence of a glycolitic shift. Bars indicate the confidence intervals (Conf.Int.). Analysis was performed from 5 replicate wells for each fibroblasts line. Dunnett’s test of control vs mutant fibroblasts was performed, * indicates P = 0.002.
Figure 5
Figure 5
Slc25a46 knockdown in zebrafish affects the growth and maintenance of neurons. (a) Dorsal view of 72 hpf Tg:(Islet2:egfp) embryos. Retinal ganglion cell (RGC) axons cross at the chiasm (CH) before innervating the optic tectum (OT). Scale bar=100 μm. (b) Quantification of the area of RGC-innervated tectum depicting mean and s.d. P values were calculated from a one-tailed Student’s T-test. Control MO n = 3; 0.45 pmol slc25a46 MO n = 3, 0.45 pmol slc25a46 MO + hRNA n = 3. (c) Motor neuron axonsin Tg:(Olig2:DsRed) embryos at 48 hpf. Truncated axons were commonly (*) observed from knockdown. Scale bar = 100 μm. (d) Quantification of the average common axon path length per fish with s.d. between fish. Significance was determined with a one-way ANOVA followed by a Tukey’s post hoc test (Supplementary Table 4). P values were calculated with a one-tailed Student’s T-test. Control MO n = 16; 0.45 pmol slc25a46 MO n = 14; 0.3 pmol slc25a46 MO n = 16; 0.3 pmol slc25a46 MO + hRNA n = 15. (e) Electron micrographs of zebrafish spinal cord (cell bodies top and neuropil bottom) at 48 hpf. Scale bars = 2 μm (f) Quantification of the density of neuronal processes in the neuropil. Data represents mean and s.d. P value calculated with a one-tailed Student’s T-test. Control MO n = 4; 0.45 pmol slc25a46 MO n = 4. (g) Motor neuron terminals labeled with membrane bound YFP and postsynaptic acetylcholine receptors on muscle labeled with α-btx. Axonal blebbing (arrow) and die back indicating by receptors in front of the axon (*) were commonly observed in morphant motor neurons. Scale bar = 10 μm.
Figure 6
Figure 6
Mitochondrial distribution and morphology in zebrafish motor neurons at 48 hpf. (a) Zebrafish motor neurons in vivo labeled with plasmids driving mitoCFP (blue) and memYFP (black) under the Hb9 promoter. Scale bar = 10 μm. (b) Graph depicting the distributional density of mitoCFP pixels as a percentage either above or below the midline of the soma defined as 0. In slc25a46 morphant motor neurons, mitochondria are shifted toward the top of the soma. Control MO n = 8; slc25a46 MO n = 8. P value = 0.083 by one-tailed Student’s T-test. The mitochondria in the morphants also appear to be more aggregated which is more apparent in electron microscopy images. (c) Representative electron microscopy images showing mitochondrial distribution. Soma (yellow) and mitochondria (blue). Scale bar = 1 μm. (d) Electron micrographs of mitochondria in spinal cord. Scale bar = 1 μm. Slc25a46 morphants show accumulation of large mitochondrial aggregates that appear to be in the process of fission. (e) Serial section of a clover shaped mitochondrial aggregate, suggesting that these mitochondria are fused at a narrow junction point, only visible in the right plane of section. (f) Cross-sectional areas of mitochondria with distribution of sizes show that larger aggregates are present in slc25a46 morphants. Number of fish; control MO n = 4, slc25a46 MO n = 4. Number of mitochondrial cross-sections; control MO n = 138, slc25a46 MO n = 201. Red line=3 times the s.d. of the average are found in controls. P value = 0.0006 by one-tailed Student’s T-test when comparing total mitochondrial cross-sections per group.

References

    1. Delettre C, Lenaers G, Pelloquin L, Belenguer P, Hamel CP. OPA1 (Kjer type) dominant optic atrophy: a novel mitochondrial disease. Mol Genet Metab. 2002;75:97–107. - PubMed
    1. Alexander C, et al. OPA1, encoding a dynamin-related GTPase, is mutated in autosomal dominant optic atrophy linked to chromosome 3q28. 2000;26 - PubMed
    1. Züchner S, et al. Mutations in the mitochondrial GTPase mitofusin 2 cause Charcot-Marie-Tooth neuropathy type 2A. Nat Genet. 2004;36:449–51. - PubMed
    1. Chan DC. Dissecting mitochondrial fusion. Dev Cell. 2006;11:592–4. - PubMed
    1. Sesaki H, Jensen RE. UGO1 encodes an outer membrane protein required for mitochondrial fusion. J Cell Biol. 2001;152:1123–34. - PMC - PubMed

Publication types

MeSH terms