. 2015 Aug;47(8):898-905.
doi: 10.1038/ng.3353. Epub 2015 Jul 13.

Additive and interaction effects at three amino acid positions in HLA-DQ and HLA-DR molecules drive type 1 diabetes risk

Affiliations

Additive and interaction effects at three amino acid positions in HLA-DQ and HLA-DR molecules drive type 1 diabetes risk

Xinli Hu et al. Nat Genet. 2015 Aug.

Abstract

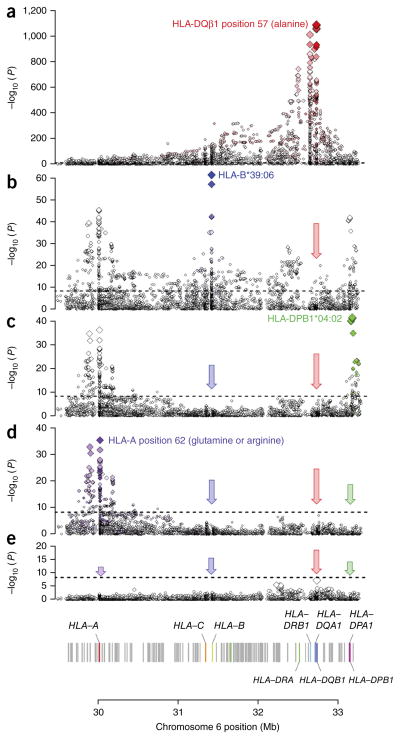
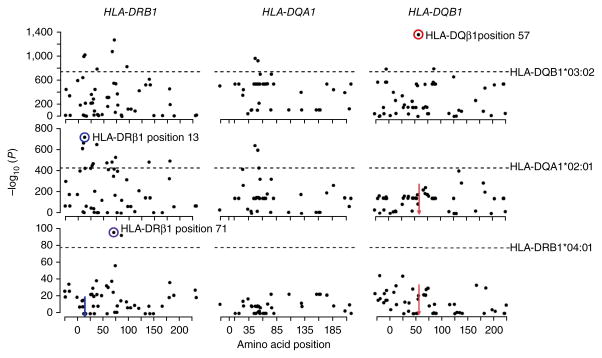
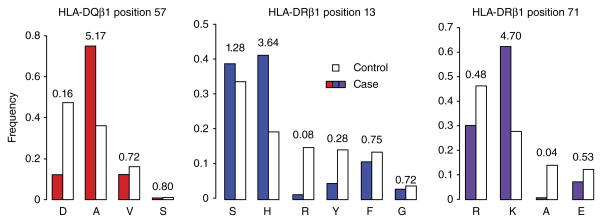
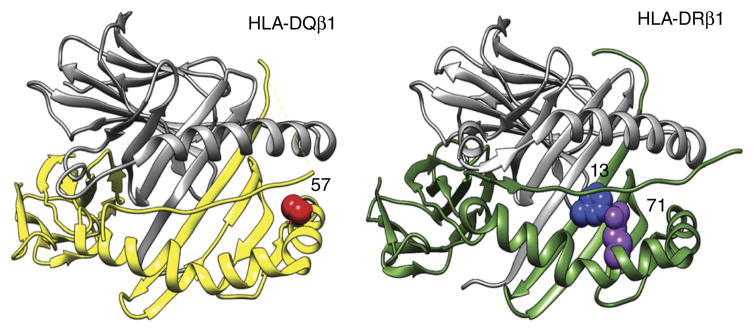
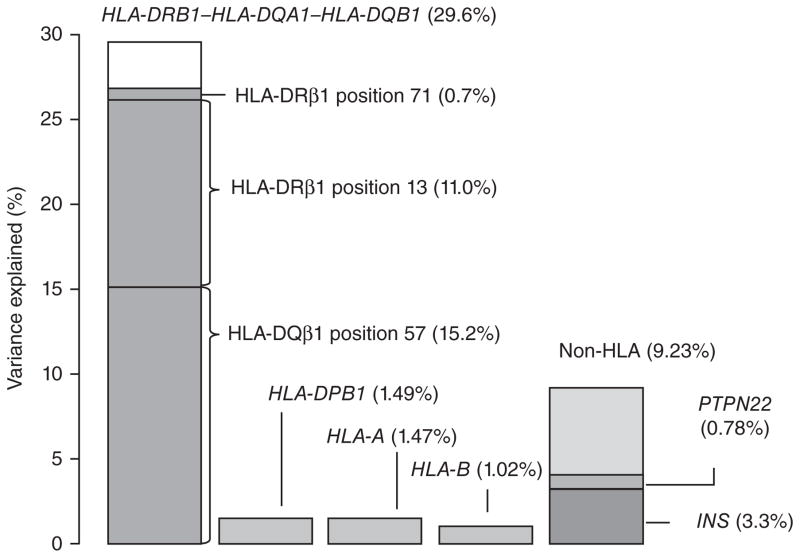
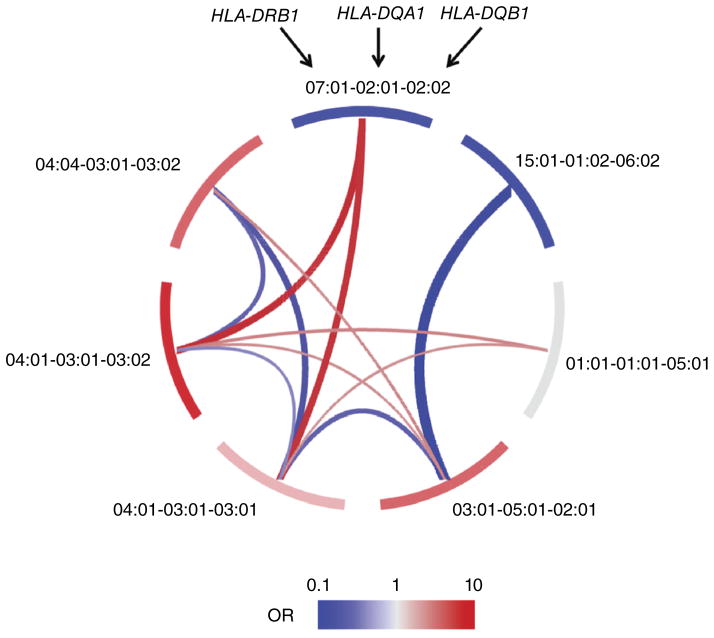
Variation in the human leukocyte antigen (HLA) genes accounts for one-half of the genetic risk in type 1 diabetes (T1D). Amino acid changes in the HLA-DR and HLA-DQ molecules mediate most of the risk, but extensive linkage disequilibrium complicates the localization of independent effects. Using 18,832 case-control samples, we localized the signal to 3 amino acid positions in HLA-DQ and HLA-DR. HLA-DQβ1 position 57 (previously known; P = 1 × 10(-1,355)) by itself explained 15.2% of the total phenotypic variance. Independent effects at HLA-DRβ1 positions 13 (P = 1 × 10(-721)) and 71 (P = 1 × 10(-95)) increased the proportion of variance explained to 26.9%. The three positions together explained 90% of the phenotypic variance in the HLA-DRB1-HLA-DQA1-HLA-DQB1 locus. Additionally, we observed significant interactions for 11 of 21 pairs of common HLA-DRB1-HLA-DQA1-HLA-DQB1 haplotypes (P = 1.6 × 10(-64)). HLA-DRβ1 positions 13 and 71 implicate the P4 pocket in the antigen-binding groove, thus pointing to another critical protein structure for T1D risk, in addition to the HLA-DQ P9 pocket.


Conflict of interest statement

COMPETING FINANCIAL INTERESTS

The authors declare no competing financial interests.

Figures

Figure 1
Figure 1
HLA loci independently associated with T1D. Each binary marker was tested for T1D association, using the imputed allelic dosage (between 0 and 2). In each panel, the horizontal dashed line marks P = 5 × 10⁻⁸. The color gradient of the diamonds indicates LD (r2) with the most strongly associated variant; the darkest shade represents r2 = 1. (a) The strongest associations were located in the HLA-DRB1HLA-DQA1HLA-DQB1 locus. The single strongest risk variant was alanine at HLA-DQβ1 position 57 (OR = 5.17; P = 1 × 10−1,090). See Supplementary Table 2 for unadjusted associations for all markers. (b) Adjusting for all HLA-DRB1, HLA-DQA1 and HLA-DQB1 four-digit classical alleles, the strongest independent signals were in HLA-B. The strongest association was with HLA-B*39:06 (OR = 6.64; P = 1 × 10−75). (c) Adjusting for HLA-DRB1HLA-DQA1HLA-DQB1 and HLA-B, the next strongly associated variant was HLA-DPB1*04:02 (OR = 0.48; P = 1 × 10−55). (d) The final independent association was in HLA-A, led by glutamine at HLA-A position 62 (OR = 0.70; P = 1 × 10⁻²⁵). (e) We found no residual independent association in the HLA-C or HLA-DPA1 genes.
Figure 2
Figure 2
Amino acid residues at HLA-DQβ1 position 57, HLA-DRβ1 position 13 and HLA-DRβ1 position 71 independently drive T1D risk associated with the HLA-DRB1HLA-DQA1HLA-DQB1 locus. To identify each independently associated position, we used conditional haplotypic analysis by forward search, using phased best-guess genotypes. In each panel, the dots mark amino acid positions along the gene (x axis) and their association P values (log10; y axis). The horizontal dashed lines mark the log10 (P value) of the most strongly associated classical allele for each gene. The most strongly associated signals are circled. The colored arrows indicate positions that have been conditioned on. The most strongly associated position was HLA-DQβ1 position 57 (P = 1 × 10−1,355). Conditioning on this site, HLA-DRβ1 position 13 was the next independently associated position (P = 1 × 10−721), followed by HLA-DRβ1 position 71 (P = 1 × 10−95). Each position was much more strongly associated than the best classical allele (HLA-DQB1*03:02, HLA-DQA1*02:01 and HLA-DRB1*04:01, respectively).
Figure 3
Figure 3
Effect sizes for amino acid residues. Case (colored bars) and control (unfilled bars) frequencies, as well as unadjusted univariate OR estimates, are shown for each residue at HLA-DQβ1 position 57, HLA-DRβ1 position 13 and HLA-DRβ1 position 71.
Figure 4
Figure 4
HLA-DQβ1 position 57, HLA-DRβ1 position 13 and HLA-DRβ1 position 71 are each located in the respective molecule’s peptide-binding groove. HLA-DRβ1 positions 13 and 71 line the P4 pocket of the HLA-DR molecule.
Figure 5
Figure 5
HLA-DQβ1 position 57, HLA-DRβ1 position 13 and HLA-DRβ1 position 71 explain over 90% of the phenotypic variance from the HLA-DRB1HLA-DQA1HLA-DQB1 locus. Assuming the liability threshold model and a global T1D prevalence of 0.4%, all haplotypes in HLA-DRB1HLA-DQA1HLA-DQB1 together explain 29.6% of total phenotypic variance. HLA-DQβ1 position 57 alone explains 15.2% of the variance; the addition of HLA-DRβ1 position 13 and HLA-DRβ1 position 71 increases the explained proportion to 26.9%. Therefore, these three amino acid positions together capture over 90% of the signal within HLA-DRB1HLA-DQA1HLA-DQB1. In contrast, variation in HLA-A, HLA-B and HLA-DPB1 together explain approximately 4% of total variance. Genome-wide independently associated SNPs outside the HLA together explain about 9% of variance; rs678 (in INS) and rs2476601 (in PTPN22) explain 3.3% and 0.78%, respectively.
Figure 6
Figure 6
Interactions between common HLA-DRB1HLA-DQA1HLA-DQB1 haplotypes lead to observed non-additive effects. We exhaustively tested the seven common haplotypes for pairwise interaction. Of the 21 possible pairs, 11 showed significant interaction effects. Along the perimeter of the diagram, each segment represents one haplotype; red or blue color indicates a risk-conferring or protective additive effect for each haplotype, respectively. Each arc connecting two haplotypes represents a significant interaction. Red indicates additional risk due to the interaction beyond the additive effects, whereas blue indicates reduced risk (protection) due to the interaction beyond the additive effects. The thickness of each arc represents the effect size of the interaction (a thicker red arc means a larger risk effect, whereas a thicker blue arc means a more protective effect). See Table 2 and Supplementary Table 9 for P values and effect sizes for all pairwise haplotypic interactions.

Similar articles

Cited by

References

    1. Maahs DM, West NA, Lawrence JM, Mayer-Davis EJ. Epidemiology of type 1 diabetes. Endocrinol Metab Clin North Am. 2010;39:481–497. - PMC - PubMed
    1. Raychaudhuri S, et al. Five amino acids in three HLA proteins explain most of the association between MHC and seropositive rheumatoid arthritis. Nat Genet. 2012;44:291–296. - PMC - PubMed
    1. Trynka G, Wijmenga C, van Heel DA. A genetic perspective on coeliac disease. Trends Mol Med. 2010;16:537–550. - PubMed
    1. Gourraud PA, Harbo HF, Hauser SL, Baranzini SE. The genetics of multiple sclerosis: an up-to-date review. Immunol Rev. 2012;248:87–103. - PMC - PubMed
    1. Lee KH, Wucherpfennig KW, Wiley DC. Structure of a human insulin peptide–HLA-DQ8 complex and susceptibility to type 1 diabetes. Nat Immunol. 2001;2:501–507. - PubMed

Publication types