. 2015 Aug 20;524(7565):361-5.
doi: 10.1038/nature14587. Epub 2015 Jul 13.

Transcriptional control of autophagy-lysosome function drives pancreatic cancer metabolism

Affiliations

Transcriptional control of autophagy-lysosome function drives pancreatic cancer metabolism

Rushika M Perera et al. Nature. .

Abstract

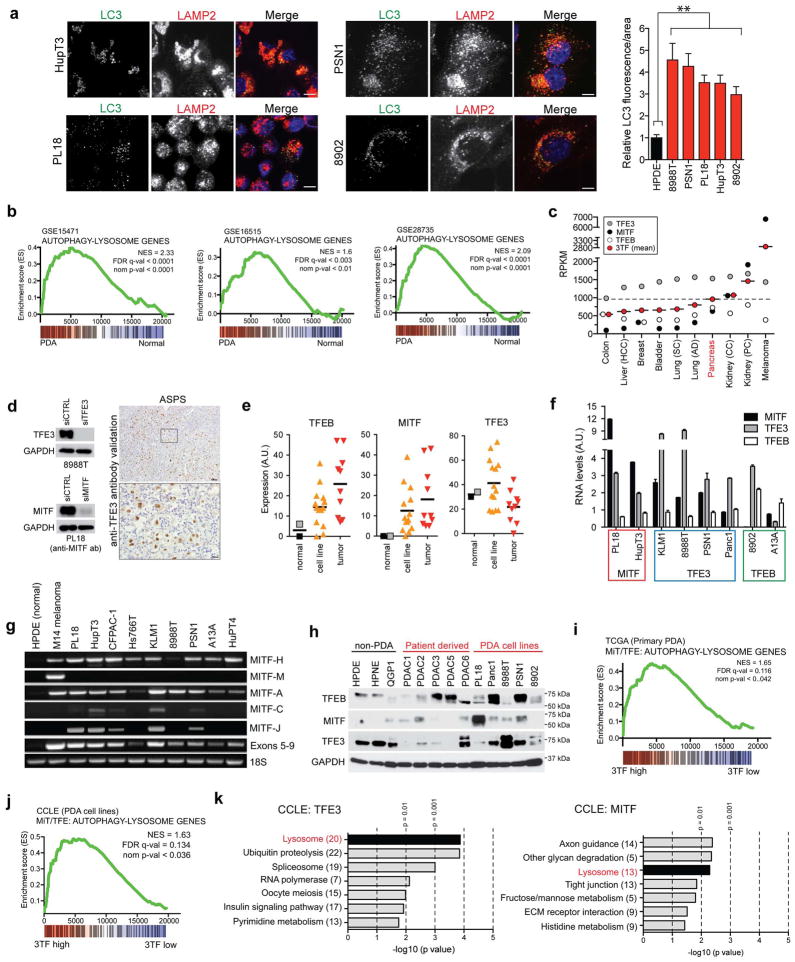
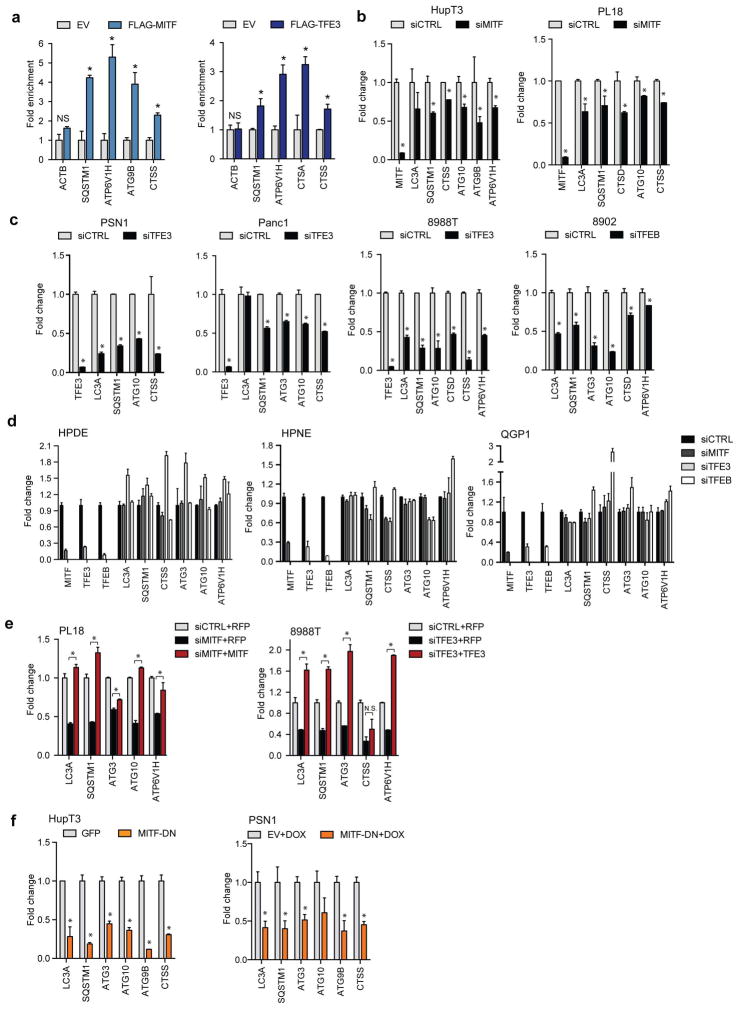
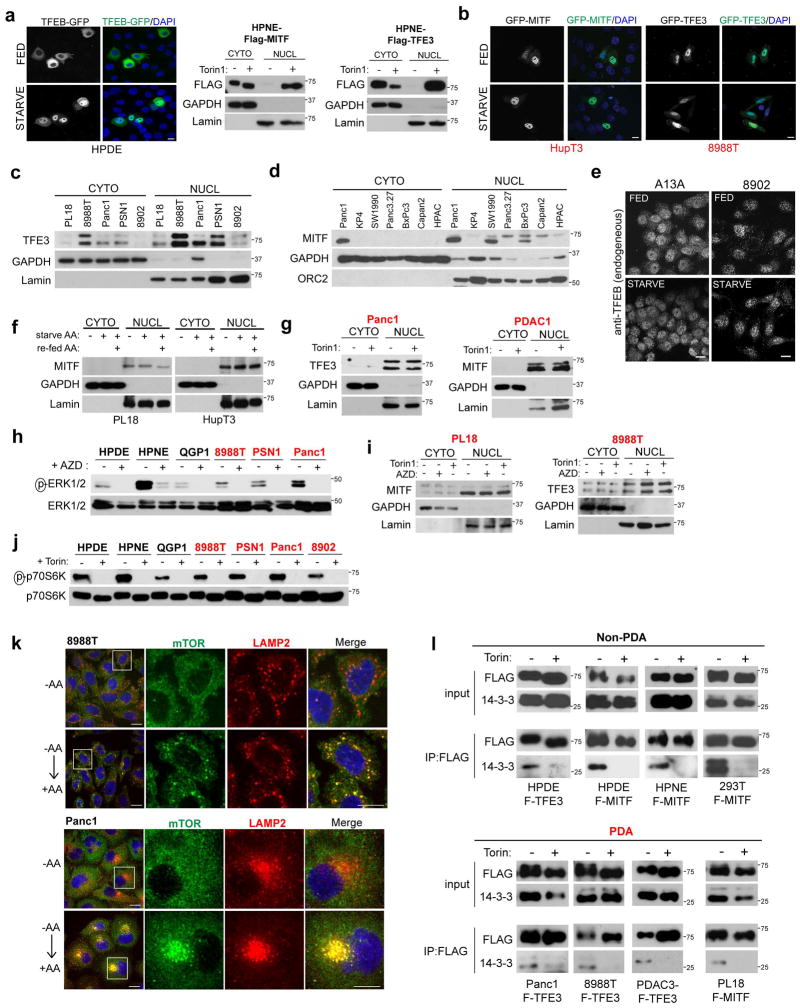
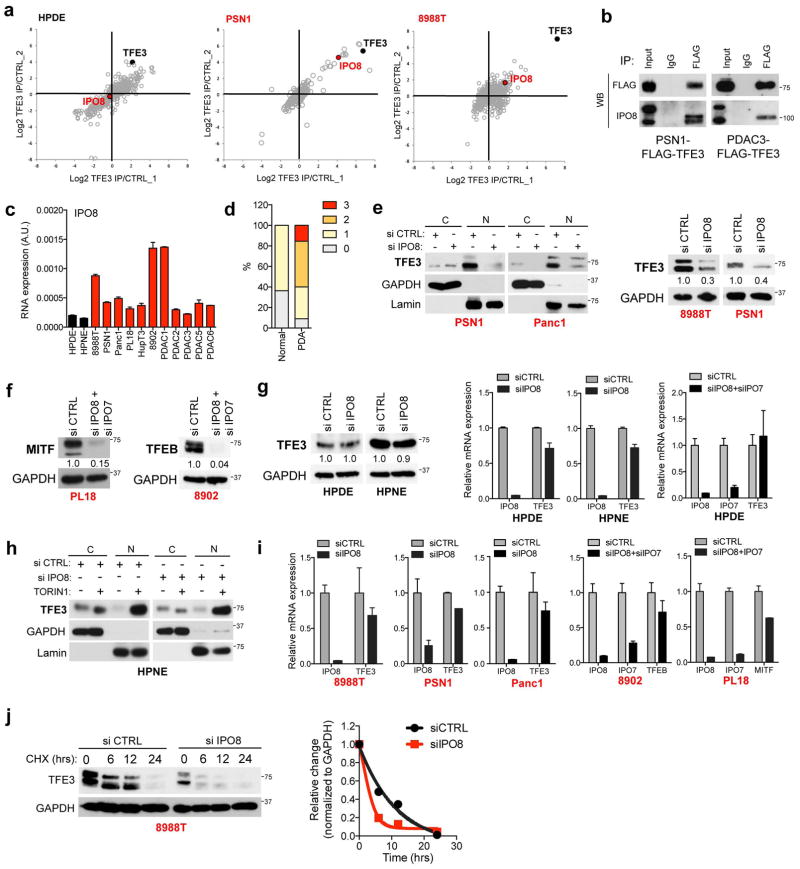
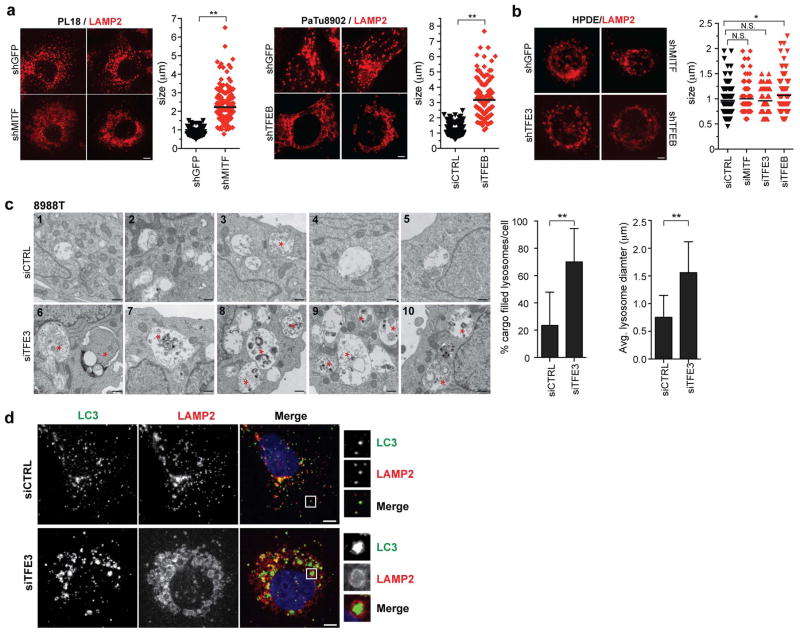
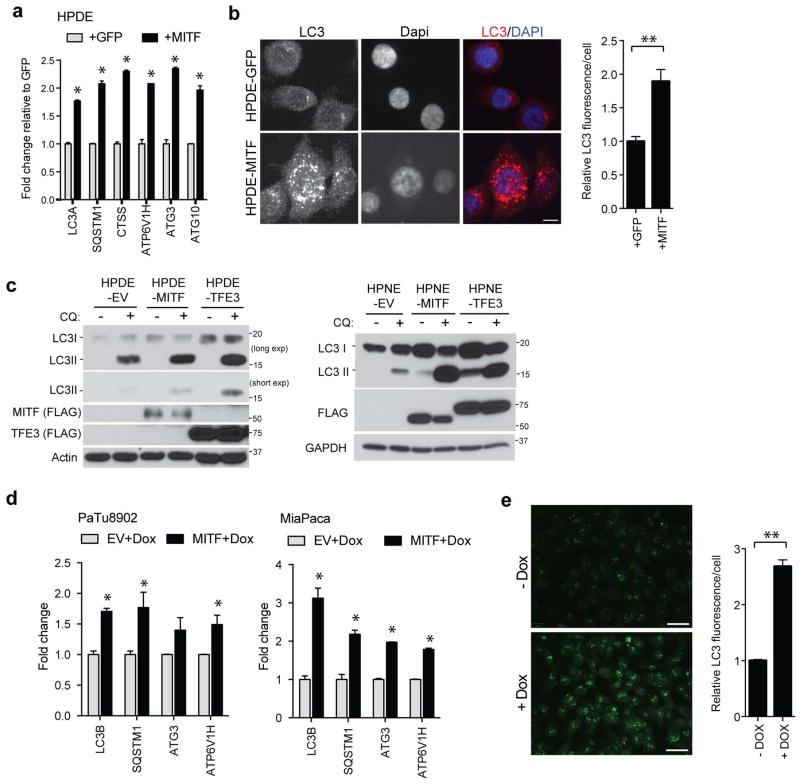
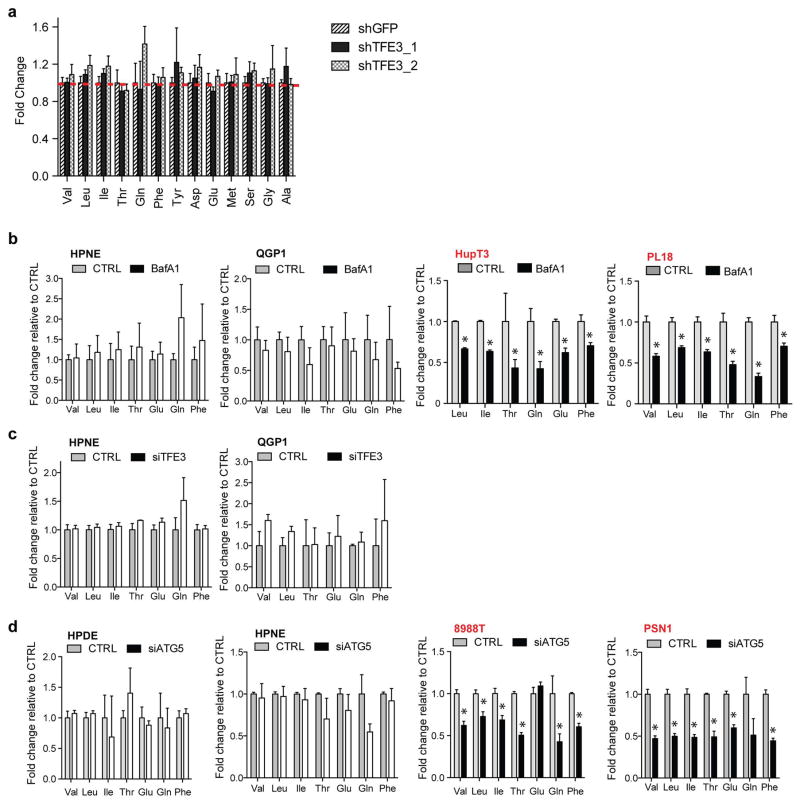
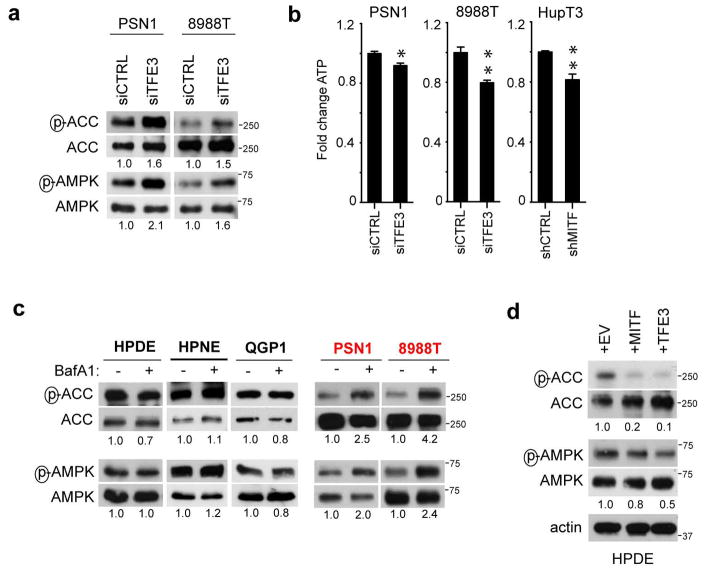
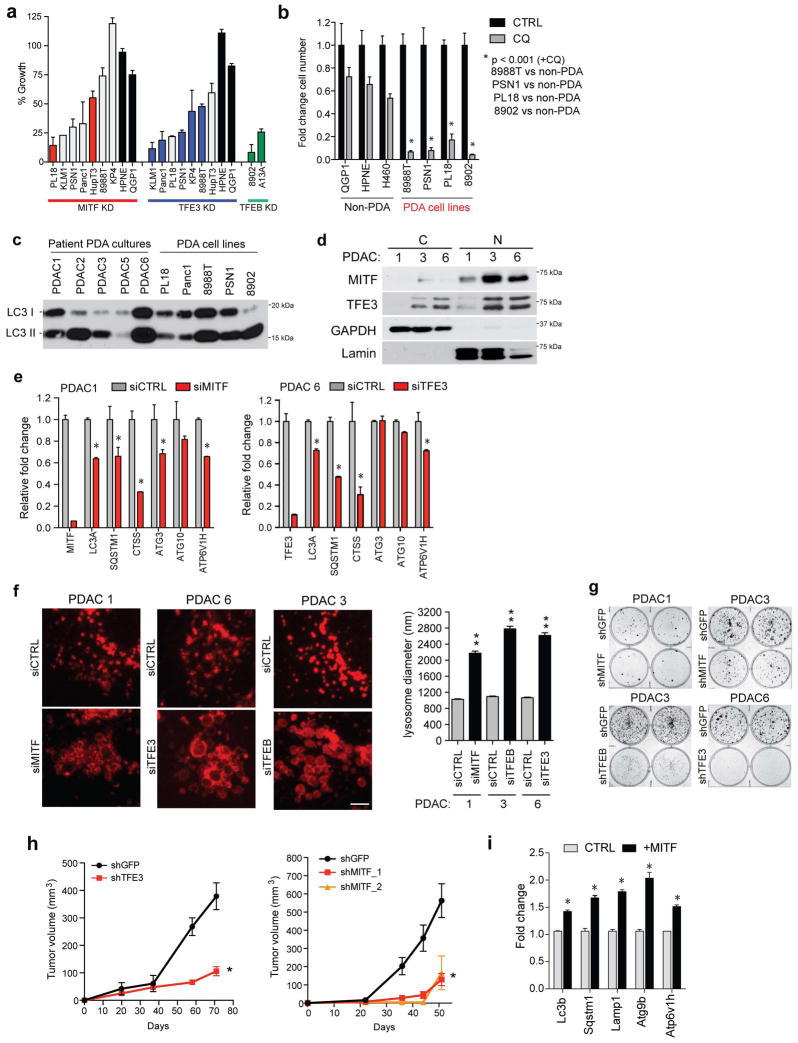
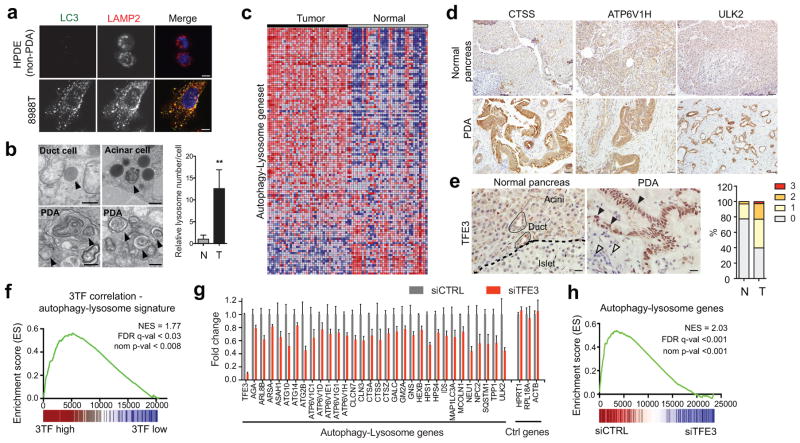
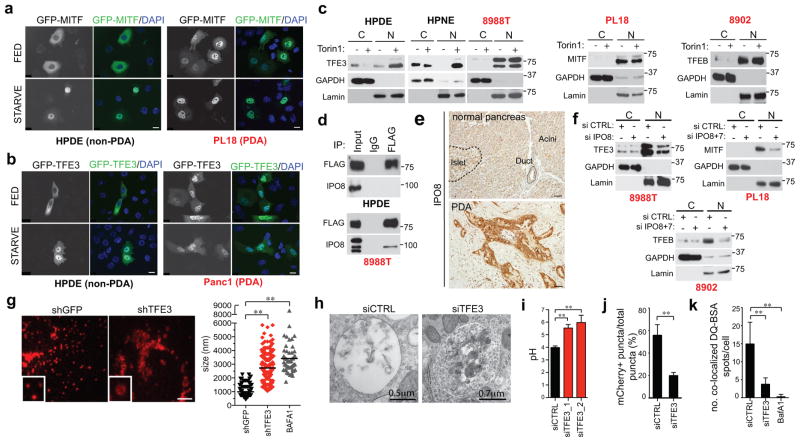
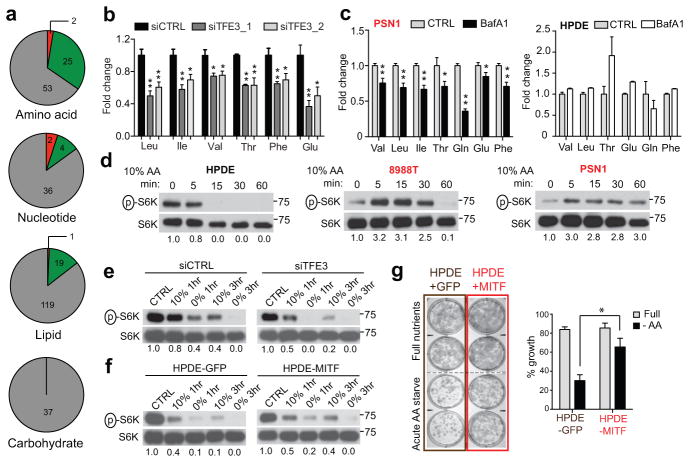
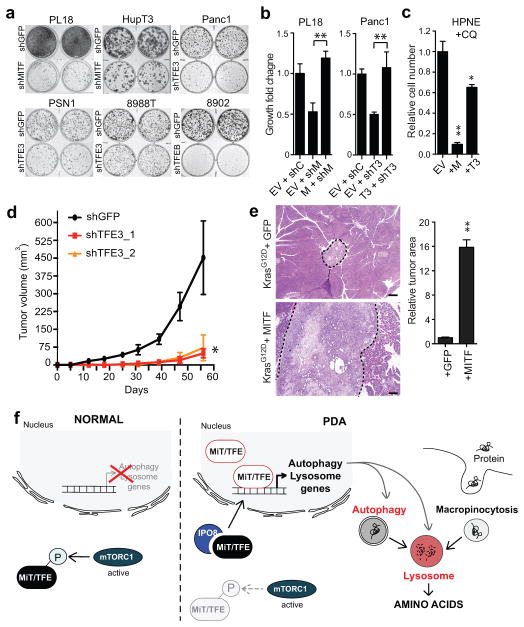
Activation of cellular stress response pathways to maintain metabolic homeostasis is emerging as a critical growth and survival mechanism in many cancers. The pathogenesis of pancreatic ductal adenocarcinoma (PDA) requires high levels of autophagy, a conserved self-degradative process. However, the regulatory circuits that activate autophagy and reprogram PDA cell metabolism are unknown. Here we show that autophagy induction in PDA occurs as part of a broader transcriptional program that coordinates activation of lysosome biogenesis and function, and nutrient scavenging, mediated by the MiT/TFE family of transcription factors. In human PDA cells, the MiT/TFE proteins--MITF, TFE3 and TFEB--are decoupled from regulatory mechanisms that control their cytoplasmic retention. Increased nuclear import in turn drives the expression of a coherent network of genes that induce high levels of lysosomal catabolic function essential for PDA growth. Unbiased global metabolite profiling reveals that MiT/TFE-dependent autophagy-lysosome activation is specifically required to maintain intracellular amino acid pools. These results identify the MiT/TFE proteins as master regulators of metabolic reprogramming in pancreatic cancer and demonstrate that transcriptional activation of clearance pathways converging on the lysosome is a novel hallmark of aggressive malignancy.


Figures

Extended Data Figure 1
Extended Data Figure 1. Tumor-specific expression and constitutive activation of MiT/TFE factors in PDA
a) Immunofluorescence staining of autophagosomes (LC3) and lysosomes (LAMP2) showing extensive overlap of these organelles and increased LC3 immunofluorescence in PDA cell lines (graph at right; error bars indicate mean ± s.e.m for N = 3 independent experiments with at least 130 cells scored). Scale bar = 11 μm. b) GSEA of different human PDA datasets for enrichment of the autophagy-lysosome gene signature in tumor versus normal tissue (GEO accession numbers indicated). c) Mean expression (RPKM; reads per kilobase per million) of TFE3, MITF, and TFEB individually or cumulatively as a meta-gene formed by the mean of the three transcription factors (3TF) in primary tumor specimens from the indicated malignancies (TCGA dataset). d) TFE3 and MITF antibody validation by western blotting in cells treated with the indicated siRNA. TFE3 antibody IHC validation using alveolar soft part sarcoma (ASPS) tissue. This antibody (MRQ-37, Cell Marque) is used as a clinical diagnostic for ASPS. Scale Bar = 100 μm (top), 20 μm (bottom). e) Gene expression analysis showing upregulation of MiT/TFE genes in subsets of PDA relative to normal pancreatic ductal tissue. SAGE data from normal microdissected pancreatic ductal cells (normal microdissected control; black box, HPDE; grey box), cultured PDA cells (cell line), and PDA xenografts and primary tumor tissues (tumor). f) qRT-PCR analysis of MiT/TFE expression levels in a panel of human PDA cell lines. Note that PL18 and HupT3 preferentially express high levels of MITF, while 8988T, PSN1 and Panc1 express TFE3 at higher levels. The highest levels of TFEB were detected in 8902 and A13A cells. g) RT-PCR analysis reveals that PDA cells express distinct MITF isoforms. Note the complete absence of all MITF isoforms in normal HPDE cells. PDA cells lack the melanoma-specific M isoform (detected in M14 melanoma cells, lane 2). h) MITF, TFE3 and TFEB protein levels in a panel of non-PDA cell lines, patient-derived PDA cultures and PDA cell lines. i) GSEA analysis showing correlation between expression of MiT/TFE factors and autophagy-lysosome gene set in primary human PDA specimens (TCGA dataset). j) GSEA analysis showing correlation between cumulative expression of MiT/TFE factors (see Methods) and the autophagy-lysosome gene set in human PDA cell lines (CCLE dataset). k) DAVID analysis of gene sets correlating with increasing expression of TFE3 (left) or MITF (right) in human PDA cell lines (CCLE dataset).
Extended Data Figure 2
Extended Data Figure 2. MiT/TFE-dependent regulation of autophagy-lysosome gene expression in PDA cell lines
a) Chromatin immunoprecipitation analysis of FLAG-MITF (left) and FLAG-TFE3 (right) binding to autophagy-lysosome genes in 8902 and Panc1 cells, respectively. Histograms show the amount of immunoprecipitated DNA detected by qPCR normalized to input and plotted as relative enrichment over mock control. Error bars indicate mean ± s.e.m for N = 3 independent experiments. * p < 0.05. b) siRNA mediated knockdown of MITF in HupT3 and PL18 cells causes a decrease in autophagy-lysosome gene expression, assayed 48 hrs post siRNA transfection. * p < 0.05. c) Knockdown of TFE3 in PSN1, Panc1 and 8988T cells, or of TFEB in 8902 cells, causes a decrease in autophagy-lysosome gene expression. * p < 0.05. d) HPDE, HPNE, and QGP1 control cells show minimal changes in autophagy-lysosome gene expression upon knockdown of the MiT/TFE genes. e) Decreased autophagy-lysosome gene expression following MITF knockdown (left; PL18 cells; * p < 0.05) or TFE3 knockdown (right; 8988T cells; * p < 0.01) is rescued by transient ectopic expression of MITF or TFE3. Cells were transfected with expression constructs for MITF or TFE3 24 hrs post-siRNA transfection. After 48 hrs, gene expression was assayed. f) Expression of MITF-DN in HupT3 cells causes a decrease in autophagy-lysosome gene expression compared to control cells (left panel; * p < 0.02). Similar results are seen in PSN1 cells expressing Doxycycline (Dox)-inducible MITF-DN upon addition of 1 μg/ml of Dox for 48 hrs (right panel; * p < 0.05). For all graphs error bars indicate mean ± s.d. for N = 3 independent experiments.
Extended Data Figure 3
Extended Data Figure 3. MiT/TFE transcription factors escape mTOR-mediated cytoplasmic retention in PDA
a) Subcellular localization of ectopically expressed GFP-TFEB in HPDE cells under full nutrient and starvation conditions (3 hrs HBSS) (left) and Torin1 dependent nuclear localization of ectopically expressed FLAG-MITF (left) or FLAG-TFE3 (right) in HPNE cells (right). b) Subcellular localization of ectopically expressed GFP-MITF (left panels) or GFP-TFE3 (right panels) in HupT3 and 8988T cells respectively under full nutrient and starvation conditions (3 hrs HBSS). c–d) Subcellular fractionation studies showing that endogenous TFE3 (c) and MITF (d) are constitutively nuclear localized in PDA cell lines. e) Immunofluorescence staining of endogenous TFEB in A13A and 8902 PDA cells. Note the predominant nuclear localization under both full nutrient (FED) and starved conditions. f) Subcellular fractionation of PL18 and HupT3 PDA cells under full nutrient, amino acid (AA) starved and AA re-fed conditions shows constitutive nuclear residence of endogenous MITF regardless of the nutrient status of the cells. Lamin = nuclear fraction; GAPDH = cytoplasmic fraction. g) Subcellular fractionation of Panc1 cells and a primary patient-derived culture (PDAC1) showing constitutive nuclear localization of TFE3 (in Panc1) and MITF (in PDAC1) independent of Torin1 treatment. h) Immunoblot for phospho-ERK1/2 in the indicated cell lines treated with vehicle or with the MEK inhibitor, AZD6244 (AZD). i) Neither AZD6244 nor Torin1 affect MITF localization (PL18 cells) or TFE3 localization (8988T cells). j) Immunoblot showing readily detectable phospho-p70S6K in the indicated non-PDA and PDA cell lines, and extinction of phosphorylation upon Torin1 treatment. k) Immunofluorescence showing that AA re-feeding of starved 8988T and Panc1 PDA cells results in mTOR (green) translocation from a diffuse cytoplasmic distribution to the lysosome (LAMP2; red), as indicated by co-localization with LAMP2. Scale bar = 20 μm. l) The indicated non-PDA (left panels) and PDA cell lines (right panels) stably expressing FLAG-tagged TFE3 (F-TFE3) or MITF (F-MITF) were treated with vehicle or Torin1. Cells were then lysed, subjected to FLAG immunoprecipitation and immunoblotted for FLAG and 14-3-3. Note that in all cell lines, 14-3-3 is detected in the anti-FLAG immunoprecipitates and binding is lost upon Torin1 treatment. All images shown are representative of at least N = 3 independent experiments.
Extended Data Figure 4
Extended Data Figure 4. IPO8 drives increased MiT/TFE nuclear import in PDA cells
a) Identification of IPO8 as a PDA-specific binding partner of TFE3. HPDE (left panel), PSN1 (middle panel) and 8988T cells (right panel) stably expressing FLAG-TFE3 or control vector were subjected to affinity purification, followed by multiplexed quantitative proteomics analysis using tandem-mass tag (TMT) reagents. The graphs show normalized protein intensities in the FLAG-TFE3 and control samples. Note the specific enrichment of IPO8 in the FLAG-TFE3-expressing PDA cell lines. In HPDE cells, IPO8 did not score as a significantly enriched interactor (mean log2 ratio flag-TFE3/control = −0.14 (N = 3), p = 0.30 (paired two-tailed t-test), while in PSN1 and 8988T IPO8 was significantly enriched in TFE3 immunoprecipitates (mean log2 ratio flag-TFE3/control = 4.35 (N = 3), p = 0.015 (PSN1) and mean log2 ratio flag-TFE3/control = 1.70 (N = 3), p = 0.002 (8988T)). b) Immunoprecipitation of endogenous IPO8 with FLAG-TFE3 in a PDA cell line (PSN1) and primary PDA culture (PDAC3). c) qRT-PCR showing increased expression of IPO8 in PDAC cell lines and primary patient-derived cultures (red bars) compared to control pancreatic ductal cells (HPDE and HPNE, black bars). d) quantification of IPO8 immunohistochemistry staining intensity (0 = no staining to 3 = high staining) in normal (N = 11) and PDA (N = 110) patient samples. e) Subcellular fractionation and immunoblot analyses of the indicated cell lines transfected with control siRNA (siCTRL) or siIPO8. Note that siIPO8 leads to a marked decrease in nuclear TFE3 in PDA cells (PSN1 and Panc1) (left panel) and in whole cell lysates (right panel). f) Immunoblot of whole cell lysates showing that IPO8+IPO7 knockdown decreases the levels of MITF and TFEB in PL18 and 8902 cells respectively. g) Knockdown of IPO8 has no effect on total TFE3 protein (left) or mRNA (right) levels in HPDE and HPNE cells. Error bars indicate mean ± s.d. for N = 3 independent experiments. h) Torin1 induced TFE3 nuclear localization in HPNE cells is unaffected by knockdown of IPO8. i) qRT-PCR showing that siRNA-mediated knockdown of IPO8, or of both IPO8 and IPO7, effectively reduces target expression without significantly affecting the expression of TFE3, TFEB or MITF mRNA levels. Error bars indicate mean ± s.d. for N = 3 independent experiments. j) Immunoblot of 8988T cells transfected with control siRNA (siCTRL) or siIPO8 and treated with cycloheximide (CHX) for the indicated time points shows a decrease in steady-state levels and stability of TFE3 upon loss of IPO8. Data are representative of N = 3 independent experiments.
Extended Data Figure 5
Extended Data Figure 5. Altered lysosome morphology and function following loss of MiT/TFE factors
a) RNAi-mediated knockdown of MITF in PL18 (right panel; N = 259 siCTRL, N = 263 siMITF) or TFEB in PaTu8902 cells (left panel; N = 273 siCTRL, N = 147 siTFEB) causes aberrant lysosome morphology and an increase in lysosome diameter as visualized by immunofluorescence staining for LAMP2. ** p < 0.001. b) Lysosome size in HPDE cells is not affected by knockdown of MITF (N = 156) and TFE3 (N = 81), and is only slightly increased by TFEB knockdown (N = 198) relative to siCTRL (N = 296). N.S. = not significant. * p < 0.05, Scale bar = 7.5 μm. c) Electron microscopy of 8988T PDA cells transfected with siCTRL (panels 1–5) or siTFE3 (panels 6–10). Note that TFE3 loss causes an accumulation of undigested material shown by asterisks indicating a defect in clearance (graph indicates % lysosomes filled with cargo; N = 80 lysosomes for siCTRL and N = 153 lysosomes for siTFE3) and an increase in average lysosome diameter (quantified in graph on the right; N = 63 lysosomes in siCTRL and N = 68 lysosomes in siTFE3). Scale bar = 1μm. ** p < 0.001 d) Immunofluorescence staining with LC3 (green) and LAMP2 (red) in 8988T cells following siRNA-mediated knockdown of TFE3, shows similar accumulation of undigested LC3-positive aggregates encapsulated within enlarged LAMP2 positive lysosomes (bottom panel) compared to control cells (top panel). Magnifications of the boxed regions are shown (right panels). Scale bar = 7.5 μm.
Extended Data Figure 6
Extended Data Figure 6. Ectopic MiT/TFE expression in PDA cell lines causes an increase in autophagy-lysosome function
a, b) Ectopic expression of MITF induces autophagy-lysosome genes in HPDE cells (a), and causes an increased abundance of LC3 puncta (b) as measured by immunoflourescence staining of endogenous LC3 (red) and quantified in the graph on the right. * p < 0.01, ** p < 0.001. Scale bar = 7.5 μm. c) Ectopic expression of FLAG-tagged MITF or TFE3 in HPDE cells (left panel) or HPNE cells (right panel) causes an increase in autophagic flux as measured by the increase in LC3-II versus LC3-I, following treatment with 25 μM Chloroquine (CQ) for 18 hrs. MITF and TFE3 protein expression is represented by immunoblot for FLAG. d) Expression of MITF in 8902 PDA cells (which lack MITF expression) or in MiaPaca cells (which express low levels of all MiT/TFE members) causes an increase in autophagy-lysosome gene expression. * p < 0.05. e) Dox-inducible expression of MITF in MiaPaca cells causes an increase in endogenous LC3 positive puncta, as measured in the graph on the right, indicating increased autophagy induction. N = 68 cells, –Dox; N = 100 cells, +Dox, ** p < 0.001. Scale bar = 15 μm.
Extended Data Figure 7
Extended Data Figure 7. Role of lysosome in maintaining AA levels in PDA
a) AA uptake was measured as fold change in extracellular AA in 8988T cells following transfection with 2 siRNA against TFE3 relative to siCTRL. Media was changed 1hr before media samples were harvested for analysis. Data is matched to results presented in Fig 3B. b–d) Effect of BafA1 (b), siTFE3 (c), and siATG5 (d) on intracellular AA levels in the indicate cell lines. Error bars represent mean ± s.d. for N = 3 independent experiments. * p < 0.05.
Extended Data Figure 8
Extended Data Figure 8. MiT/TFE factors couple amino acid metabolism to energy homeostasis in PDA
a) Knockdown of TFE3 in PSN1 and 8988T cells causes an increase in p-ACC (Ser 79) and p-AMPK (Thr 172) levels. b) Knockdown of TFE3 (in 8988T and PSN1 cells) or MITF (in HupT3 cells) causes a decrease in cellular ATP levels. N = 3 independent experiments, * p < 0.05, ** p < 0.001. c) BafA1 treatment (150 nM) for 18 hrs induces p-ACC and p-AMPK in PDA cells but not in HPDE, HPNE or QGP1 cells. d) Forced expression of MITF or TFE3 in HPDE cells causes a decrease in p-ACC and p-AMPK levels.
Extended Data Figure 9
Extended Data Figure 9. Regulation of in vitro and in vivo growth by MiT/TFE factors
a) A panel of human PDA cell lines were infected with shRNAs targeting MITF, TFE3 or TFEB. Growth relative to cells infected with shGFP control was assayed 8–10 days post infection. Note that sensitivity to individual knockdown correlates with the relative expression of each factor (see Extended Data Figure 1F). Colored bars indicate knockdown condition, which leads to the greatest growth impairment. b) Selective sensitivity of PDA cells compared to non-PDA cells (QGP1, HPNE and the NSCLC cell line H460) to treatment with 50 μM CQ for 4 days. Error bars indicate mean ± s.e.m. * p < 0.05. c) Immunoblot showing robust detection of LC3-II across a panel of primary patient-derived cultures (PDAC 1–6) and PDA cell lines. d) Subcellular fractionation showing that PDA patient cultures have constitutively nuclear MITF and TFE3. e) qRT-PCR showing that MITF (left) or TFE3 (right) knockdown suppressed multiple autophagy-lysosomal genes in patient-derived PDA cells. * p < 0.01. f) Immunofluorescence staining for LAMP2 showing that MITF (N = 212 siCTRL, N = 220 siMITF), TFE3 (N = 228 siCTRL, N = 244 siTFE3), TFEB (N = 229 siCTRL, N = 271 siTFEB) knockdown results in enlarged, dysmorphic lysosomes in patient-derived PDA cultures. Scale bar = 7.5 μm. ** p < 0.0001. g) Knockdown of the indicated MiT/TFE factors inhibits colony formation in a series of primary PDA cultures. h) 8988T cells infected in vitro with shGFP or shTFE3 (left panel) and PL18 cells infected with shGFP or 2 hairpins targeting MITF (shMITF_1 and shMITF_2; right panel) were implanted subcutaneously on both flanks of SCID mice (N = 4 mice per group). Tumor xenograft growth was monitored over the course of 70 (8988T) and 50 (PL18) days. Error bars indicate mean ± s.e.m. i) Forced expression of MITF in KrasG12D mouse PanIN cells causes an increase in autophagy-lysosome gene expression relative to control cells in vitro. * p < 0.005. Data are representative of N = 3 independent experiments.
Figure 1
Figure 1. Coordinate induction of an autophagy-lysosome gene program in PDA by MiT/TFE proteins
a) Immunofluorescence staining showing extensive overlap of autophagosomes (LC3) and lysosomes (LAMP2) in 8988T cells compared to HPDE cells. b) Representative transmission electron micrographs showing increased abundance of lysosomes in PDA compared to normal pancreas. Relative lysosome numbers/cell are quantified (see Methods). N = 473 cells from 4 normal specimens and 406 cells from 3 PDA specimens..** p < 0.001 c) Upregulation of autophagy/lysosomal genes in PDA relative to matched normal tissue (see Table S2). d, e) Immunohistochemistry showing upregulation of autophagy and lysosomal proteins (d) and nuclear localized TFE3 (e) in the PDA epithelium (closed arrowheads) compared to normal pancreas (left) or stromal cells (open arrowheads). Graph (e) shows quantification of TFE3 staining intensity (0 = no staining to 3 = high staining) in normal (N = 31) and PDA samples (N = 354). f) GSEA showing correlation between MiT/TFE (3TF) expression and the autophagy-lysosome gene signature in primary human PDA. g, h) TFE3 knockdown in 8988T cells causes coordinate downregulation of autophagy-lysosome genes. (g) RNA-seq values from N = 3 independent experiments; p < 0.05 for each gene; (h) GSEA. Scale bars: 11 μm (a), 500 nm (b), 50 μm (d) and 20 μm (e).
Figure 2
Figure 2. Constitutive nuclear import of MiT/TFE factors controls autophagy-lysosome function in PDA
a, b) Fluorescence microscopy showing localization of (a) GFP-MITF and (b) GFP-TFE3 in the indicated cells under fed and starved (3 hrs HBSS) conditions. c) Immunoblots for TFE3 (left three panels), MITF (middle panel) and TFEB (right panel) in cytoplasmic (C) and nuclear (N) fractions of cells treated with vehicle or Torin1 (250 nM) for 1hr. d) FLAG-TFE3 was stably expressed in cells and lysates were immunoprecipitated with anti-FLAG antibody or control IgG and immunoblotted for FLAG (TFE3) or IPO8. e) Representative IPO8 immunostaining in human specimens. f) PDA cell lines were transfected with the indicated siRNAs, fractionated and immunoblotted for TFE3, (8988T cells, left panel), MITF (PL18 cells, middle panel) or TFEB (8902 cells, right panel). g) TFE3 knockdown causes aberrant lysosomal morphology and increased size as shown by LAMP2 staining. Inset: magnified view. Graph (right): quantification of lysosome diameter in cells expressing shGFP (N = 151), shTFE3 (N = 193), or treated with BafA1 (N = 52). ** p <0.0001. h) Electron micrographs showing accumulation of undigested cargo in lysosomes upon TFE3 knockdown. i) Measurement of lysosomal pH in 8988T cells transfected with the indicated siRNAs. N = 3 independent experiments; ** p < 0.001 (see Methods). j) Quantification of total number of autolysosomes (mCherry+/GFP spots) from N = 10 cells/condition using a tandem mCherry-GFP-LC3 reporter. Error bars represent mean ± s.e.m. ** p < 0.0001. k) Proteolysis of macropinocytosed protein is impaired by TFE3 knockdown or BafA1 treatment as determined by pulse-chase with DQ-BSA. Degradation of DQ-BSA in lysosomes is quantified (number of fluorescent spots/cell co-localizing with LAMP2+ lysosomes for N = 3 independent experiments with at least 50 cells scored per experiment). ** p < 0.0001. Scale bars = 18 μm (a, b), 50 μm (e), 7.5 μm (g).
Figure 3
Figure 3. MiT/TFE factors maintain autolysosome derived pools of amino acids
a) Global metabolite profiling of 8988T and PSN1 cells following TFE3 knockdown reveals preferential decrease in AA compared to other general metabolite groups (see Methods). (grey: no change, red: increase, green: decrease). b) Quantification of fold change in AA levels in 8988T cells transfected with siCTRL or siTFE3. * p < 0.03, ** p < 0.003. c) BafA1 causes a decrease in AA levels in PDA cells (left panel), while AA are unchanged or increased in HPDE cells (right panel); * p < 0.05, ** p < 0.005. d) Immunoblot for p-p70S6K levels in the indicated cells at sequential times following 10% AA starvation. e) p-p70S6K immunoblots in 8988T cells transfected with siCTRL or siTFE3 and grown under control conditions or in 0% or 10% AA for the indicated times. f, g) HPDE-MITF cells show (f) sustained p-p70S6K levels under AA starvation and (g) enhanced colony formation under transient starvation with 10% AA (quantified in the graph).* p < 0.001. For all graphs, error bars indicate mean ± s.d. for N = 3 independent experiments.
Figure 4
Figure 4. MiT/TFE factors are required for PDA growth
a) Knockdown of the indicated MiT/TFE factors impairs in vitro colony-forming ability in a panel of PDA cell lines. b) Expression of shRNA-resistant MITF in PL18 cells (left) or TFE3 in Panc1 cells (right) rescues growth following shRNA-mediated knockdown of MITF or TFE3. Error bars indicate mean ± s.d. for N = 3 independent experimets; ** p < 0.001. c) Forced expression of MITF or TFE3 sensitizes HPNE cells to growth inhibition by CQ. Error bars indicate mean ± s.d. for N = 3 independent experiments; * p < 0.005, ** p < 0.0001. d) TFE3 knockdown with two independent shRNAs significantly impairs subcutaneous xenograft growth of Panc1 cells. Error bars indicate mean ± s.e.m. for N = 6 tumors/group; * p < 0.03. e) MITF overexpression in KrasG12D mouse PanIN cells promotes tumorigenesis upon orthotopic injection. N = 5 mice per group; ** p < 0.001. Scale bar = 200 μm. f) In PDA, the MiT/TFE factors are upregulated and exhibit increased nuclear residence due to IPO8/IPO7-mediated trafficking, leading to transcriptional induction of autophagy-lysosome genes and increased biogenesis and function of these organelles. Autophagy-lysosome expansion integrates two major pathways for nutrient scavenging and metabolic adaption in PDA, autophagy and digestion of serum proteins obtained by macropinocytosis.

Comment in

References

    1. White E. Exploiting the bad eating habits of Ras-driven cancers. Genes Dev. 2013;27:2065–2071. doi: 10.1101/gad.228122.113. - DOI - PMC - PubMed
    1. Yang S, et al. Pancreatic cancers require autophagy for tumor growth. Genes Dev. 2011;25:717–729. doi: 10.1101/gad.2016111. - DOI - PMC - PubMed
    1. Rosenfeldt MT, et al. p53 status determines the role of autophagy in pancreatic tumour development. Nature. 2013;504:296–300. doi: 10.1038/nature12865. - DOI - PubMed
    1. Yang A, et al. Autophagy Is Critical for Pancreatic Tumor Growth and Progression in Tumors with p53 Alterations. Cancer Discov. 2014;4:905–913. doi: 10.1158/2159-8290.CD-14-0362. - DOI - PMC - PubMed
    1. Kroemer G, Marino G, Levine B. Autophagy and the integrated stress response. Molecular cell. 2010;40:280–293. doi: 10.1016/j.molcel.2010.09.023. - DOI - PMC - PubMed

Publication types

MeSH terms

Substances

Associated data