

Piecewise Pulse Wave Imaging (pPWI) for Detection and Monitoring of Focal Vascular Disease in Murine Aortas and Carotids In Vivo
- PMID: 26168432
- PMCID: PMC4703464
- DOI: 10.1109/TMI.2015.2453194
Piecewise Pulse Wave Imaging (pPWI) for Detection and Monitoring of Focal Vascular Disease in Murine Aortas and Carotids In Vivo
Abstract
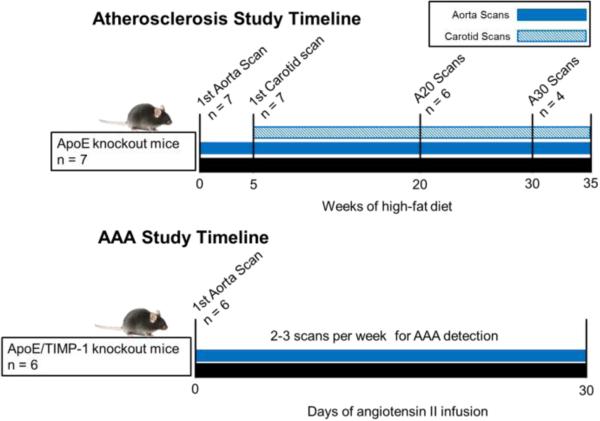
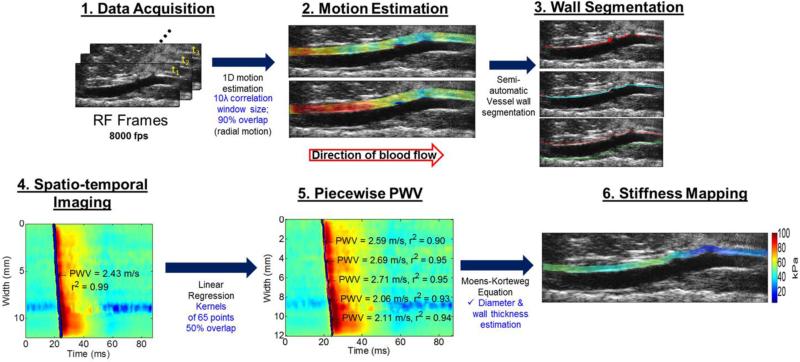
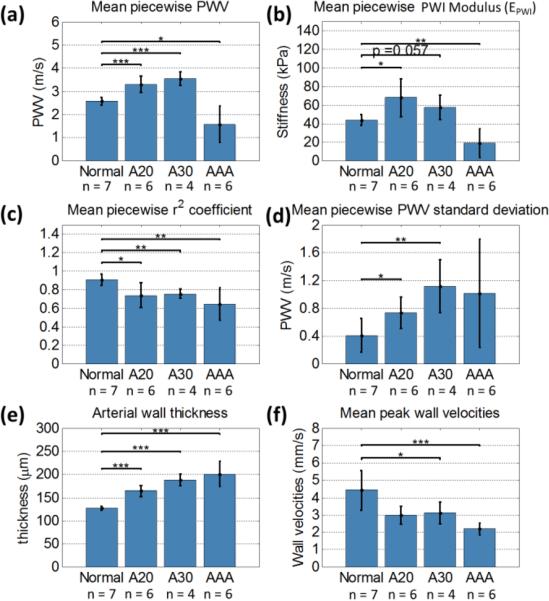
Atherosclerosis and Abdominal Aortic Aneurysms (AAAs) are two common vascular diseases associated with mechanical changes in the arterial wall. Pulse Wave Imaging (PWI), a technique developed by our group to assess and quantify the mechanical properties of the aortic wall in vivo, may provide valuable diagnostic information. This work implements piecewise PWI (pPWI), an enhanced version of PWI designed for focal vascular diseases. Localized, sub-regional PWVs and PWI moduli ( EPWI ) were estimated within 2-4 mm wall segments of murine normal, atherosclerotic and aneurysmal arteries. Overall, stiffness was found to increase in the atherosclerotic cases. The mean sub-regional PWV was found to be 2.57±0.18 m/s for the normal aortas (n = 7) with a corresponding mean EPWI of 43.82±5.86 kPa. A significant increase ( (p ≤ 0.001)) in the group means of the sub-regional PWVs was found between the normal aortas and the aortas of mice on high-fat diet for 20 ( 3.30±0.36 m/s) and 30 weeks ( 3.56±0.29 m/s). The mean of the sub-regional PWVs ( 1.57±0.78 m/s) and EPWI values ( 19.23±15.47 kPa) decreased significantly in the aneurysmal aortas (p ≤ 0.05) . Furthermore, the mean coefficient of determination (r(2)) of the normal aortas was significantly higher (p ≤ 0.05) than those of the aneurysmal and atherosclerotic cases. These findings demonstrated that pPWI may be able to provide useful biomarkers for monitoring focal vascular diseases.
Figures
Similar articles
-
Arterial wall mechanical inhomogeneity detection and atherosclerotic plaque characterization using high frame rate pulse wave imaging in carotid artery disease patients in vivo.Phys Med Biol. 2020 Jan 17;65(2):025010. doi: 10.1088/1361-6560/ab58fa. Phys Med Biol. 2020. PMID: 31746784 Free PMC article.
-
Pulse wave imaging of normal and aneurysmal abdominal aortas in vivo.IEEE Trans Med Imaging. 2009 Apr;28(4):477-86. doi: 10.1109/TMI.2008.928179. Epub 2008 Jul 15. IEEE Trans Med Imaging. 2009. PMID: 19272985
-
Adaptive Pulse Wave Imaging: Automated Spatial Vessel Wall Inhomogeneity Detection in Phantoms and in-Vivo.IEEE Trans Med Imaging. 2020 Jan;39(1):259-269. doi: 10.1109/TMI.2019.2926141. Epub 2019 Jul 1. IEEE Trans Med Imaging. 2020. PMID: 31265387 Free PMC article.
-
Novel applications of contrast-enhanced ultrasound imaging in vascular medicine.Vasa. 2013 Jan;42(1):17-31. doi: 10.1024/0301-1526/a000244. Vasa. 2013. PMID: 23385223 Review.
-
Contrast-enhanced ultrasound: clinical applications in patients with atherosclerosis.Int J Cardiovasc Imaging. 2016 Jan;32(1):35-48. doi: 10.1007/s10554-015-0713-z. Epub 2015 Jul 24. Int J Cardiovasc Imaging. 2016. PMID: 26206524 Free PMC article. Review.
Cited by
-
Unsupervised deep learning-based displacement estimation for vascular elasticity imaging applications.Phys Med Biol. 2023 Jul 24;68(15):10.1088/1361-6560/ace0f0. doi: 10.1088/1361-6560/ace0f0. Phys Med Biol. 2023. PMID: 37348487 Free PMC article.
-
Modified high-resolution wavenumber analysis for detection of pulse wave velocity using coefficient of variation of arterial wall acceleration waveforms.J Med Ultrason (2001). 2020 Apr;47(2):167-177. doi: 10.1007/s10396-019-00998-4. Epub 2020 Jan 2. J Med Ultrason (2001). 2020. PMID: 31894429
-
Arterial wall mechanical inhomogeneity detection and atherosclerotic plaque characterization using high frame rate pulse wave imaging in carotid artery disease patients in vivo.Phys Med Biol. 2020 Jan 17;65(2):025010. doi: 10.1088/1361-6560/ab58fa. Phys Med Biol. 2020. PMID: 31746784 Free PMC article.
-
Pulse wave imaging using coherent compounding in a phantom and in vivo.Phys Med Biol. 2017 Mar 7;62(5):1700-1730. doi: 10.1088/1361-6560/aa553a. Epub 2016 Dec 21. Phys Med Biol. 2017. PMID: 28002039 Free PMC article.
-
An inverse approach to determining spatially varying arterial compliance using ultrasound imaging.Phys Med Biol. 2016 Aug 7;61(15):5486-507. doi: 10.1088/0031-9155/61/15/5486. Epub 2016 Jul 6. Phys Med Biol. 2016. PMID: 27384105 Free PMC article.
References
-
- Libby P, Ridker PM, Maseri A. Clinical cardiology: new frontiers. Circ. 2002;105:1135–1143. - PubMed
-
- Naghavi M, Libby P, Falk E, Casscells SW, Litovsky S, Rumberger J, Badimon JJ, Stefanidis C, Moreno P, Pasterkamp G, Fayad Z, Stone PH, Waxman S, Raggi P, Madjid M, Zarrabi A, Burke A, Yuan C, Fitzgerald PJ, et al. From vulnerable plaque to vulnerable patient: a call for new definitions and risk assessment strategies. Circ. 2003;(108):1664–1672. - PubMed
-
- Roger VL, Go AS, Lloyd-Jones DM, Benjamin EJ, Berry JD, Borden WB, Mratava DM, Dai S, Ford ES, Fox CS, Fullerton HJ, Gillespie C, Hailpern SM, Heit JA, Ho PM, Howard VJ, Kissela BM, Kittner SJ, Lackland DT, et al. Heart disease and stroke statistics - 2012 update : a report from the american heart association. Circ. 2012;125:e2–e220. - PMC - PubMed
-
- Go AS, Mozaffarian D, Roger VL, Benjamin EJ, Berry JD, Bordern WB, Bravata DM, Dai S, Ford ES, Fox CS, Franco S, Fullerton HJ, Gillespie C, Hailpern SM, Heit JA, Howard VJ, Huffman MD, Kissela BM, Kittner SJ, Lackland DT, et al. Heart disease and stroke statistics - 2013 update: a report from the american heart association. Circ. 2013;127:e6–e245. - PMC - PubMed
-
- Maurice RL, Fromageau J, Brusseau E, Finet G, Rioufol G, Cloutier G. On the potential of the Lagrangian estimator for endovascular ultrasound elastography: in vivo human coronary artery study. Ultrasound Med. Biol. 2007;33(8):1199–1205. - PubMed
Publication types
MeSH terms
Grants and funding
LinkOut - more resources
Full Text Sources
Other Literature Sources
