Finding directionality and gene-disease predictions in disease associations
- PMID: 26168918
- PMCID: PMC4501277
- DOI: 10.1186/s12918-015-0184-9
Finding directionality and gene-disease predictions in disease associations
Abstract
Background: Understanding the underlying molecular mechanisms in human diseases is important for diagnosis and treatment of complex conditions and has traditionally been done by establishing associations between disorder-genes and their associated diseases. This kind of network analysis usually includes only the interaction of molecular components and shared genes. The present study offers a network and association analysis under a bioinformatics frame involving the integration of HUGO Gene Nomenclature Committee approved gene symbols, KEGG metabolic pathways and ICD-10-CM codes for the analysis of human diseases based on the level of inclusion and hypergeometric enrichment between genes and metabolic pathways shared by the different human disorders.
Methods: The present study offers the integration of HGNC approved gene symbols, KEGG metabolic pathways andICD-10-CM codes for the analysis of associations based on the level of inclusion and hypergeometricenrichment between genes and metabolic pathways shared by different diseases.
Results: 880 unique ICD-10-CM codes were mapped to the 4315 OMIM phenotypes and 3083 genes with phenotype-causing mutation. From this, a total of 705 ICD-10-CM codes were linked to 1587 genes with phenotype-causing mutations and 801 KEGG pathways creating a tripartite network composed by 15,455 code-gene-pathway interactions. These associations were further used for an inclusion analysis between diseases along with gene-disease predictions based on a hypergeometric enrichment methodology.
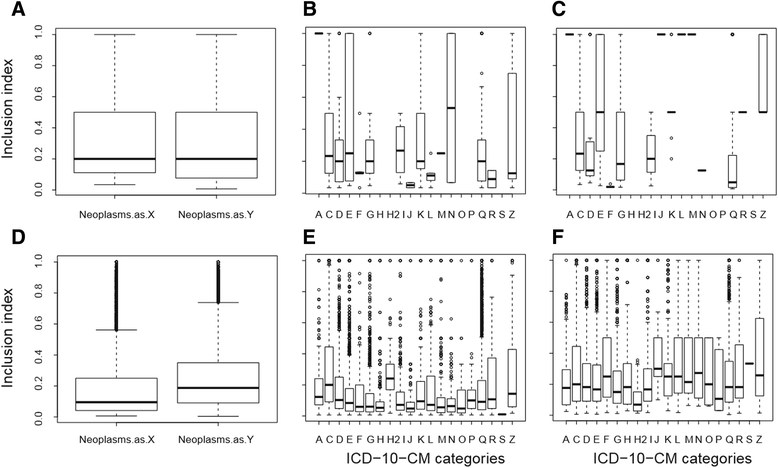
Conclusions: The results demonstrate that even though a large number of genes and metabolic pathways are shared between diseases of the same categories, inclusion levels between these genes and pathways are directional and independent of the disease classification. However, the gene-disease-pathway associations can be used for prediction of new gene-disease interactions that will be useful in drug discovery and therapeutic applications.
Figures


Similar articles
-
Pathway networks generated from human disease phenome.BMC Med Genomics. 2018 Sep 14;11(Suppl 3):75. doi: 10.1186/s12920-018-0386-2. BMC Med Genomics. 2018. PMID: 30255817 Free PMC article.
-
eDGAR: a database of Disease-Gene Associations with annotated Relationships among genes.BMC Genomics. 2017 Aug 11;18(Suppl 5):554. doi: 10.1186/s12864-017-3911-3. BMC Genomics. 2017. PMID: 28812536 Free PMC article.
-
PhenPath: a tool for characterizing biological functions underlying different phenotypes.BMC Genomics. 2019 Jul 16;20(Suppl 8):548. doi: 10.1186/s12864-019-5868-x. BMC Genomics. 2019. PMID: 31307376 Free PMC article.
-
Network biology concepts in complex disease comorbidities.Nat Rev Genet. 2016 Oct;17(10):615-29. doi: 10.1038/nrg.2016.87. Epub 2016 Aug 8. Nat Rev Genet. 2016. PMID: 27498692 Review.
-
Drug Target Interplay: A Network-based Analysis of Human Diseases and the Drug Targets.Curr Top Med Chem. 2018;18(13):1053-1061. doi: 10.2174/1568026618666180719160922. Curr Top Med Chem. 2018. PMID: 30027850 Review.
Cited by
-
Exploring polygenic contributors to subgroups of comorbid conditions in autism spectrum disorder.Sci Rep. 2022 Mar 1;12(1):3416. doi: 10.1038/s41598-022-07399-7. Sci Rep. 2022. PMID: 35233033 Free PMC article.
-
GENEASE: real time bioinformatics tool for multi-omics and disease ontology exploration, analysis and visualization.Bioinformatics. 2018 Sep 15;34(18):3160-3168. doi: 10.1093/bioinformatics/bty182. Bioinformatics. 2018. PMID: 29590301 Free PMC article.
-
Turning genome-wide association study findings into opportunities for drug repositioning.Comput Struct Biotechnol J. 2020 Jun 12;18:1639-1650. doi: 10.1016/j.csbj.2020.06.015. eCollection 2020. Comput Struct Biotechnol J. 2020. PMID: 32670504 Free PMC article. Review.
References
-
- Rozenblatt-Rosen O, Deo RC, Padi M, Adelmant G, Calderwood MA, Rolland T, Grace M, Dricot A, Askenazi M, Tavares M, Pevzner SJ, Abderazzaq F, Byrdsong D, Carvunis AR, Chen AA, Cheng J, Correll M, Duarte M, Fan C, Feltkamp MC, Ficarro SB, Franchi R, Garg BK, Gulbahce N, Hao T, Holthaus AM, James R, Korkhin A, Litovchick L, Mar JC, Pak TR, Rabello S, Rubio R, Shen Y, Singh S, Spangle JM, Tasan M, Wanamaker S, Webber JT, Roecklein-Canfield J, Johannsen E, Barabási AL, Beroukhim R, Kieff E, Cusick ME, Hill DE, Münger K, Marto JA, Quackenbush J, Roth FP, DeCaprio JA, Vidal M. Interpreting cancer genomes using systematic host network perturbations by tumour virus proteins. Nature. 2012;487:491–5. doi: 10.1038/nature11288. - DOI - PMC - PubMed
-
- Sharma A, Gulbahce N, Pevzner SJ, Menche J, Ladenvall C, Folkersen L, Eriksson P, Orho-Melander M, Barabási AL. Network-based analysis of genome wide association data provides novel candidate genes for lipid and lipoprotein traits. Mol Cell Proteomics. 2013;12:3398–408. doi: 10.1074/mcp.M112.024851. - DOI - PMC - PubMed
Publication types
MeSH terms
LinkOut - more resources
Full Text Sources
Other Literature Sources

