Comparative Study
. 2015 Jul 14:12:132.
doi: 10.1186/s12974-015-0353-1.

Immune and Epstein-Barr virus gene expression in cerebrospinal fluid and peripheral blood mononuclear cells from patients with relapsing-remitting multiple sclerosis

Affiliations
Comparative Study

Immune and Epstein-Barr virus gene expression in cerebrospinal fluid and peripheral blood mononuclear cells from patients with relapsing-remitting multiple sclerosis

Caterina Veroni et al. J Neuroinflammation. .

Abstract

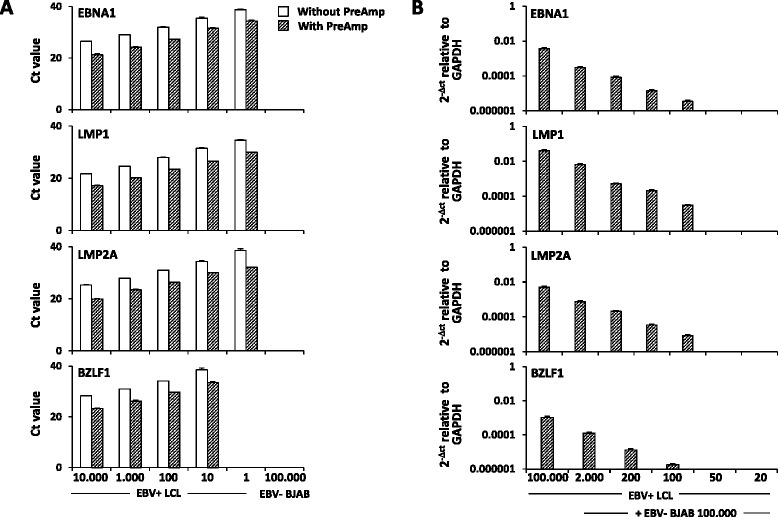
Background: Gene expression analyses in paired cerebrospinal fluid (CSF) and peripheral blood mononuclear cells (PBMC) from patients with multiple sclerosis (MS) are restrained by the low RNA amounts from CSF cells and low expression levels of certain genes. Here, we applied a Taqman-based pre-amplification real-time reverse-transcription polymerase chain reaction (RT-PCR) (PreAmp RT-PCR) to cDNA from CSF cells and PBMC of MS patients and analyzed multiple genes related to immune system function and genes expressed by Epstein-Barr virus (EBV), a herpesvirus showing strong association with MS. Using this enhanced RT-PCR method, we aimed at the following: (1) identifying gene signatures potentially useful for patient stratification, (2) understanding whether EBV infection is perturbed in CSF and/or blood, and (3) finding a link between immune and EBV infection status.

Methods: Thirty-one therapy-free patients with relapsing-remitting MS were included in the study. Paired CSF cells and PBMC were collected and expression of 41 immune-related cellular genes and 7 EBV genes associated with latent or lytic viral infection were determined by PreAmp RT-PCR. Clinical, radiological, CSF, and gene expression data were analyzed using univariate and multivariate (cluster analysis, factor analysis) statistical approaches.

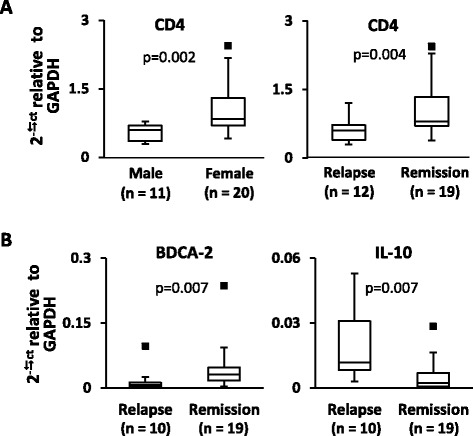
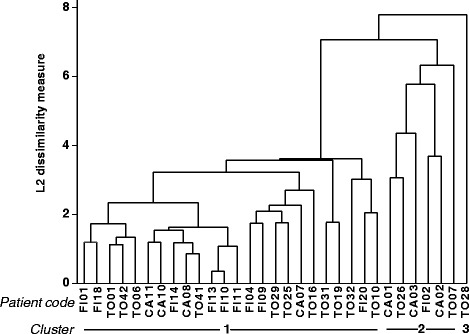
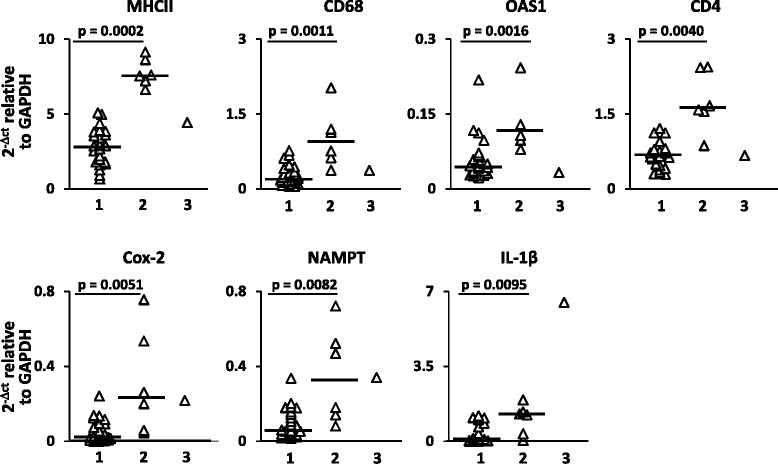
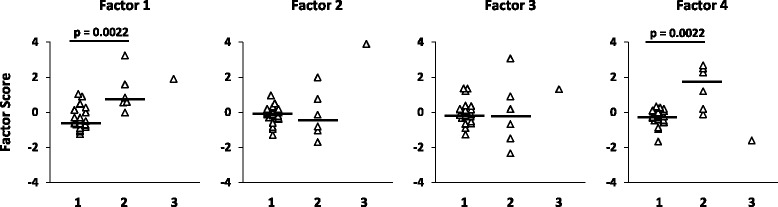
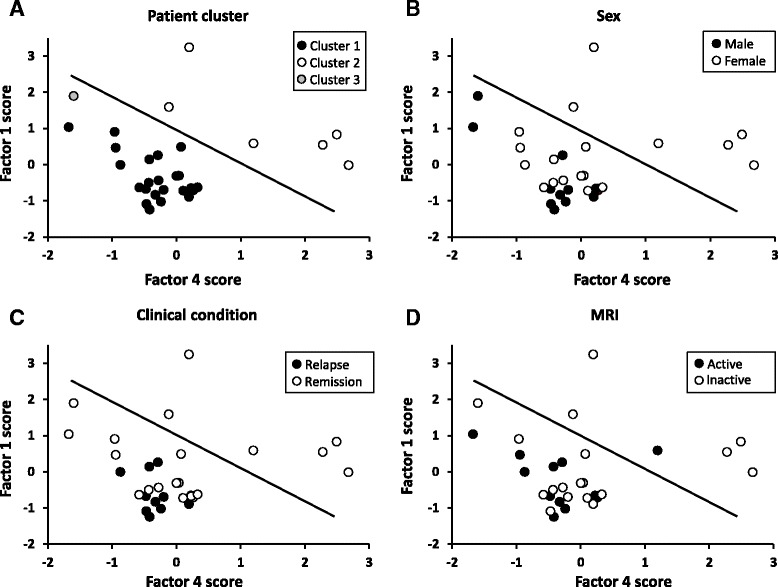
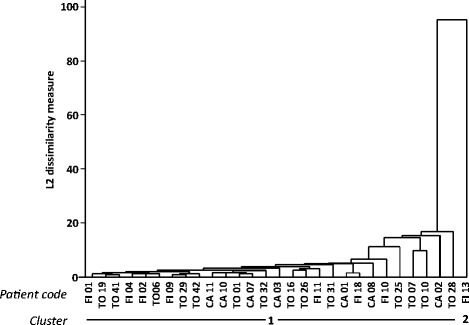
Results: Several immune-related genes were differentially expressed between CSF cells and PBMC from the whole MS cohort. By univariate analysis, no or only minor differences in gene expression were found associated with sex, clinical, or radiological condition. Cluster analysis on CSF gene expression data grouped patients into three clusters; clusters 1 and 2 differed by expression of genes that are related mainly to innate immunity, irrespective of sex and disease characteristics. By factor analysis, two factors grouping genes involved in antiviral immunity and immune regulation, respectively, accurately discriminated cluster 1 and cluster 2 patients. Despite the use of an enhanced RT-PCR method, EBV transcripts were detected in a minority of patients (5 of 31), with evidence of viral latency activation in CSF cells or PBMC and of lytic infection in one patient with active disease only.

Conclusions: Analysis of multiple cellular and EBV genes in paired CSF cell and PBMC samples using PreAmp RT-PCR may yield new information on the complex interplay between biological processes underlying MS and help in biomarker identification.


Figures

Fig. 1
Fig. 1
Improved sensitivity and specificity of PreAmp real-time RT-PCR for EBV transcript detection. a The expression levels of three EBV latent genes (EBNA1, LMP1, LMP2A) and one EBV lytic gene (BZLF1) were investigated in serially diluted EBV transformed (EBV+) LCL and in the EBV negative (EBV−) B lymphoma cell line BJAB, with and without pre-amplification (PreAmp), using Taqman self-designed gene assays. PreAmp resulted in an improvement of 4.1 to 5.1 cycles within the threshold Ct for low gene expression levels (≤35). EBV latent and lytic transcripts were detectable down to 1 and 10 EBV+ LCL cells, respectively; no signal was detected in EBV− BJAB cells confirming assay specificity. b Pre-Amp RT-PCR was applied to cDNA from EBV+ LCL cells that were serially diluted in a background of EBV− BJAB cells; the lower limits of detection of latent and lytic transcripts were one and two EBV+ LCL cells in 1 × 104 EBV− negative cells, respectively
Fig. 2
Fig. 2
Immune-related genes differentially expressed in CSF cells and PBMC from RRMS patients grouped according to sex and clinical status. Gene expression levels were measured in CSF cells (a) and PBMC (b) from 31 and 29 RRMS patients, respectively, using PreAmp RT-PCR. The values obtained were compared between patient groups differing for sex (female/male), clinical (relapse/remission), and MRI status (presence/absence of gadolinium-enhancing lesions). Differences between groups were evaluated by Mann-Whitney test; only statistically significant differences (p < 0.0125 to account for multiple comparisons) are shown. The lines inside the boxes represent the median value; boxes extend from the 25th to the 75th percentile, covering the interquartile range (IQR), and whiskers extend from 25th percentile −1.5 IQR to the 75th percentile +1.5 IQR. Maximum outliers outside the whiskers are represented by individual marks
Fig. 3
Fig. 3
Dendrogram of RRMS patients based on immune gene expression in CSF cells. Cluster analysis was carried out on the expression data of 41 immune-related genes obtained in 31 CSF cell samples, by using average linkage method with Euclidean similarity measure
Fig. 4
Fig. 4
Genes with discriminatory power in cluster analysis. Gene expression values for MHC class II, CD4, CD68, OAS-1, COX-2, NAMPT, and IL-1β in CSF cell samples from RRMS patients clustering into groups 1, 2, and 3 are shown. Significant differences in gene expression between group 1 (n = 24) and group 2 (n = 6) patients were assessed by Mann-Whitney test; p values ≤0.0125 are shown. Each dot represents the gene expression value obtained in each individual patient; the line marks the median value
Fig. 5
Fig. 5
Factor 1 and factor 4 derived from CSF gene expression discriminate patients grouped by cluster analysis. Scores for the four factors defined by factor analysis on CSF gene expression data are shown for each patient classified into clusters 1, 2, or 3 in cluster analysis. Statistically significant differences in factor scores between group 1 (n = 24) and group 2 (n = 6) patients were assessed by Mann-Whitney test; p values ≤0.0125 are shown, n.s. not significant. Each dot represents the score value for that specific factor in each individual patient; the line marks the median value
Fig. 6
Fig. 6
Factor 1 and factor 4 discriminate patients grouped by cluster analysis but not by sex, clinical, or MRI condition. Scatter plots of factor 1 and factor 4 scores in RRMS patients grouped by cluster analysis on CSF gene expression data (a), sex (b), clinical (c), and MRI (d) condition are shown. Cluster 1 and cluster 2 patients, but not patients grouped according to the other parameters, distribute in two distinct areas (separated by the straight line)
Fig. 7
Fig. 7
Dendrogram of RRMS patients based on immune gene expression in PBMC. Cluster analysis was carried out on the expression data of 41 immune-related genes obtained in 29 PBMC samples, by using average linkage method with Euclidean similarity measure

References

    1. Compston A, Coles A. Multiple sclerosis. Lancet. 2008;372:1502–17. doi: 10.1016/S0140-6736(08)61620-7. - DOI - PubMed
    1. Kutzelnigg A, Lassmann H. Pathology of multiple sclerosis and related inflammatory demyelinating diseases. Handb Clin Neurol. 2014;122:15–58. doi: 10.1016/B978-0-444-52001-2.00002-9. - DOI - PubMed
    1. Milo R, Miller A. Revised diagnostic criteria of multiple sclerosis. Autoimmun Rev. 2014;13:518–24. doi: 10.1016/j.autrev.2014.01.012. - DOI - PubMed
    1. Nylander A, Hafler DA. Multiple sclerosis. J Clin Invest. 2012;122:1180–8. doi: 10.1172/JCI58649. - DOI - PMC - PubMed
    1. Hauser SL. The Charcot Lecture|beating MS: a story of B cells, with twists and turns. Mult Scler. 2015;21:8–21. doi: 10.1177/1352458514561911. - DOI - PMC - PubMed

Publication types

MeSH terms

Substances

LinkOut - more resources