

Organization of connections between the amygdala, medial prefrontal cortex, and lateral hypothalamus: a single and double retrograde tracing study in rats
- PMID: 26169110
- PMCID: PMC4713378
- DOI: 10.1007/s00429-015-1081-0
Organization of connections between the amygdala, medial prefrontal cortex, and lateral hypothalamus: a single and double retrograde tracing study in rats
Abstract
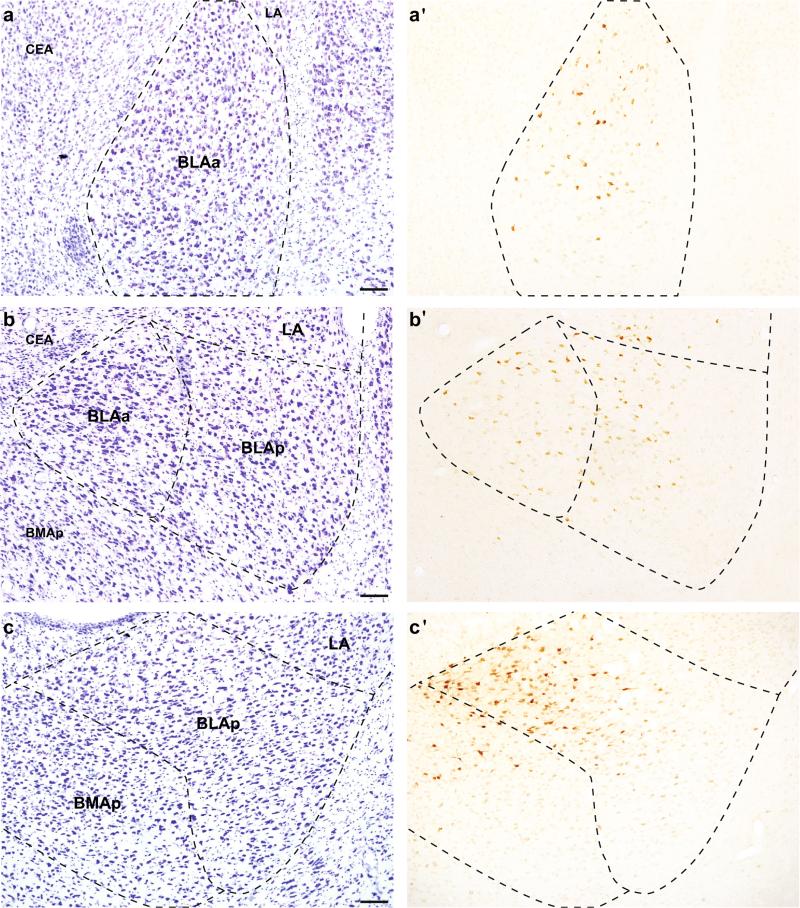
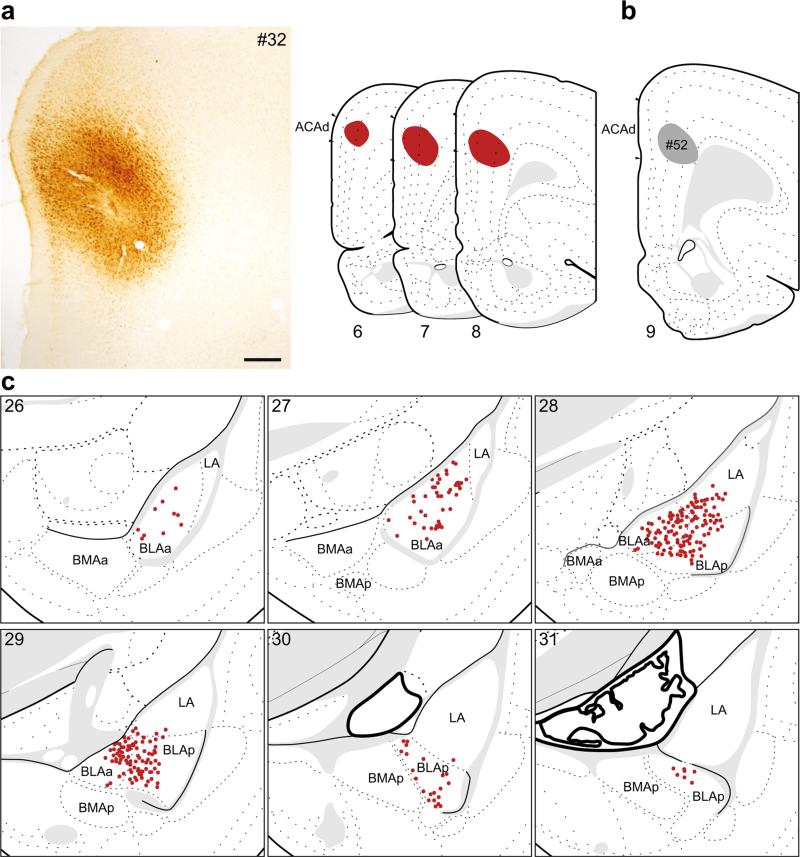
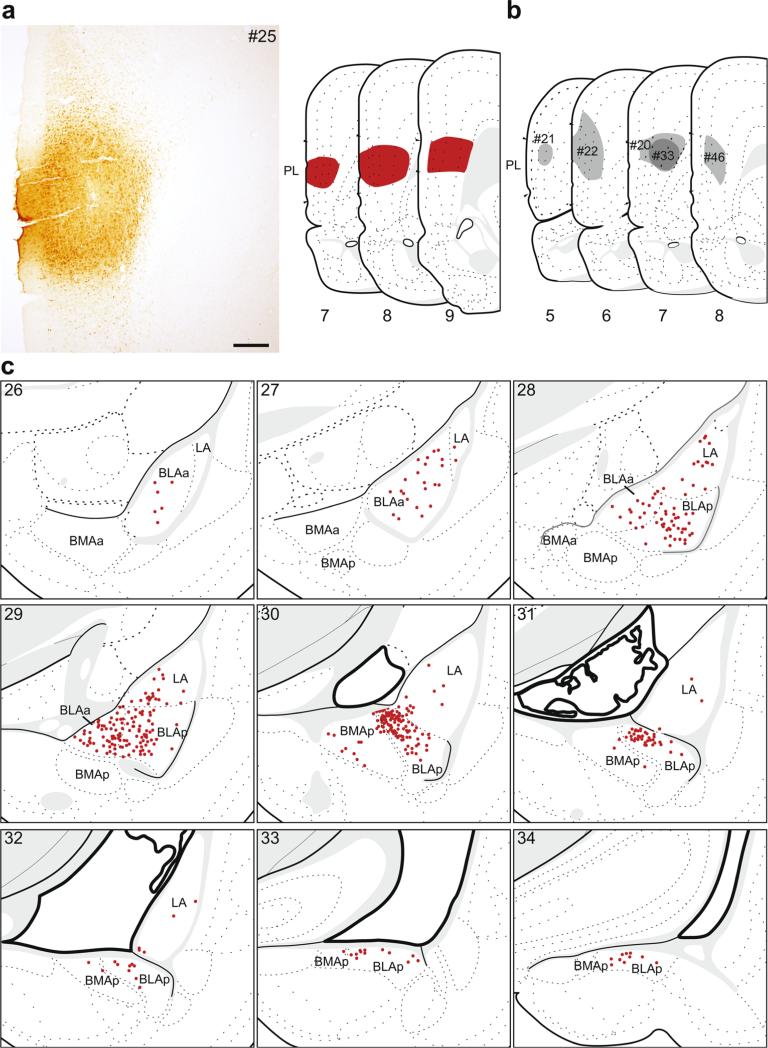
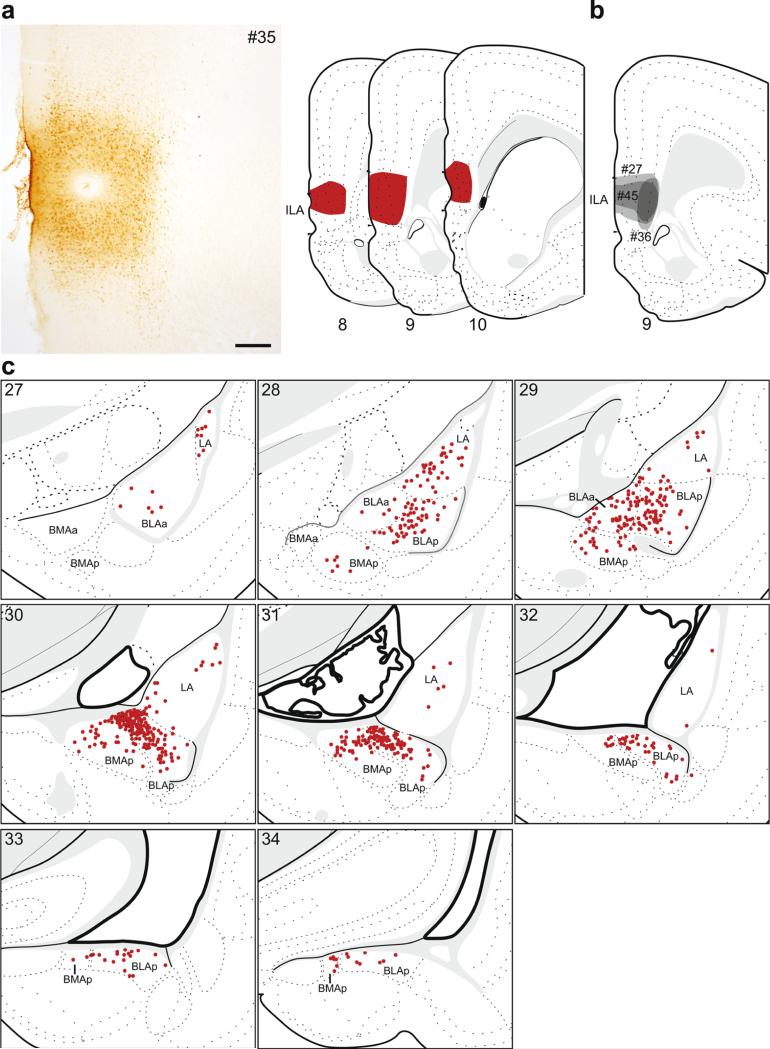
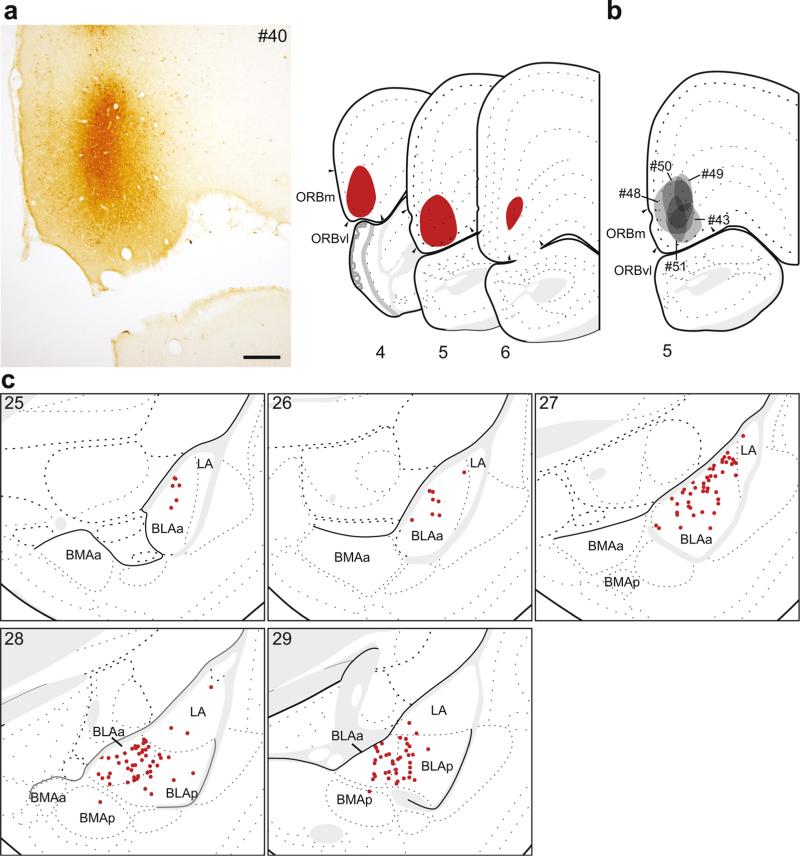
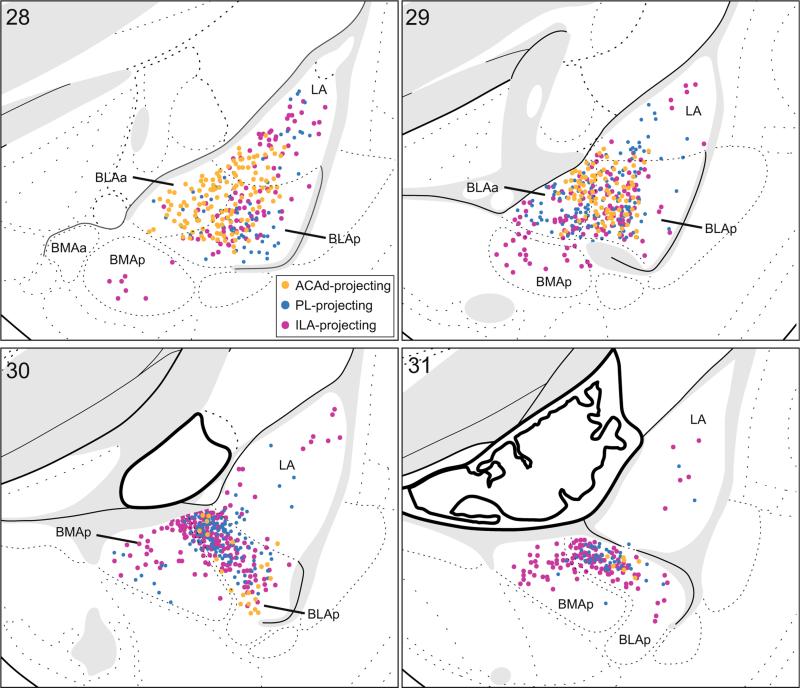
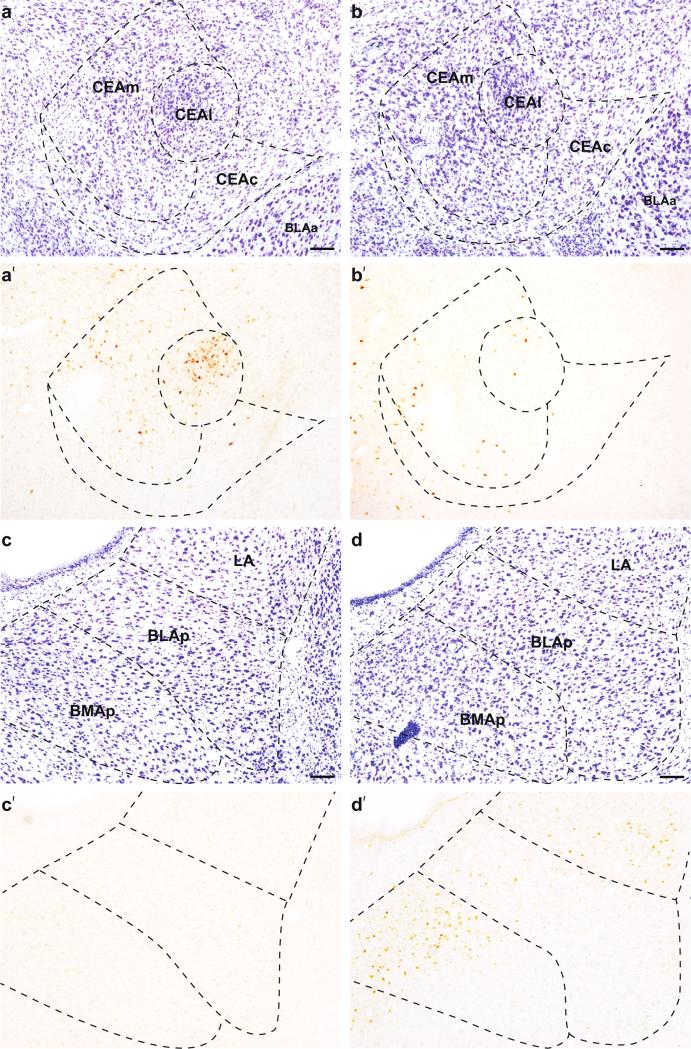
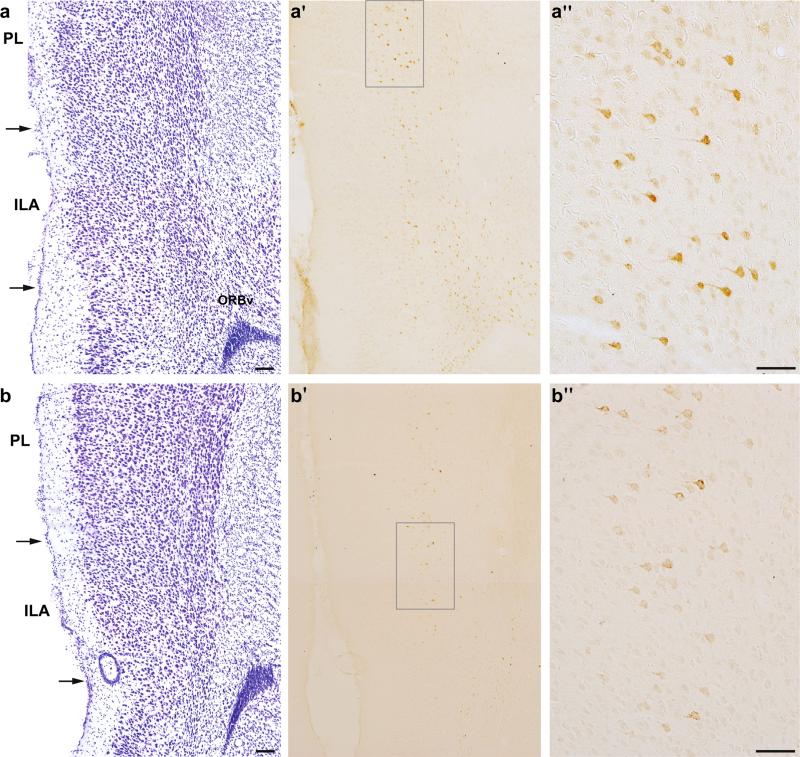
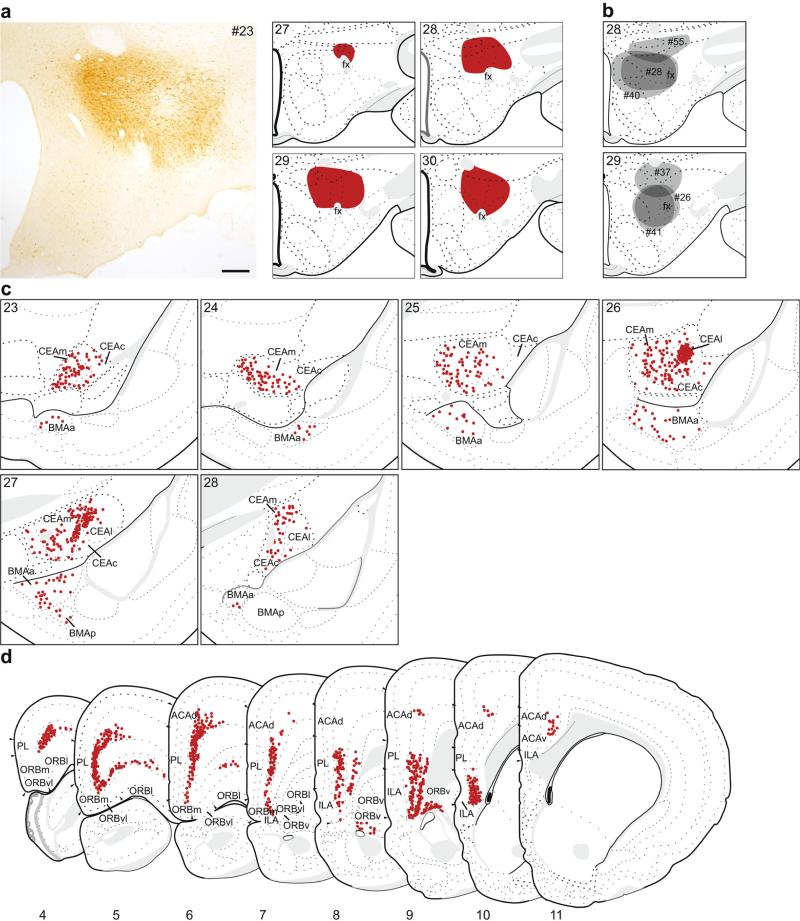
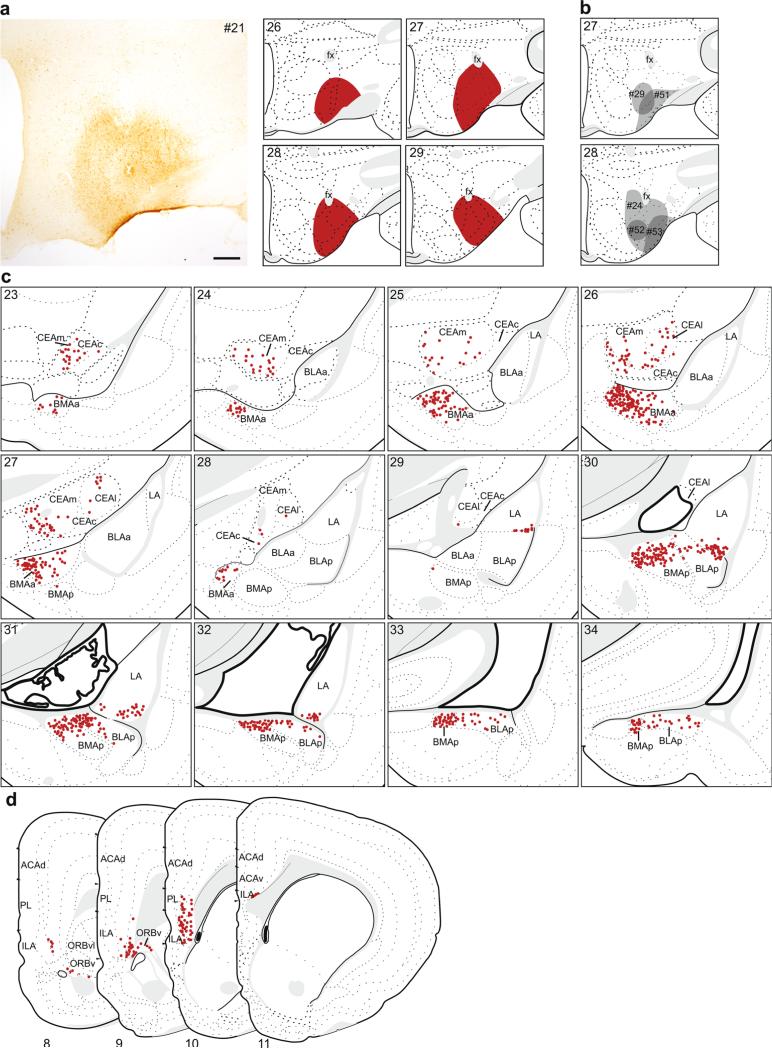
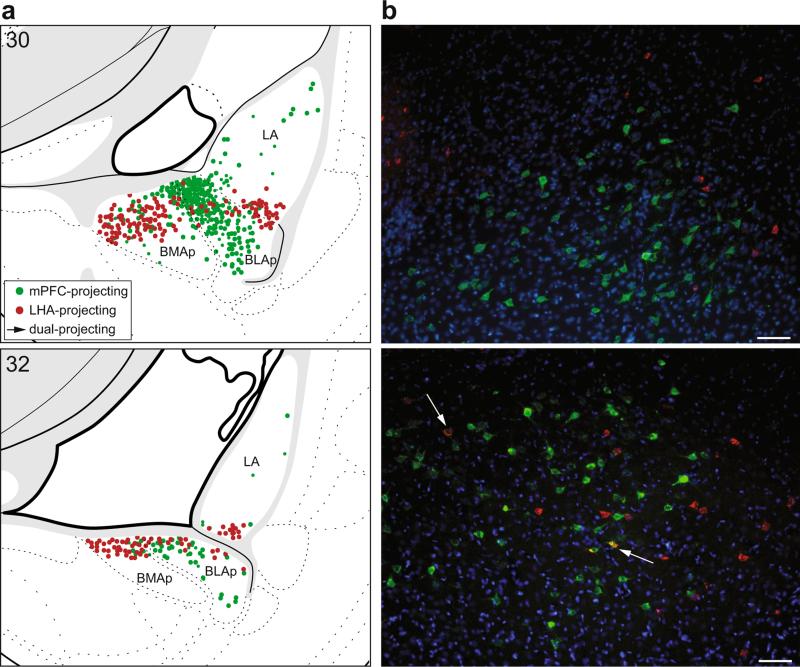
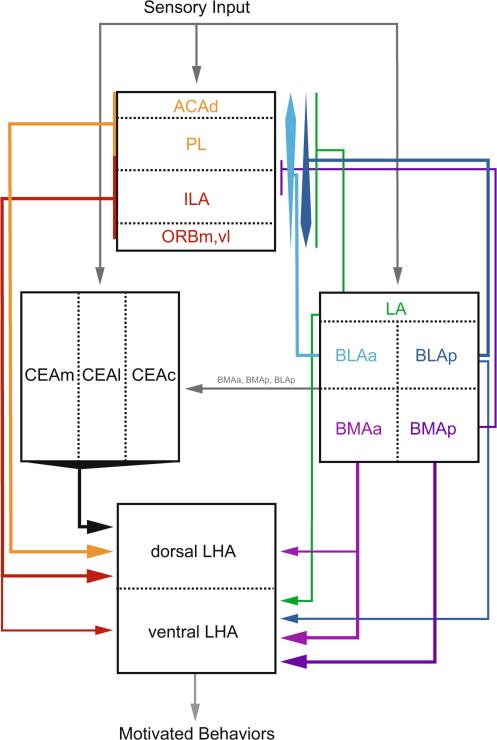
The amygdala and medial prefrontal cortex (mPFC) are highly interconnected telencephalic areas critical for cognitive processes, including associative learning and decision making. Both structures strongly innervate the lateral hypothalamus (LHA), an important component of the networks underlying the control of feeding and other motivated behaviors. The amygdala-prefrontal-lateral hypothalamic system is therefore well positioned to exert cognitive control over behavior. However, the organization of this system is not well defined, particularly the topography of specific circuitries between distinct cell groups within these complex, heterogeneous regions. This study used two retrograde tracers to map the connections from the amygdala (central and basolateral area nuclei) and mPFC to the LHA in detail, and to determine whether amygdalar pathways to the mPFC and to LHA originate from the same or different neurons. One tracer was placed into a distinct mPFC area (dorsal anterior cingulate, prelimbic, infralimbic, or rostromedial orbital), and the other into dorsal or ventral LHA. We report that the central nucleus and basolateral area of the amygdala send projections to distinct LHA regions, dorsal and ventral, respectively. The basolateral area, but not central nucleus, also sends substantial projections to the mPFC, topographically organized rostrocaudal to dorsoventral. The entire mPFC, in turn, projects to the LHA, providing a separate route for potential amygdalar influence following mPFC processing. Nearly all amygdalar projections to the mPFC and to the LHA originated from different neurons suggesting amygdala and amygdala-mPFC processing influence the LHA independently, and the balance of these parallel pathways ultimately controls motivated behaviors.
Keywords: Amygdala; Behavior; Feeding; Hypothalamus; Motivation; Prefrontal cortex.
Figures
Similar articles
-
The organization of the thalamocortical connections of the mediodorsal thalamic nucleus in the rat, related to the ventral forebrain-prefrontal cortex topography.J Comp Neurol. 1992 Sep 8;323(2):167-97. doi: 10.1002/cne.903230204. J Comp Neurol. 1992. PMID: 1401255
-
Parasubthalamic and calbindin nuclei in the posterior lateral hypothalamus are the major hypothalamic targets for projections from the central and anterior basomedial nuclei of the amygdala.Brain Struct Funct. 2017 Sep;222(7):2961-2991. doi: 10.1007/s00429-017-1379-1. Epub 2017 Mar 3. Brain Struct Funct. 2017. PMID: 28258483
-
Elaborating the connections of a closed-loop forebrain circuit in the rat: Circumscribed evidence for novel topography within a cortico-striato-pallidal triple descending projection, with thalamic feedback, to the anterior lateral hypothalamic area.bioRxiv [Preprint]. 2025 Jan 19:2025.01.18.633747. doi: 10.1101/2025.01.18.633747. bioRxiv. 2025. PMID: 39868339 Free PMC article. Preprint.
-
Interactions among the medial prefrontal cortex, hippocampus and midline thalamus in emotional and cognitive processing in the rat.Neuroscience. 2006 Sep 29;142(1):1-20. doi: 10.1016/j.neuroscience.2006.06.027. Epub 2006 Aug 2. Neuroscience. 2006. PMID: 16887277 Review.
-
The distribution of Dlx1-2 and glutamic acid decarboxylase in the embryonic and adult hypothalamus reveals three differentiated LHA subdivisions in rodents.J Chem Neuroanat. 2022 Apr;121:102089. doi: 10.1016/j.jchemneu.2022.102089. Epub 2022 Mar 10. J Chem Neuroanat. 2022. PMID: 35283254 Review.
Cited by
-
Synaptic mechanisms underlying persistent cocaine craving.Nat Rev Neurosci. 2016 Jun;17(6):351-65. doi: 10.1038/nrn.2016.39. Epub 2016 May 6. Nat Rev Neurosci. 2016. PMID: 27150400 Free PMC article. Review.
-
Recent Advances in Neural Circuits for Taste Perception in Hunger.Front Neural Circuits. 2021 Feb 2;15:609824. doi: 10.3389/fncir.2021.609824. eCollection 2021. Front Neural Circuits. 2021. PMID: 33603648 Free PMC article. Review.
-
High-throughput mapping of single-neuron projection and molecular features by retrograde barcoded labeling.Elife. 2024 Feb 23;13:e85419. doi: 10.7554/eLife.85419. Elife. 2024. PMID: 38390967 Free PMC article.
-
Neuronal diversity of the amygdala and the bed nucleus of the stria terminalis.Handb Behav Neurosci. 2020;26:63-100. doi: 10.1016/b978-0-12-815134-1.00003-9. Epub 2020 Mar 31. Handb Behav Neurosci. 2020. PMID: 32792868 Free PMC article. No abstract available.
-
Five Breakthroughs: A First Approximation of Brain Evolution From Early Bilaterians to Humans.Front Neuroanat. 2021 Aug 17;15:693346. doi: 10.3389/fnana.2021.693346. eCollection 2021. Front Neuroanat. 2021. PMID: 34489649 Free PMC article.
References
-
- Allen GV, Cechetto DF. Functional and anatomical organization of cardiovascular pressor and depressor sites in the lateral hypothalamic area. II. Ascending projections. J Comp Neurol. 1993;330:421–438. - PubMed
-
- Arvanitogiannis A, Tzschentke TM, Riscaldino L, Wise RA, Shizgal P. Fos expression following self-stimulation of the medial prefrontal cortex. Behav Brain Res. 2000;107:123–132. - PubMed
Publication types
MeSH terms
Grants and funding
LinkOut - more resources
Full Text Sources
Other Literature Sources
