. 2015 Jul 14;16(1):140.
doi: 10.1186/s13059-015-0699-9.

An integrative pan-cancer-wide analysis of epigenetic enzymes reveals universal patterns of epigenomic deregulation in cancer

Affiliations

An integrative pan-cancer-wide analysis of epigenetic enzymes reveals universal patterns of epigenomic deregulation in cancer

Zhen Yang et al. Genome Biol. .

Abstract

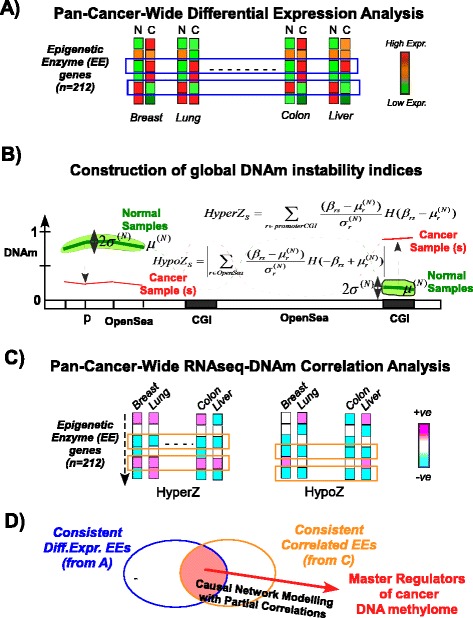
Background: One of the most important recent findings in cancer genomics is the identification of novel driver mutations which often target genes that regulate genome-wide chromatin and DNA methylation marks. Little is known, however, as to whether these genes exhibit patterns of epigenomic deregulation that transcend cancer types.

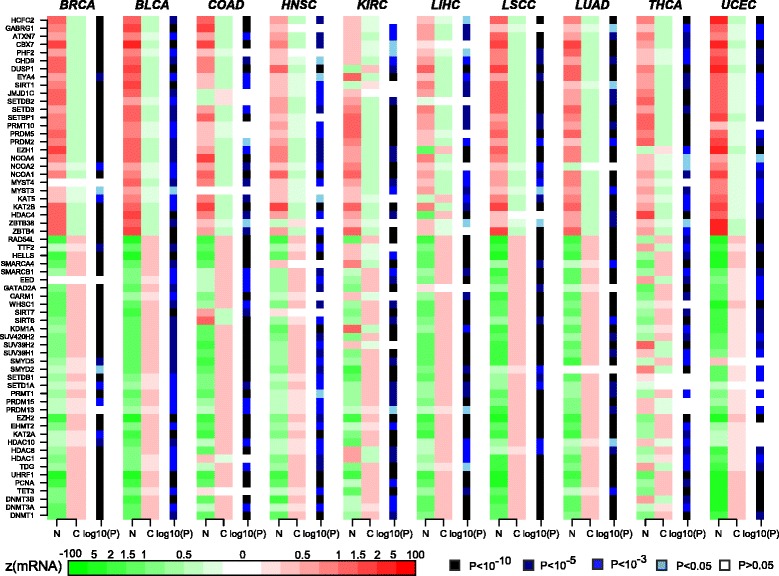
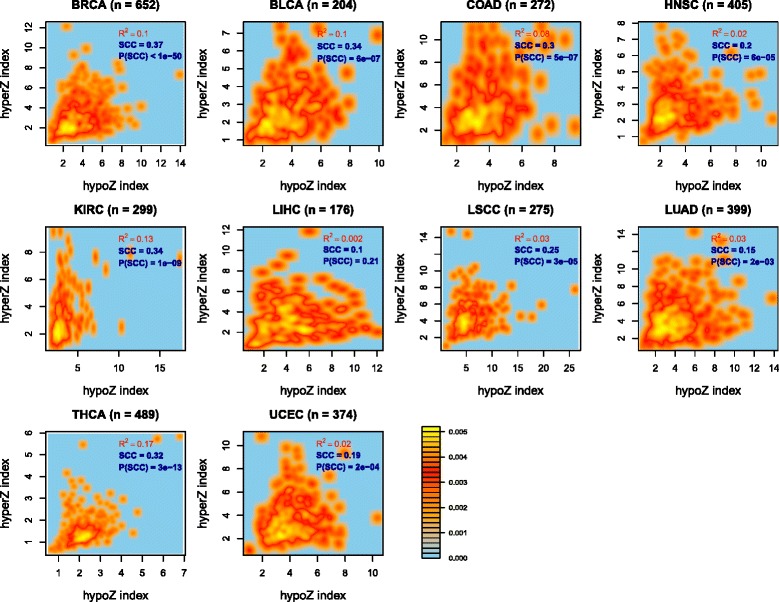
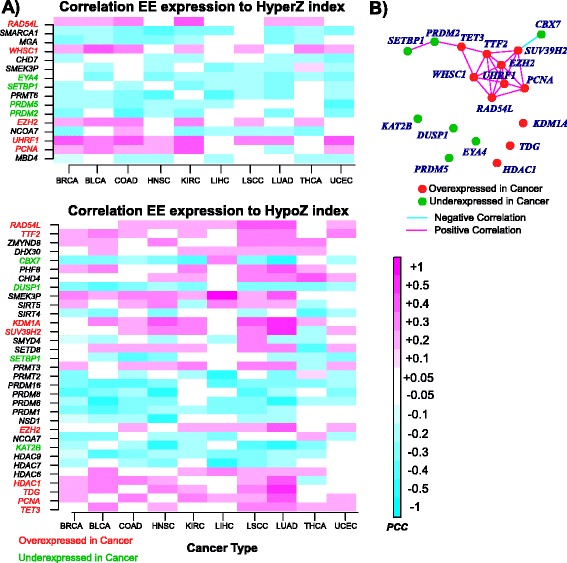
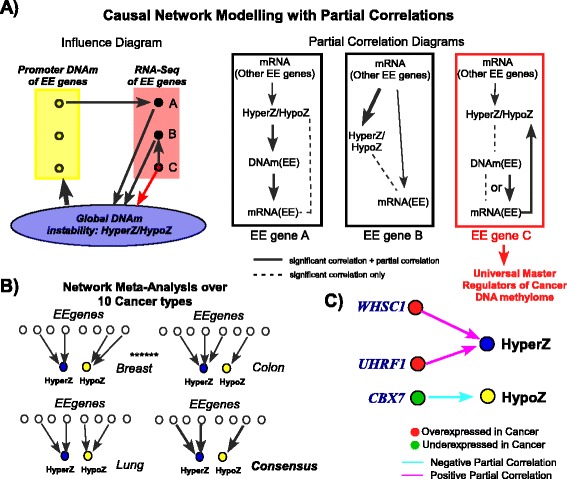
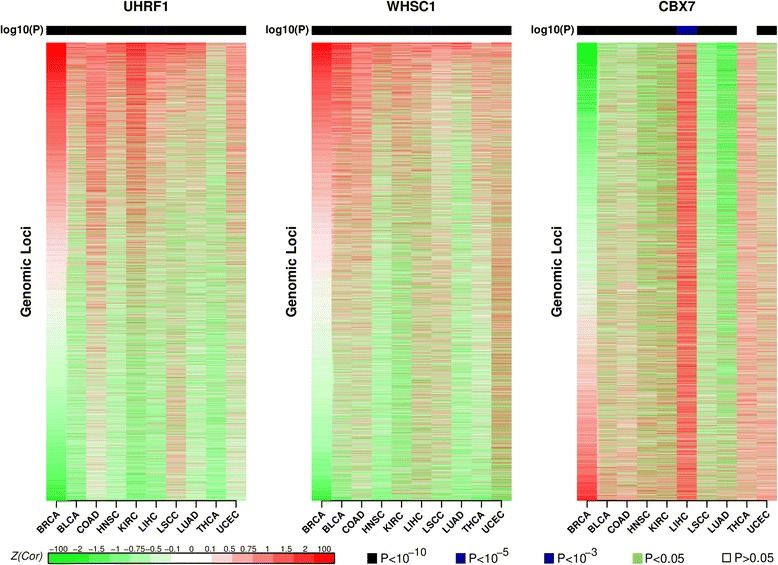
Results: Here we conduct an integrative pan-cancer-wide analysis of matched RNA-Seq and DNA methylation data across ten different cancer types. We identify seven tumor suppressor and eleven oncogenic epigenetic enzymes which display patterns of deregulation and association with genome-wide cancer DNA methylation patterns, which are largely independent of cancer type. In doing so, we provide evidence that genome-wide cancer hyper- and hypo- DNA methylation patterns are independent processes, controlled by distinct sets of epigenetic enzyme genes. Using causal network modeling, we predict a number of candidate drivers of cancer DNA hypermethylation and hypomethylation. Finally, we show that the genomic loci whose DNA methylation levels associate most strongly with expression of these putative drivers are highly consistent across cancer types.

Conclusions: This study demonstrates that there exist universal patterns of epigenomic deregulation that transcend cancer types, and that intra-tumor levels of genome-wide DNA hypomethylation and hypermethylation are controlled by distinct processes.


Figures

Fig. 1
Fig. 1
Identification of master epigenetic regulators of the cancer DNA methylome. a First, we conduct a pan-cancer-wide (TCGA) differential expression analysis of a comprehensive list of 212 “epigenetic enzyme” (EE) genes, defined as genes which play a role in modifying or regulating epigenetic marks, in order to identify those which exhibit consistent up- or downregulation across different cancer types. N normal, C cancer. b Since EE genes may control the epigenome, including the DNA methylome, we computed for each cancer sample two epigenetic instability indices (HyperZ and HypoZ), reflecting the global deviation in DNAm patterns from a normal reference (obtained using the corresponding normal tissue specimens). Briefly, the HyperZ index measures aberrant hypermethylation over promoter CpG islands (CGI) in a given cancer sample, whereas HypoZ measures aberrant hypomethylation over opensea probes (intergenic regions of low CpG density). c Third, we use the matched RNA-Seq and DNAm data of TCGA tumor samples to conduct a pan-cancer-wide correlation analysis between the expression levels of EE genes and these two epigenetic instability indices in order to identify EE genes whose expression variation associates with aberrant cancer DNAm. d Finally, we use causal network modeling of the EE genes which show consistent differential expression and correlation with HyperZ/HypoZ across cancer types to identify the subset of EE genes which appear to control the global variations in DNAm (HyperZ/HypoZ). The causal modeling uses partial correlations to eliminate (indirect) associations between EE gene expression and HyperZ/HypoZ which are mediated by DNAm changes driven by other EE genes
Fig. 2
Fig. 2
Pan-cancer-wide differential expression analysis of epigenetic enzyme genes. Heatmaps of average expression in normal (N) and cancer (C) tissue, across ten different TCGA cancer types (BRCA breast cancer, BLCA bladder cancer, COAD colon adenomacarcinoma, HNSC head and neck squamous carcinoma, KIRC kidney renal carcinoma, LIHC liver hepatocellular carcinoma, LSCC lung squamous cell carcinoma, LUAD lung adenomacarcinoma, THCA thyroid cancer, UCEC uterine cervix endometrial carcinoma) for 62 EE genes which showed consistent differential expression in at least eight of the ten tissue types. The significance level of differential expression is indicated by the sidebars for each heatmap
Fig. 3
Fig. 3
Genome-wide hypomethylation and hypermethylation correlate weakly. For each cancer type (BRCA breast cancer, BLCA bladder cancer, COAD colon adenomacarcinoma, HNSC head and neck squamous carcinoma, KIRC kidney renal carcinoma, LIHC liver hepatocellular carcinoma, LSCC lung squamous cell carcinoma, LUAD lung adenomacarcinoma, THCA thyroid cancer, UCEC uterine cervix endometrial carcinoma), we display two-dimensional density plots (bright yellow indicates highest density) illustrating the distribution of tumors in the plane defined by the HyperZ and HypoZ indices. The number of tumors is given above each panel. For each cancer type, we provide the Spearman correlation coefficient (SCC), its P value, as well as the R2 value for a linear regression
Fig. 4
Fig. 4
Pan-cancer-wide correlation analysis between EE expression and DNA methylation. a Heatmaps of Pearson correlation coefficients between mRNA expression of EE genes and the HyperZ or HypoZ indices, as assessed across cancers from ten different TCGA cancer types (BRCA breast cancer, BLCA bladder cancer, COAD colon adenomacarcinoma, HNSC head and neck squamous carcinoma, KIRC kidney renal carcinoma, LIHC liver hepatocellular carcinoma, LSCC lung squamous cell carcinoma, LUAD lung adenomacarcinoma, THCA thyroid cancer, UCEC uterine cervix endometrial carcinoma). Only EE genes exhibiting significant and directionally consistent correlations in at least six of the ten cancer types are shown. The subset of EE genes which also show significant and directionally consistent differential expression changes between normal and cancer in at least eight of the ten cancer types are colored, with red indicating overexpression in cancer, green underexpression. Those shown in black indicate that these were not consistently differentially expressed across the ten cancer types. b Correlation network meta-analysis (across all ten cancers) of the main epigenetic oncogenes and tumor suppressors which are associated with HyperZ or HypoZ
Fig. 5
Fig. 5
Causal network modeling meta-analysis. a Influence diagram depicts how correlations between expression of EE genes and HyperZ/HypoZ could arise. For gene A, global changes in DNAm affect the DNAm level in its promoter, thereby affecting its expression, resulting in a spurious correlation between mRNA of gene A and HyperZ/HypoZ. For gene B, the correlation of its expression with HyperZ/HypoZ is driven by the expression of another EE gene. For gene C, there is a direct influence between its expression and HyperZ/HypoZ. The partial correlation diagram depicts how these different models can be discriminated. Only for EE genes following model C would we see a significant partial correlation between their expression and HyperZ/HypoZ, whereas for genes of type A and B we would not. b A partial correlation network is derived for each tissue type and results summarized in a meta-analysis over the resulting networks. c Result of the causal network modeling meta-analysis (across all ten cancers) using partial correlation coefficients, identifying three EE genes whose expression patterns associate with HyperZ or HypoZ independently of other EE gene expression and their promoter DNAm levels
Fig. 6
Fig. 6
Correlation heatmaps of EE gene expression with DNAm levels of individual genomic loci across different cancer types. Heatmaps of correlation Fisher Z-statistics between the DNAm levels of ~140,000 genomic regions (~100,000 open sea plus ~40,000 CGI) and mRNA expression of the regulator, as indicated. For UHRF1 and WHSC1, regions have been ranked from positive to negative correlations as determined in breast cancer, whereas for CBX7, regions have been ranked from negative to positive correlations. The same ranking is then used to depict the correlation statistics in the other cancer types. Above the heatmaps we give the P values corresponding to the Spearman rank correlation coefficient between the ranking in breast cancer and the ranking in every other cancer type

References

    1. Hanahan D, Weinberg RA. Hallmarks of cancer: the next generation. Cell. 2011;144:646–74. doi: 10.1016/j.cell.2011.02.013. - DOI - PubMed
    1. Shen H, Laird PW. Interplay between the cancer genome and epigenome. Cell. 2013;153:38–55. doi: 10.1016/j.cell.2013.03.008. - DOI - PMC - PubMed
    1. Plass C, Pfister SM, Lindroth AM, Bogatyrova O, Claus R, Lichter P. Mutations in regulators of the epigenome and their connections to global chromatin patterns in cancer. Nat Rev Genet. 2013;14:765–80. doi: 10.1038/nrg3554. - DOI - PubMed
    1. Fujimoto A, Totoki Y, Abe T, Boroevich KA, Hosoda F, Nguyen HH, et al. Whole-genome sequencing of liver cancers identifies etiological influences on mutation patterns and recurrent mutations in chromatin regulators. Nat Genet. 2012;44:760–4. doi: 10.1038/ng.2291. - DOI - PubMed
    1. Gui Y, Guo G, Huang Y, Hu X, Tang A, Gao S, et al. Frequent mutations of chromatin remodeling genes in transitional cell carcinoma of the bladder. Nat Genet. 2011;43:875–8. doi: 10.1038/ng.907. - DOI - PMC - PubMed

Publication types