. 2015 Oct;83(10):3800-15.
doi: 10.1128/IAI.00184-15. Epub 2015 Jul 13.

Genetically Modified Live Attenuated Leishmania donovani Parasites Induce Innate Immunity through Classical Activation of Macrophages That Direct the Th1 Response in Mice

Affiliations

Genetically Modified Live Attenuated Leishmania donovani Parasites Induce Innate Immunity through Classical Activation of Macrophages That Direct the Th1 Response in Mice

Parna Bhattacharya et al. Infect Immun. 2015 Oct.

Abstract

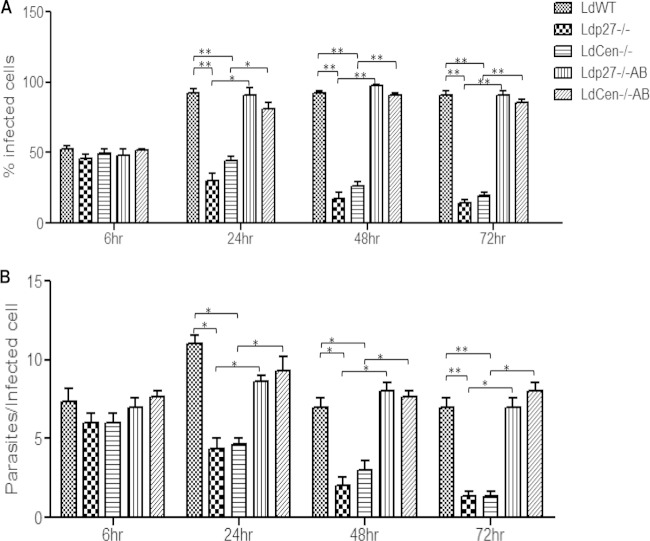
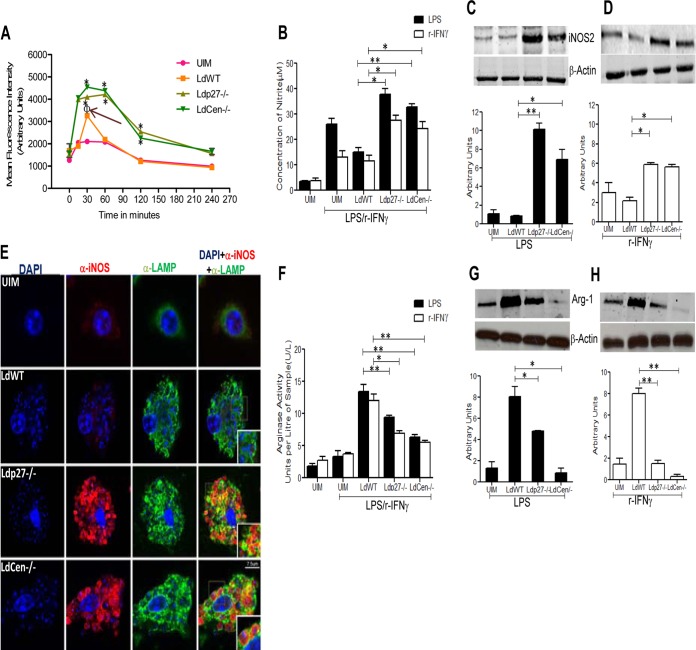
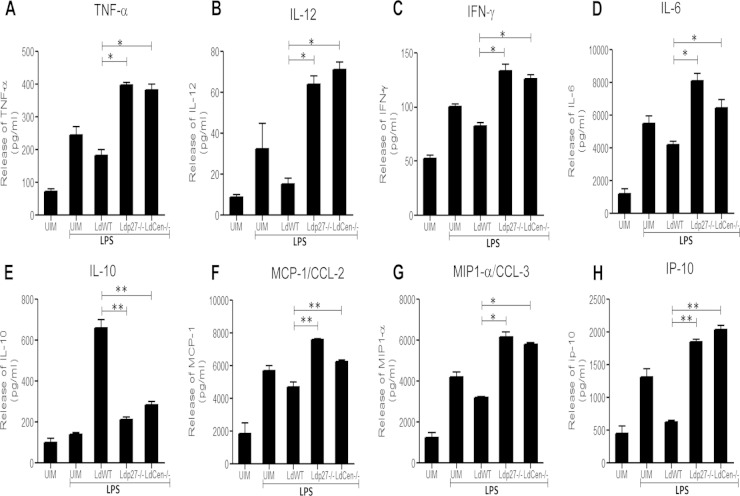
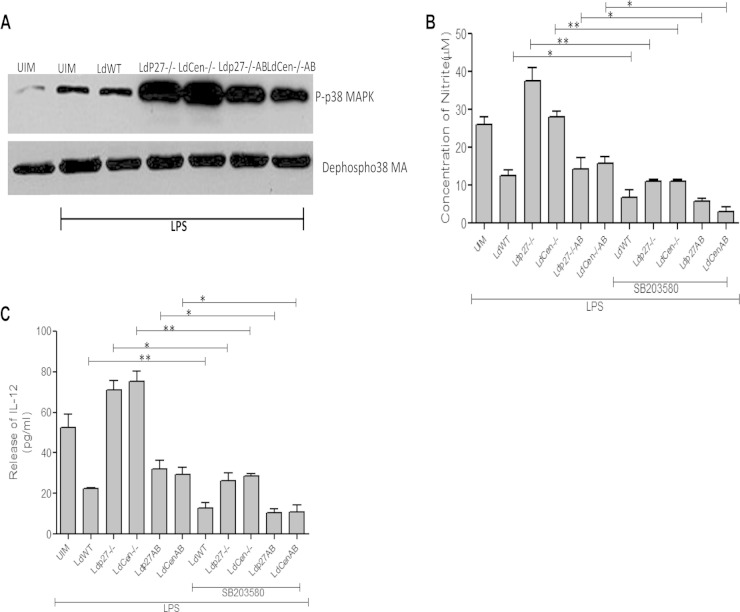
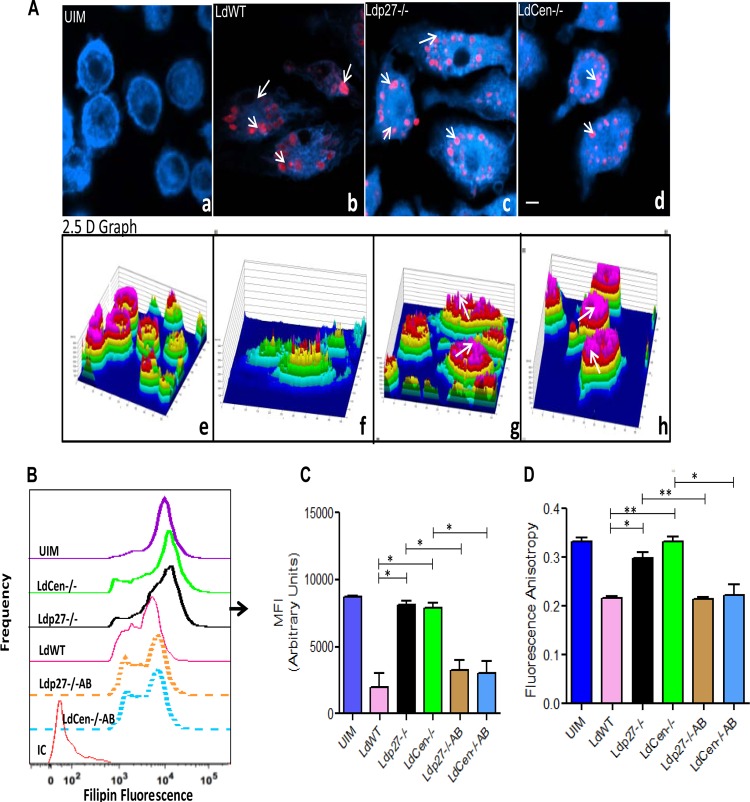
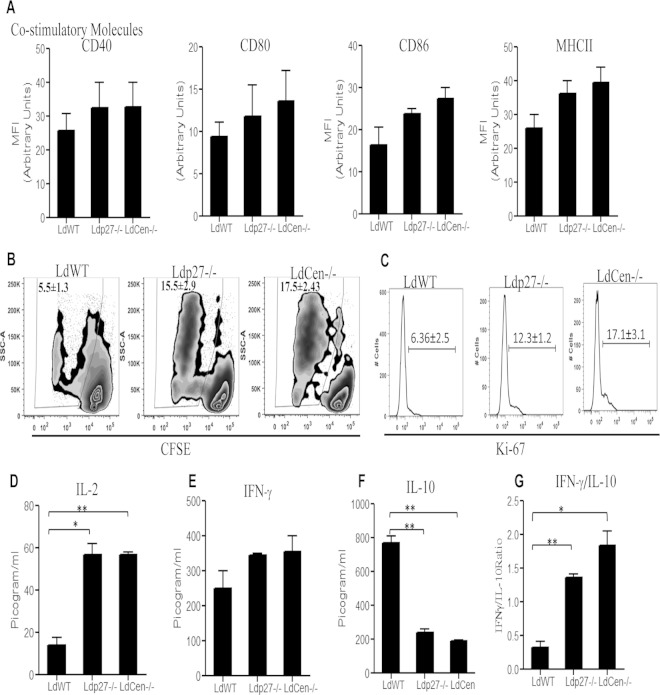
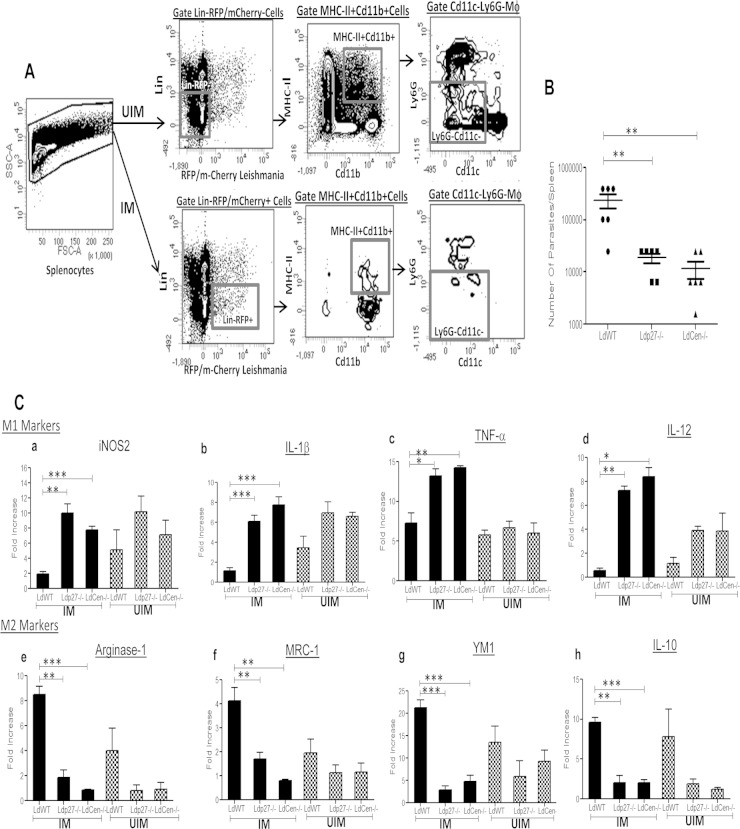
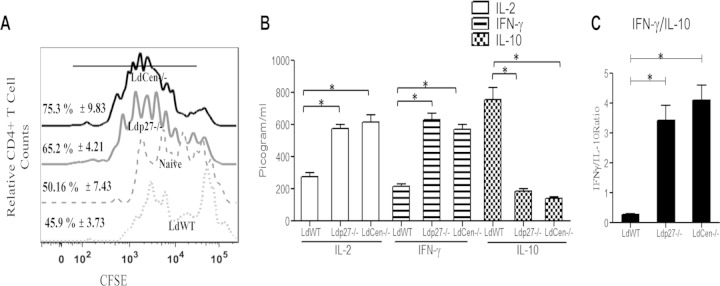
Visceral leishmaniasis (VL) causes significant mortality and there is no effective vaccine. Previously, we have shown that genetically modified Leishmania donovani parasites, here described as live attenuated parasites, induce a host protective adaptive immune response in various animal models. In this study, we demonstrate an innate immune response upon infection with live attenuated parasites in macrophages from BALB/c mice both in vitro and in vivo. In vitro infection of macrophages with live attenuated parasites (compared to that with wild-type [WT] L. donovani parasites) induced significantly higher production of proinflammatory cytokines (tumor necrosis factor alpha [TNF-α], interleukin-12 [IL-12], gamma interferon [IFN-γ], and IL-6), chemokines (monocyte chemoattractant protein 1/CCL-2, macrophage inflammatory protein 1α/CCL-3, and IP-10), reactive oxygen species (ROS), and nitric oxide, while concomitantly reducing anti-inflammatory cytokine IL-10 and arginase-1 activities, suggesting a dominant classically activated/M1 macrophage response. The classically activated response in turn helps in presenting antigen to T cells, as observed with robust CD4(+) T cell activation in vitro. Similarly, parasitized splenic macrophages from live attenuated parasite-infected mice also demonstrated induction of an M1 macrophage phenotype, indicated by upregulation of IL-1β, TNF-α, IL-12, and inducible nitric oxide synthase 2 and downregulation of genes associated with the M2 phenotype, i.e., the IL-10, YM1, Arg-1, and MRC-1 genes, compared to WT L. donovani-infected mice. Furthermore, an ex vivo antigen presentation assay showed macrophages from live attenuated parasite-infected mice induced higher IFN-γ and IL-2 but significantly less IL-10 production by ovalbumin-specific CD4(+) T cells, resulting in proliferation of Th1 cells. These data suggest that infection with live attenuated parasites promotes a state of classical activation (M1 dominant) in macrophages that leads to the generation of protective Th1 responses in BALB/c mice.


Figures

FIG 1
FIG 1
Phagocytosis rate and infectivity of WT and live attenuated parasites in BMDM. BMDM were infected with opsonized WT L. donovani parasites, live attenuated parasites (Ldp27−/− or LdCen−/−) or gene-complemented add-back parasites (Ldp27−/−AB, LdCen−/−AB) (5:1, parasite to macrophage ratio). Intracellular parasite numbers were visualized by Giemsa staining and estimated microscopically at 6 h, 24 h, 48 h, and 72 h postinfection. (A and B) The infection efficiency (percentage of infected cells) (A) and intracellular growth (parasites per infected cell) (B) were recorded. To measure parasite load in these cultures, a minimum of 300 macrophages were counted. The data represent the means ± standard deviations of three independent experiments that all yielded similar results. *, P < 0.05; **, P < 0.005.
FIG 2
FIG 2
Live attenuated parasite infection generates effectors (ROS and NO) along with the attenuation of arginase-1 activity in BMDM in response to LPS or rIFN-γ stimulation, compared to WT infection in vitro. BMDM were either left uninfected or infected with various groups of opsonized parasites for the indicated time periods. (A) ROS generation was measured by H2DCFDA staining of the BMDM. Data for ROS generation (MFI, in arbitrary units) are expressed as means ± standard deviations (SD) from triplicate experiments that yielded similar results. Φ, P < 0.05 compared to UIM; *, P < 0.05 compared to WT-infected BMDM. (B) In a separate experiment, BMDM were left uninfected or infected with different groups of parasites and treated with LPS (1 μg/ml) or rIFN-γ (100 U/ml) for 24 h. Cell-free supernatants were then collected to analyze NO production in the Griess assay as described in Materials and Methods. The data presented are the means ± SD of 3 independent experiments. *, P < 0.05; **, P < 0.005 compared to WT-infected BMDM. (C and D) The nature of iNOS2 expression was determined by Western blotting of BMDM cell lysates uninfected or infected with parasites and treated with LPS or rIFN-γ for 24 h as described above. The blot shown is a representative of experiments performed in triplicate. Band intensities were analyzed by densitometry and are represented by the bar diagram below each blot. The data presented are means ± SD of 3 independent experiments. *, P < 0.05; **, P < 0.005 compared to WT-infected BMDM. (E) BMDM were either left uninfected or infected with various groups of parasites and stimulated with LPS for 24 h as described above. The cells were then processed for immunofluorescence microscopy as described in Materials and Methods. α, antibody. Cells were observed under a confocal laser-scanning microscope. Optical sections (0.3 to 0.5 μm thickness) are shown. The micrographs are representative of 3 independent experiments in which at least 100 cells per sample were analyzed. Bar, 7.5 μm. (F to H) BMDM were either left uninfected or infected with various groups of opsonized parasites and then stimulated with LPS or rIFN-γ for 24 h as described above. From the cell lysates, arginase-1 activity was detected by using an arginase activity assay kit (F), and arginase-1 expression was measured in a Western blot assay (G and H) as described in Materials and Methods. The results are representative of 3 independent experiments with similar findings. Band intensities were analyzed by densitometry and are represented by the bar diagram below each blot. *, P < 0.05; **, P < 0.005 compared to WT-infected BMDM.
FIG 3
FIG 3
Live attenuated parasite infection induces proinflammatory cytokine and chemokine production and dampens anti-inflammatory cytokine generation in BMDM in vitro. BMDM were either left uninfected or infected with various groups of parasites and stimulated with LPS for 24 h as described in the legend for Fig. 2. After 24 h, the levels of TNF-α (A), IL-12 (B), IFN-γ (C), IL-6 (D), IL-10 (E), MCP-1/CCL-2 (F), MIP1-α/CCL-3 (G), or IP-10 (H) in the culture supernatant were evaluated in a multiplex cytokine ELISA as described in Materials and Methods. ELISA data are expressed as means ± SD of values from triplicate experiments that yielded similar results. *, P < 0.05; **, P < 0.005 compared to WT-infected BMDM.
FIG 4
FIG 4
Live attenuated parasite infection induces effector function in BMDM via p38 MAPK activation. (A) BMDM were either left uninfected or infected with various groups of parasites for 2 h. Whole-cell lysates were prepared, subjected to Western blotting, and then assessed for p-p38 MAPK and dephospho-p38 MAPK. The results are representative of 3 independent experiments with similar findings. (B and C) In a separate experiment, BMDM were treated with SB203580 (SB; 10 μg/ml) for 2 h. The cells were then infected with either WT, live attenuated, or add-back parasites and stimulated with LPS for 24 h as described above. Culture supernatants were then collected to analyze NO production (B) and IL-12 production (C). The data represent the means ± standard deviations of three independent experiments. *, P < 0.05; **, P < 0.005.
FIG 5
FIG 5
Live attenuated parasite infection does not deplete membrane cholesterol and does not alter membrane fluidity of BMDM. BMDM were either left uninfected or infected with either RFP-tagged WT or RFP-tagged Ldp27−/− or mCherry-tagged LdCen−/− parasites for 24 h as described in Materials and Methods and then processed for confocal microscopy. (A) Cell preparations were stained with filipin and observed under a confocal laser-scanning microscope. The micrograph is representative of 3 independent experiments in which at least 100 cells per sample were analyzed. Bar, 10 μm. The corresponding filipin fluorescence intensity plots are shown below the respective micrographs, with the fluorescence intensity plotted on the z axis (a six-step rainbow look-up table was used to help visualize the range of intensity values within the micrographs). (B and C) In a separate experiment, BMDM were either left uninfected or infected with WT, live attenuated, or add-back parasites for 24 h. Macrophages were then stained with filipin and analyzed by flow cytometry. Control staining with isotype-matched antibodies was negative. Data are from 1 of 3 experiments conducted in the same way with similar results. *, P < 0.05; **, P < 0.005. (D) BMDM were either left uninfected or infected with various groups of parasites as described above. After 24 h, the membrane fluidity was estimated by calculating the fluorescence anisotropy value. The data represent the mean values ± standard deviations of results from 3 independent experiments that all yielded similar results. *, P < 0.05; **, P < 0.005.
FIG 6
FIG 6
Costimulatory molecule expression and T cell proliferation upon coculture of parasite-infected BMDM with OVA-specific transgenic T cells. (A) BMDM were infected with various groups of parasites as described in Materials and Methods for 24 h. The expression of MHC-II, CD40, CD80, and CD86 on BMDM was studied, and MFI were calculated based on flow cytometry results. (B) BMDM were pulsed with OVA peptide and infected with WT or live attenuated parasites for 24 h and then cocultured with purified CFSE-labeled CD4+ T cells from DO11.10 transgenic mice. CFSE dilution was measured in CD4+-gated T cells pulsed with different leishmanial lines. The experiment was independently repeated three times. (C) In a separate experiment, cell supernatants were collected from BMDM-CD4+ T cell coculture sets and stained with anti-Ki67 –PE and anti-CD4–FITC. T cell proliferation was estimated by flow cytometry by gating on Ki67+ CD4+ cells. Representative histograms shown here are from experiments repeated independently for three times. (D to F) Culture supernatants were collected after 5 days of coculture, and cytokines IL-2 (D), IFN-γ (E), and IL-10 (F) were measured using ELISA kits as per the manufacturer's instructions. (G) The IFN-γ/IL-10 ratio was determined. The data represent the mean values ± standard deviations of results from 3 independent experiments. *, P < 0.05; **, P < 0.005 compared to WT-infected BMDM.
FIG 7
FIG 7
Live attenuated parasite infection in mice induces classical activation (M1 phenotype) of parasitized macrophages isolated from spleens. (A) UIM were sorted from the spleens of different groups of mice (n = 6) by gating live single cells for lineage (T cell, B cell, NK cell) RFP/mCherry Cd11b+ MHCII+ Cd11c Ly6G) markers, whereas parasitized splenic macrophages (IM) were sorted by gating live single cells for lineage (T cell, B cell, NK cell) RFP/mCherry+ Cd11b+ MHC-II+ Cd11c Ly6G) markers. The sorting strategy is displayed. The experiment was repeated 3 times with pooled digests from 6 spleens per experiment. (B) Parasite numbers in spleens of different groups of infected mice were measured 7 days postinfection. Means and standard errors of the means for six mice in each group are shown. Data are representative of two independent experiments. **, P < 0.005. (C) Sorted parasitized and uninfected macrophages from different groups of mice were subjected to RNA isolation as described in Material and Methods. Isolated total RNA was reverse transcribed and expression levels of different genes were analyzed as described in Material and Methods. Normalized expression levels of M1 markers, such as iNOS2, IL-1β, TNF-α, and IL-12, and M2 markers like Arg-1, MRC-1, YM1, and IL-10 were estimated. The data represent the mean values ± standard deviations of results from 3 independent experiments that all yielded similar results.*, P < 0.05; **, P < 0.005; ***, P < 0.0005 compared to WT-infected BMDM.
FIG 8
FIG 8
BMDM from live attenuated parasite-infected mice are more efficient antigen-presenting cells than BMDM from WT-infected mice. BMDM isolated from BALB/c mice either uninfected or infected for 7 days with WT or live attenuated parasites were pulsed with OVA peptide and then cocultured with purified CFSE-labeled CD4+ T cells from DO11.10 transgenic mice. T cell proliferation was estimated by flow cytometry by studying CFSE dilution of gated CD4+ cells and is represented by the histogram. The staggered offset histogram overlay (A) displays the CD4+ T cell proliferation pattern as visualized by CFSE dilution after flow cytometry. (A) Cell proliferation was analyzed in triplicate experiments, and histograms representative of mean values were overlaid for the figure. The black bold line on the histogram overlay represents the percentage of proliferating CD4+ T cells. (B) The culture supernatant fluids were collected and assayed for IL-2, IFN-γ, and IL-10 in an ELISA. (C) The IFN-γ/IL-10 ratio was calculated from the data shown in panel B. The data represent the picogram levels of cytokines in culture supernatants and are presented as means ± standard deviations from three independent experiments. *, P < 0.05 compared to WT-infected BMDM.

References

    1. Das A, Ali N. 2012. Vaccine development against Leishmania donovani. Front Immunol 3:99. doi:10.3389/fimmu.2012.00099. - DOI - PMC - PubMed
    1. Handman E, Bullen DV. 2002. Interaction of Leishmania with the host macrophage. Trends Parasitol 18:332–334. doi:10.1016/S1471-4922(02)02352-8. - DOI - PubMed
    1. Russell DG, Xu S, Chakraborty P. 1992. Intracellular trafficking and the parasitophorous vacuole of Leishmania mexicana-infected macrophages. J Cell Sci 103:1193–1210. - PubMed
    1. Liu D, Uzonna JE. 2012. The early interaction of Leishmania with macrophages and dendritic cells and its influence on the host immune response. Front Cell Infect Microbiol 2:83. doi:10.3389/fcimb.2012.00083. - DOI - PMC - PubMed
    1. Muraille E, Leo O, Moser M. 2014. TH1/TH2 paradigm extended: macrophage polarization as an unappreciated pathogen-driven escape mechanism? Front Immunol 5:603. doi:10.3399/fimmu.2014.00603. - DOI - PMC - PubMed

Publication types

MeSH terms