. 2015 Jul 20;210(2):303-18.
doi: 10.1083/jcb.201411001. Epub 2015 Jul 13.

Rme-8 depletion perturbs Notch recycling and predisposes to pathogenic signaling

Affiliations

Rme-8 depletion perturbs Notch recycling and predisposes to pathogenic signaling

Maria J Gomez-Lamarca et al. J Cell Biol. .

Erratum in

Abstract

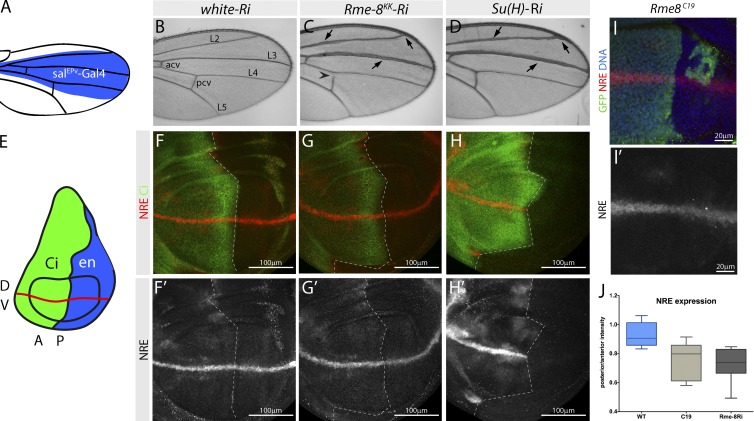
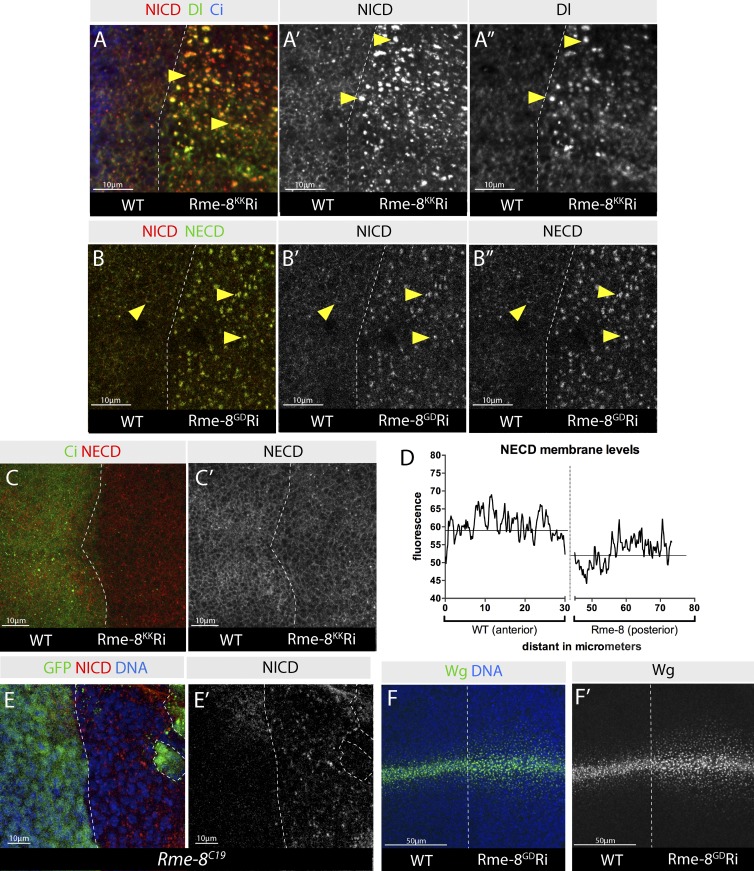
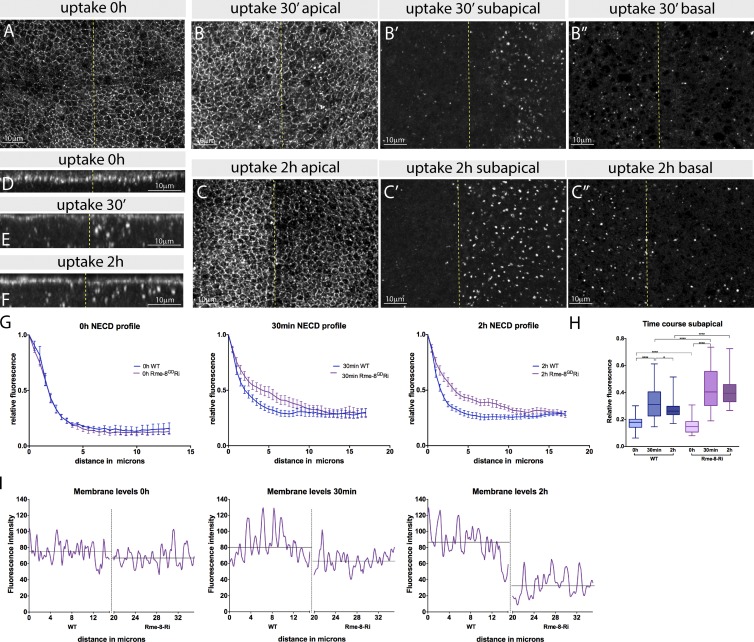
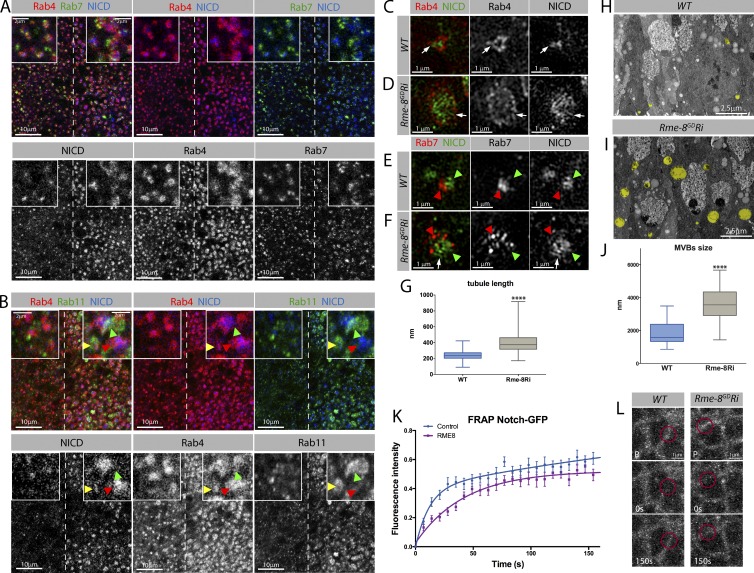
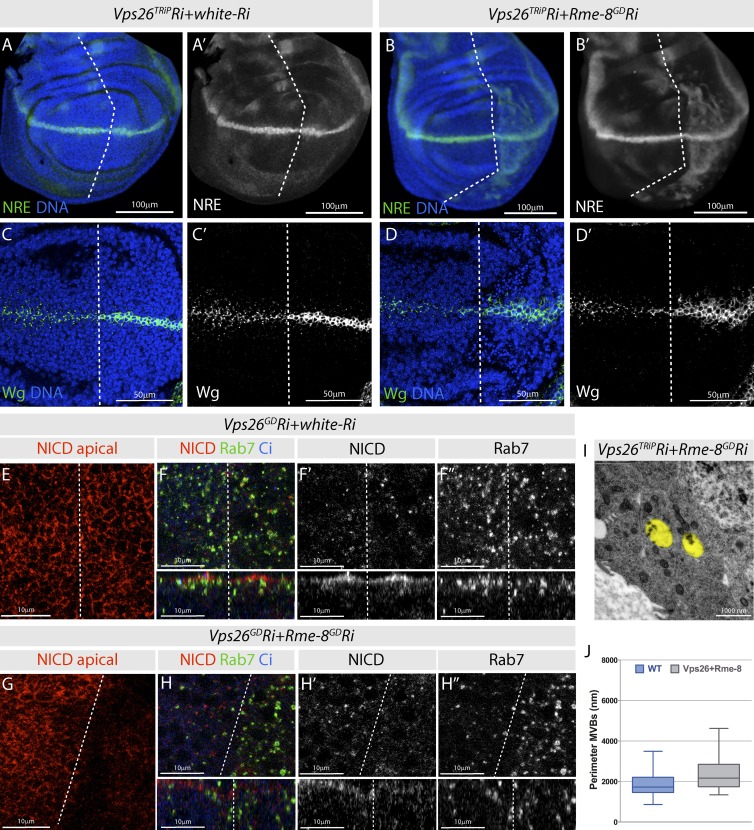
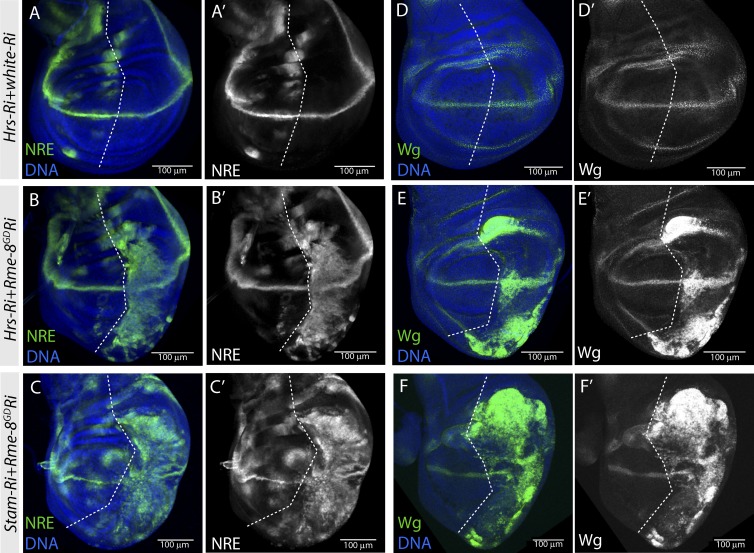
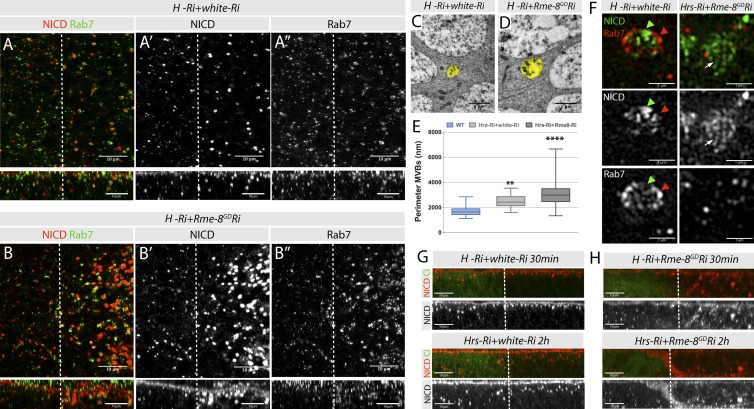
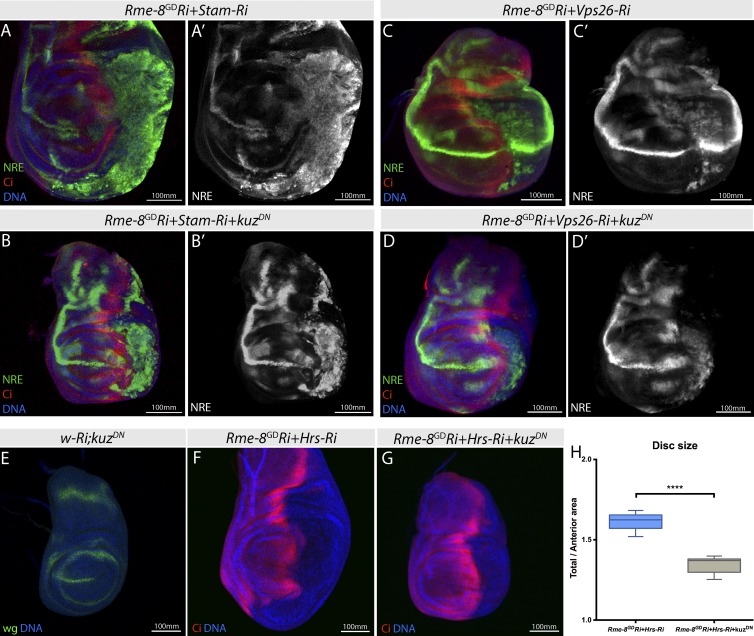
Notch signaling is a major regulator of cell fate, proliferation, and differentiation. Like other signaling pathways, its activity is strongly influenced by intracellular trafficking. Besides contributing to signal activation and down-regulation, differential fluxes between trafficking routes can cause aberrant Notch pathway activation. Investigating the function of the retromer-associated DNAJ protein Rme-8 in vivo, we demonstrate a critical role in regulating Notch receptor recycling. In the absence of Rme-8, Notch accumulated in enlarged tubulated Rab4-positive endosomes, and as a consequence, signaling was compromised. Strikingly, when the retromer component Vps26 was depleted at the same time, Notch no longer accumulated and instead was ectopically activated. Likewise, depletion of ESCRT-0 components Hrs or Stam in combination with Rme-8 also led to high levels of ectopic Notch activity. Together, these results highlight the importance of Rme-8 in coordinating normal endocytic recycling route and reveal that its absence predisposes toward conditions in which pathological Notch signaling can occur.


Figures

Figure 1.
Figure 1.
Rme8 regulates Notch pathway function. (A) salPEv-Gal4 expression domain in an adult wing. (B–D) Adult wing from flies expressing w (B), Rme-8 (C), or Su(H) (D) Ri with salPEv-Gal4. Rme-8 knockdown results in vein thickening and small Dl’s, similar to Su(H)-Ri treatment (arrows). Also note loss of posterior cross-vein (arrowhead; Pcv). L2–5 veins; Acv, anterior cross-vein. (E) en-Gal4 expression domain in the posterior (P, blue) wing disc, as used in this and all subsequent knockdown experiments (F–H′) NRE-mCherry expression in wing discs from flies expressing w (F), Rme-8 (G), or Su(H) (H) Ri (right of dashed line). Rme-8-Ri slightly reduced NRE expression, Su(H)-Ri causes loss of NRE expression. Cubitus interruptus (Ci) marks the unaffected anterior (A) compartment in this and all subsequent experiments. (I and I′) NRE-mCherry expression is decreased in Rme-8 (Rme-8c19) mutant cells (GFP negative). Mutant clones were generated using FRT42D PCNA, Ubi-GFP; hh-flp. (J) Box plot of anterior/posterior pixel intensity ratio, measured in comparable posterior and anterior regions of control, RmeC19 mutant (C19; n = 7), and Rme-8 knockdown (Rme-8Ri, n = 12) discs. Boxes indicate 25th to 75th percentiles, whiskers represent maximum and minimum values in the dataset, and lines show the median values.
Figure 2.
Figure 2.
Aberrant trafficking of Notch, Dl, and Wg in Rme-8–depleted cells. (A–B″) Effects of Rme-8 Ri on Notch (anti-NICD, red in A and B; anti-NECD, green in B) and Dl (green in A) trafficking. Both, full-length Notch and Dl accumulate together inside Rme-8-Ri cells (arrowheads). Depleted territory in this and subsequent figures is on the right side of dashed line, unless stated otherwise. (C and C′) NECD (staining without detergent) is depleted from the membrane when Rme-8 is knocked down (Rme-8KK). (D) Quantification of surface NECD levels from C. The data shown are from a single representative disc; n = 6 for the experiment shown; the experiment was repeated three times with similar results. Line shows mean fluorescence at the membrane level within the specified compartment. (E and E′) Intracellular Notch puncta accumulate in Rme-8C19 mutant cells (GFP negative, marked by dashed line; generated as in Fig 1 I). (F and F′) Wg is detected more broadly in the Rme-8-Ri tissue.
Figure 3.
Figure 3.
Notch accumulates in subapical puncta in Rme-8–depleted cells. (A–C″) Antibody uptake assay to detect Notch trafficking (anti-NECD) in cultured wing discs. Different focal planes (apical [A, B, and C]; subapical [B′ and C′]; basal [B″ and C″]) from xy sections at 0 min (A), 30 min (B), or 2 h (C) after uptake. (D–F) xz cross sections of discs in A, B, and C, respectively. Notch–antibody complexes accumulate subapically in Rme-8-Ri (right) after 30 min but accumulate more basally in WT (left). (G) Quantification of fluorescence levels from Notch–antibody complexes according to distance from apical membrane in xz cross sections (apical levels were normalized to 1 for comparisons between samples). At 30 min and 2 h, more anti-NECD is detected in subapical regions with Rme-8-Ri compared with WT. Error bars represent the SEM. (H) Comparison between subapical levels of anti-NECD detected at different time points in wild-type (WT) and Rme-8 Ri tissue. Boxes indicate 25th to 75th percentiles, whiskers represent maximum and minimum values in the dataset, and lines show the median values. Asterisks indicate significance according to a one-way analysis of variance test; *, P = 0.05–0.01; ****, P < 0.0001. (I) Quantification of apical membrane anti-NECD in anterior (left, WT) versus posterior (right, Rme-8 Ri) of discs in A–C. The data shown are from a single representative disc; n = 10 for the experiment shown; the experiment was repeated two times with similar results. Lines show mean fluorescence at the membrane level within the specified compartment.
Figure 4.
Figure 4.
Notch associates with enlarged endosomes and recovers more slowly at the membrane in Rme-8–depleted cells. (A) Enlarged puncta containing NICD, Rab4, and Rab7 are detected in Rme8-Ri, where NICD accumulates in proximity to Rab4 (see insets). (B) Enlarged puncta containing NICD, Rab4, and Rab11 were detected in Rme-8-Ri cells. Some puncta contain all three proteins (insets, yellow arrowheads), others contain Rab11 only (insets, green arrowheads) or Rab4+NICD (insets, red arrowheads). (C–F) Superresolution images of endosomes from WT (C and E) or Rme-8-Ri (D and F) wing disc cells stained for NICD and Rab4 (C and D) or Rab7 (E and F). Notch localizes adjacent to Rab4 in protrusions (arrows, C). In Rme-8–depleted cells, tubule-like protrusions appear more extensive (arrows, D). Rab7 labels a compartment adjacent to NICD accumulations, both in WT and Rme-8-Ri cells (arrowheads, E and F). (G) Measurements of protruding Rab4-labeled tubule-like structures on endosomes from WT and Rme-8 knockdown (≥50 tubules/disc; 5 discs per genotype). Asterisks indicate significance according to Mann–Whitney test: ****, P < 0.0001. (H and I) Sections from WT (H) or Rme-8-Ri (I) regions of a wing disc analyzed by TEM, with endosomes highlighted in yellow. (J) Quantification of endosome perimeters from TEM images. (WT n = 28; Rme-8-i+w-Ri n = 76.) Asterisks indicate significance according to t test; ****, P < 0.0001. (K and L) FRAP experiments, measuring recovery of Notch-GFP after photobleaching. (K) Plot of averaged recovery curves (mean ± SEM) with best-fit curves as solid lines. Boxes indicate 25th to 75th percentiles, whiskers represent maximum and minimum values in the dataset, and lines show the median values. (L) Single FRAP examples with red circles showing bleach spots. (P, prebleach). The recovery curves could be described by a biexponential equation (WT, P < 0.0001; Rme-8, P = 0.02; Bulgakova et al., 2013; see Materials and methods) suggestive of two recovery processes, fast diffusion within the membrane and slower endocytic trafficking. Both appear affected by Rme-8 depletion.
Figure 5.
Figure 5.
Combined depletion of Rme-8 with Vps-26 results in ectopic Notch activation. (A–B′) NRE-mCherry is ectopically expressed in Vps26-Ri;Rme8-Ri (B) compared with Vps26-Ri;w-Ri (A). (C–D′) Wg accumulates inside both producing and receiving cells in Vps26-Ri;Rme8-Ri (D) but only in producing cells in Vps26-Ri;w-Ri (C). (E–H″) NICD and Rab7 distribution in Vps26-Ri;w-Ri (E and F) or Vps26-Ri;Rme-8-Ri (G and H) wing discs. Apical (E and G) and subapical focal planes (F and H) with xz cross sections from discs in F and H beneath. (I and J) TEM images of Vps26-Ri;Rme8-Ri (I) with endosomes colored in yellow, and quantification of endosomal perimeter from TEM images (J; WT n = 83; Vps26-Ri+Rme-8-Ri n = 30). Boxes indicate 25th to 75th percentiles, whiskers represent maximum and minimum values in the dataset, and lines show the median values.
Figure 6.
Figure 6.
Combined depletion of Rme-8 with ESCRT-0 results in ectopic Notch activation and tissue overgrowth. (A–F′) NRE-GFP (A–C) and Wg (D–F) expression are strongly up-regulated in Hrs+Rme-8 double knockdown (B and E) and Stam+Rme8 double knockdown (C and F), in contrast to the Hrs single knockdown where expression is unaffected (A and D, Hrs-Ri;w-Ri).
Figure 7.
Figure 7.
Effects on Notch trafficking of combined Rme-8 and ESCRT-0 depletion. (A–B″) Distribution of NICD and Rab7. xy section of discs at the subapical plane (top) and xz cross sections of the same specimens (bottom). Notch accumulates in enlarged Rab7 structures upon Hrs knockdown (A; Hrs-Ri+w-Ri) but not in double knockdown (B; Hrs-Ri+Rme8-Ri). (C and D) TEM images of Hrs-Ri;w-Ri (C) or Hrs-Ri;Rme8-Ri (D) with endosomes colored in yellow. (E) Quantification of endosome perimeters from TEM images (WT n = 83, Hrs-Ri+w-Ri n = 33, and Hrs-Ri+Rme-8Ri n = 42). Boxes indicate 25th to 75th percentiles, whiskers represent maximum and minimum values in the dataset, and lines show the median values. Asterisks indicate significance according to one-way analysis of variance test; **, P = 0.01–0.001; ****, P < 0.0001. (F) Superresolution images of single endosomes from Hrs-Ri;w-Ri (left)– or Hrs-Ri;Rme8-Ri (right)–expressing discs, stained for NICD and Rab7, which appear to localize in the same vesicular compartment in Hrs knockdown (arrowheads, left), but not in the Rme-8-Hrs double knockdown, where Notchlocalizes in long tubules (arrows, right). (G and H) Antibody uptake assay for Notch in cultured wing imaginal discs expressing Hrs-Ri;w-Ri (G) or Hrs-Ri;Rme8-Ri (H).
Figure 8.
Figure 8.
Ectopic Notch activation observed in combined depletions is not prevented by KuzDN. (A–D′) NRE-GFP expression shows that ectopic Notch activation in StamRi+Rme-8-Ri (A) or Vps26-Ri+Rme-8-Ri (C) is not rescued by kuzDN coexpression (B and D). (E) Wg D/V expression is lost in discs expressing kuzDN alone. (F and G) kuzDN coexpression rescues overgrowth caused by Hrs-Ri+Rme-8-Ri. (H) Quantification of wing disc size for genotypes shown in F and G. Boxes indicate 25th to 75th percentiles, whiskers represent maximum and minimum values in the dataset, and lines show the median values. Asterisks indicate significance according to t test; ****, P < 0.0001.

References

    1. Aldaz S., Escudero L.M., and Freeman M.. 2010. Live imaging of Drosophila imaginal disc development. Proc. Natl. Acad. Sci. USA. 107:14217–14222. 10.1073/pnas.1008623107 - DOI - PMC - PubMed
    1. Baron M. 2012. Endocytic routes to Notch activation. Semin. Cell Dev. Biol. 23:437–442. 10.1016/j.semcdb.2012.01.008 - DOI - PubMed
    1. Belenkaya T.Y., Wu Y., Tang X., Zhou B., Cheng L., Sharma Y.V., Yan D., Selva E.M., and Lin X.. 2008. The retromer complex influences Wnt secretion by recycling wntless from endosomes to the trans-Golgi network. Dev. Cell. 14:120–131. 10.1016/j.devcel.2007.12.003 - DOI - PubMed
    1. Bray S.J. 2006. Notch signalling: a simple pathway becomes complex. Nat. Rev. Mol. Cell Biol. 7:678–689. 10.1038/nrm2009 - DOI - PubMed
    1. Brou C. 2009. Intracellular trafficking of Notch receptors and ligands. Exp. Cell Res. 315:1549–1555. 10.1016/j.yexcr.2008.09.010 - DOI - PubMed

Publication types

MeSH terms