Review
. 2015 Nov;12(11):664-75.
doi: 10.1038/nrclinonc.2015.108. Epub 2015 Jul 14.

Lung cancer-a fractal viewpoint

Affiliations
Review

Lung cancer-a fractal viewpoint

Frances E Lennon et al. Nat Rev Clin Oncol. 2015 Nov.

Abstract

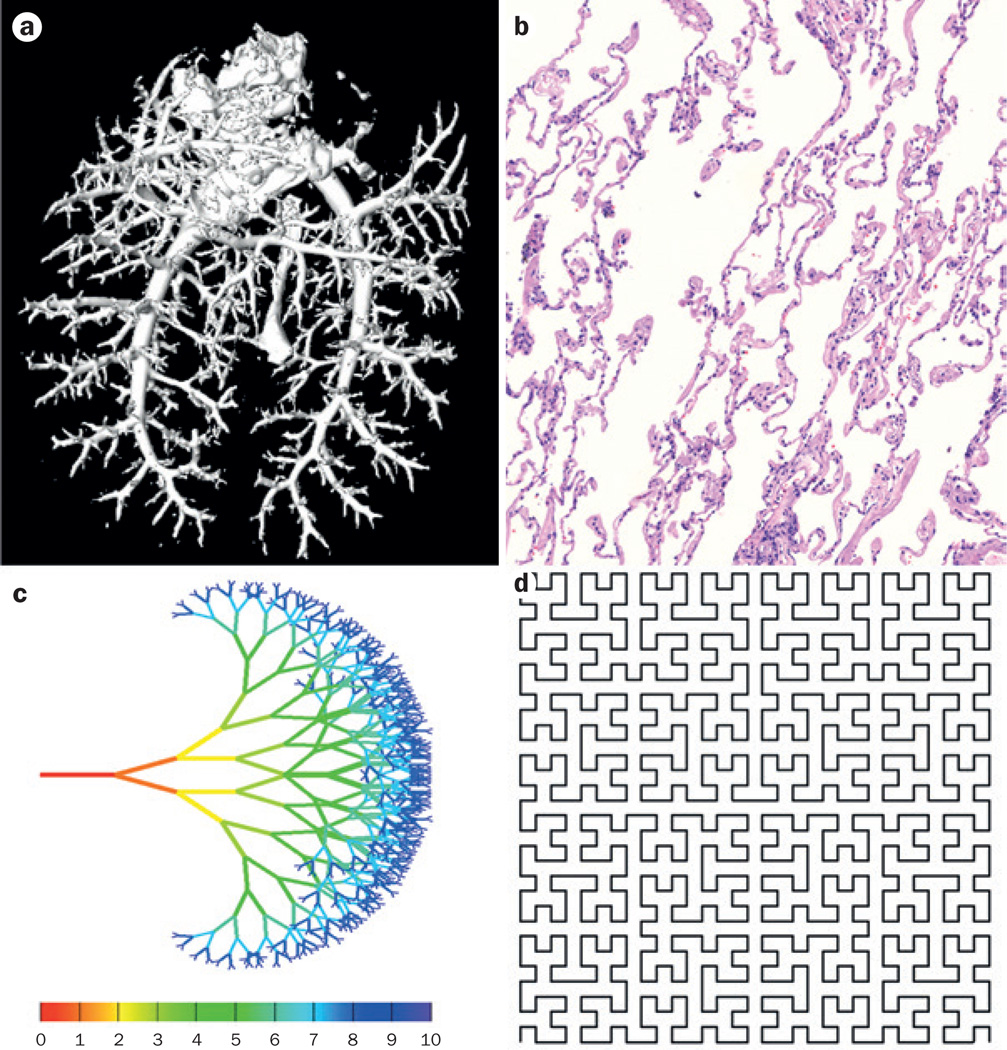
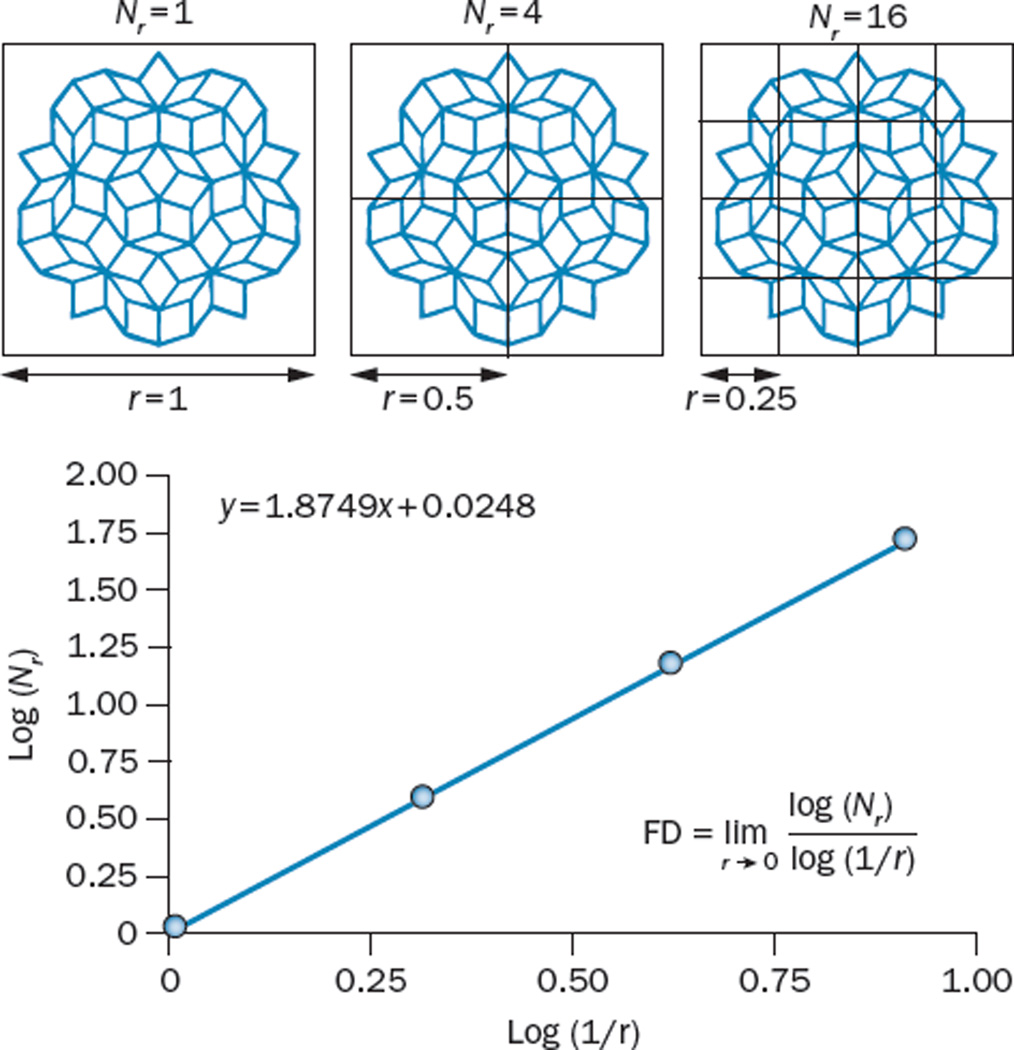
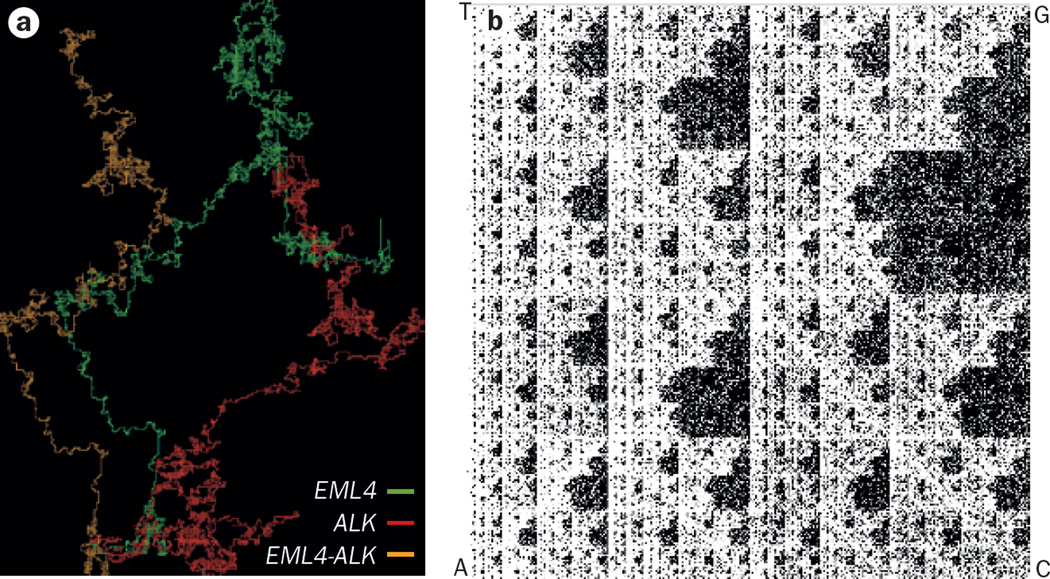
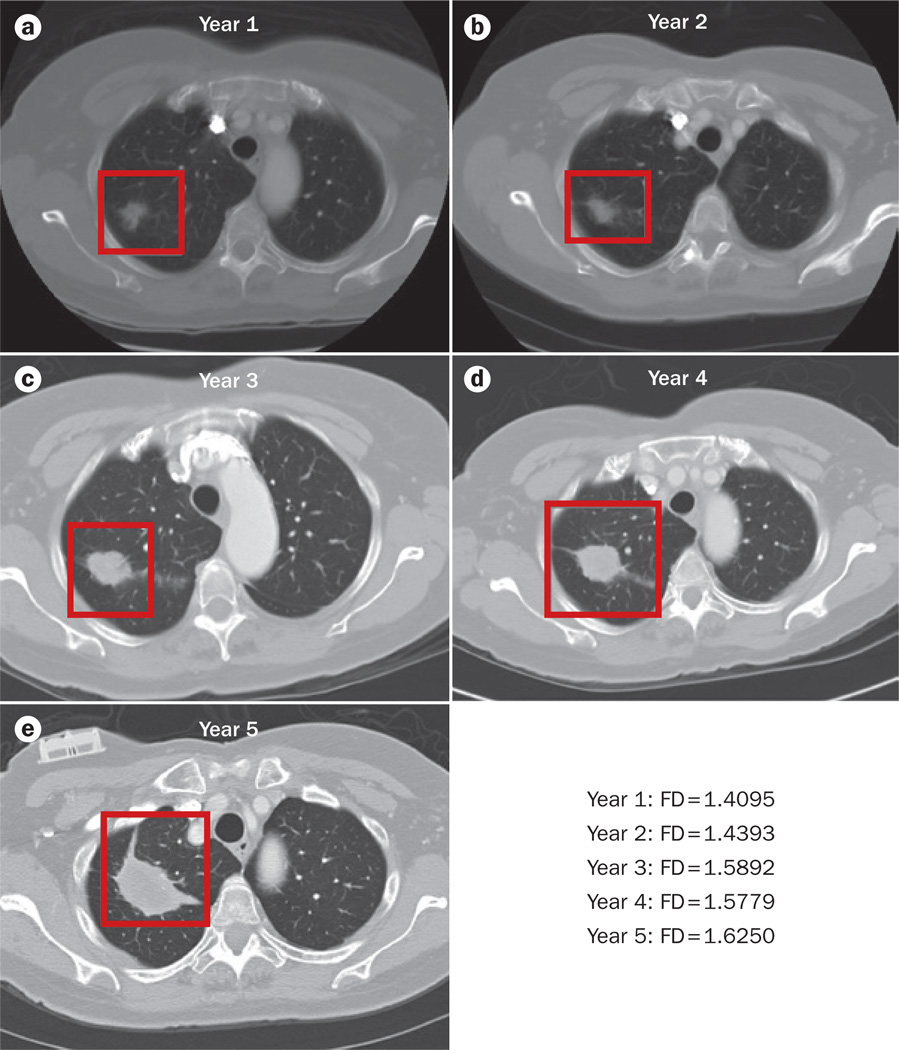
Fractals are mathematical constructs that show self-similarity over a range of scales and non-integer (fractal) dimensions. Owing to these properties, fractal geometry can be used to efficiently estimate the geometrical complexity, and the irregularity of shapes and patterns observed in lung tumour growth (over space or time), whereas the use of traditional Euclidean geometry in such calculations is more challenging. The application of fractal analysis in biomedical imaging and time series has shown considerable promise for measuring processes as varied as heart and respiratory rates, neuronal cell characterization, and vascular development. Despite the advantages of fractal mathematics and numerous studies demonstrating its applicability to lung cancer research, many researchers and clinicians remain unaware of its potential. Therefore, this Review aims to introduce the fundamental basis of fractals and to illustrate how analysis of fractal dimension (FD) and associated measurements, such as lacunarity (texture) can be performed. We describe the fractal nature of the lung and explain why this organ is particularly suited to fractal analysis. Studies that have used fractal analyses to quantify changes in nuclear and chromatin FD in primary and metastatic tumour cells, and clinical imaging studies that correlated changes in the FD of tumours on CT and/or PET images with tumour growth and treatment responses are reviewed. Moreover, the potential use of these techniques in the diagnosis and therapeutic management of lung cancer are discussed.


Figures

Figure 1
Figure 1
Examples of biological and mathematical fractal patterns. Biological fractals may be statistically self-similar over a limited range of scales, known as a scaling window. a | Rat pulmonary arterial vasculature, imaged via contrast-enhanced CT angiography, which is an example of a biological fractal. b | Normal lung tissue specimen stained with haematoxylin and eosin, which also has fractal properties, and thus is amenable to fractal-dimension analysis. In comparison with biological fractals, mathematical fractals can be infinitely self-similar, examples are fractal trees and the Hilbert curve. c | A fractal tree, showing the first 10 iterations of symmetrical branching. d | The Hilbert curve, a continuous space filling fractal curve with a fractal dimension of 2—a non-fractal curve has a dimension of 1. The first 5 iterations of the Hilbert curve are shown here.
Figure 2
Figure 2
The box-counting method of calculating FD. Box counting is among the most commonly used methods to calculate the FD of shapes, such as the one presented in this figure. Firstly, the number of boxes (Nr), each of different side lengths (r), that are needed to cover the shape is counted. In this example, for a box size of r = 1, one box is sufficient to cover the shape. For r = ½, four boxes are required, and for r = ¼, 16 boxes are needed; 48 boxes would be sufficient if r = ⅛ (not shown). In practice this procedure is repeated for several values of r. Next, log(Nr) is plotted against log(1/r) and fitted to a straight line. The slope of the fit gives an estimated measure of FD. In this instance, this calculation returns an FD of 1.874. Abbreviation: FD, fractal dimension.
Figure 3
Figure 3
Lacunarity. Lacunarity is a measure of the texture or distribution of gaps within an image. It can be helpful to think of lacunarity as an indicator of rotational invariance. The images on the right are 90° rotations of the images on the left. a | This image has a low lacunarity (Λ = 0.343), and is relatively unaffected by rotation—the rotated image appears the same as the original. b | The image in the middle row has a higher lacunarity than the image in the top row (Λ = 0.520), and is more affected by rotation owing to greater heterogeneity in the image. Thus, the rotated image appears slightly different to the original image. c | The image in the lower row has the highest lacunarity (Λ = 0.644)—it is most affected by rotation and has the highest heterogeneity. In this case the rotated image appears very different to the original image.
Figure 4
Figure 4
Fractal analysis of DNA sequences. Nucleotide sequences of DNA exhibit fractal properties including self-similarity, which can be illustrated in silico using DNA walks or chaos games. In the DNA walk approach, the nucleotide sequence is represented vectorially, with the two pairs of complementary DNA nucleotide pairs (A–T and G–C) translated into a 2D trajectory, starting at the origin and moving progressively in directions dictated by the sequence of nucleotides in the gene—up one unit for ‘A’, down one unit for ‘T’, right for ‘G’, and left for ‘C’. a | Image illustrating the DNA walks of the EML4 (green), ALK (red) genes, and EML4–ALK fusion gene (orange), revealing differences in the fractal properties of each of these DNA sequences. b | Chaos game representation of chromosome 2. In the chaos game representation each corner of a square is assigned a DNA base (either A, C, G, or T). Starting at the centre of the square, we moved half the distance towards the corner corresponding to the first base in the DNA sequence and plotted this point, and then moved half the distance from that point towards the corner corresponding to the second base, again plotting a point at the location arrived at. This process was repeated for each base in the DNA sequence of chromosome 2. The resulting pattern is a fractal. Supplementary Video 2 shows how the fractal pattern of the DNA chaos game repeats as we zoom in on the image, illustrating a defining feature of a fractal: self-similarity over a range of scales.
Figure 5
Figure 5
Fractal analysis of lung cancer histology. Representative haematoxylin and eosin stained tissue slides for normal lung and four common lung cancer histologies (adenocarcinoma, large-cell carcinoma, small-cell carcinoma and a lepidic-type adenocarcinoma; n = 1 for each histological subtype) were scanned and the images were then converted to 8-bit greyscale using ImageJ. The box-counting FD (DB) and lacunarity (Λ) of specimens of normal lung tissue and four different histological variants of lung tumours were calculated using FracLac. See Supplementary Figure 1 of a pictorial representation of the methodological approach. Six regions of each specimen were selected at random and analysed; images a–e are representative of the regions analysed for each subtype. The DB and Λ for each individual region were as follows: a | normal lung: DB = 1.7117; Λ = 0.0299. b | Adenocarcinoma: DB = 1.7435; Λ = 0.0083. c | Lepidic-type adenocarcinoma: DB = 1.7715; Λ = 0.0042. d | Large-cell carcinoma: DB = 1.7488; Λ = 0.0051. e | Small-cell lung cancer: DB= 1.7615; Λ= 0.0045. In each image, the scale bar depicts 500 µm). f | Plot of individual values of FD (DB) against lacunarity (Λ) for each region sampled (n = 6 for each histological subtype). As FD is not a unique identifier (different shapes can have similar FD), lacunarity can be used to help differentiate these shapes. Abbreviation: FD, fractal dimension.
Figure 6
Figure 6
Lung cancer progression and fractal dimension. Sequential CT images of a patient diagnosed with stage I adenocarcinoma of the lung who declined treatment and showed progressive tumour growth over 5 years were subjected to fractal analysis; contrast-enhanced CT scans were obtained at yearly intervals over this 5-year period (parts a–e). These images were loaded in Image J (Version 1.49), converted to 8-bit, and binarized; the background was set to white. The region of interest containing the tumour was defined manually. The FD of the tumour outline was then determined using the ImageJ plugin FracLac (Version 2015Febb4135). Using the batch-processing mode of this software, we applied the box-counting method to the binary images at 12 different grid positions. The box sizes within the grids used ranged from a minimum of 2 × 2 pixels and increased until they reached a maximum size of 45% of the selected image area. The estimated FD was calculated for each grid position from the regression line of a log–log plot of intensity versus box size—the FD given is the average of these estimated FDs. See Supplementary Figure 2 for a pictorial representation of the methodology used. The data derived from these calculations showed that the FD of the tumour–stroma interface increased from a | 1.4095 in year 1 to e | 1.6250 in year 5. This might indicate increased invasion of the tumour into the surrounding stroma. Abbreviation: FD, fractal dimension.
Figure 7
Figure 7
Treatment response and FD. CT images of a patient diagnosed with ALK-positive stage IV adenocarcinoma of the lung who responded to an ALK-targeted therapy were analysed to assess changes in FD of the lungs. The FDs of the tumour area in the right lung (red outline) and an area corresponding to the unaffected left lung (yellow outline) were calculated using a | pretreatment and b | post-treatment CT images. The ROI containing the tumour (or the unaffected lung) was defined manually. The ImageJ plugin FracLac (Version 2015Febb4135), was used to perform box-counting greyscale differential FD analysis on the ROI, using 12 different grid positions with box sizes ranging from a minimum of 2 × 2 pixels and increased until they reached a maximum size of 45% of the ROI. A box-counting greyscale differential analysis returns an intensity FD based on the difference in pixel intensity in each box. The FD is the average of the estimated FD calculated for each grid position from the regression line of a log–log plot of box number versus box size. The FD of the pretreatment tumour area was 1.1237 and decreased by 0.064 to 1.0597 in the post-treatment image. By contrast, the FD of the unaffected lung showed only a relatively minor change in FD from 1.0556 before treatment to 1.0396 post-treatment—a change of 0.016. Abbreviations: FD, fractal dimension; ROI, region of interest.

Similar articles

Cited by

References

    1. American Cancer Society. Cancer Facts and Figures 2015. 2015 [online], http://www.cancer.org/acs/groups/content/@editorial/documents/document/a....
    1. Siegel R, Ma J, Zou Z, Jemal A. Cancer statistics, 2014. CA Cancer J. Clin. 2014;64:9–29. - PubMed
    1. Mozley PD, et al. Change in lung tumor volume as a biomarker of treatment response: a critical review of the evidence. Ann. Oncol. 2010;21:1751–1755. - PubMed
    1. Mandelbrot BB. The Fractal Geometry of Nature. W. H. Freeman & Co. Ltd; 1982.
    1. Peitgen H-O, Jürgens H, Saupe D. Chaos and fractals: New Frontiers of Science. 2nd. Springer-Verlag; 2004.

Publication types