. 2015 Oct;1852(10 Pt A):2056-65.
doi: 10.1016/j.bbadis.2015.07.009. Epub 2015 Jul 11.

Adaptive changes in amino acid metabolism permit normal longevity in mice consuming a low-carbohydrate ketogenic diet

Affiliations

Adaptive changes in amino acid metabolism permit normal longevity in mice consuming a low-carbohydrate ketogenic diet

Nicholas Douris et al. Biochim Biophys Acta. 2015 Oct.

Abstract

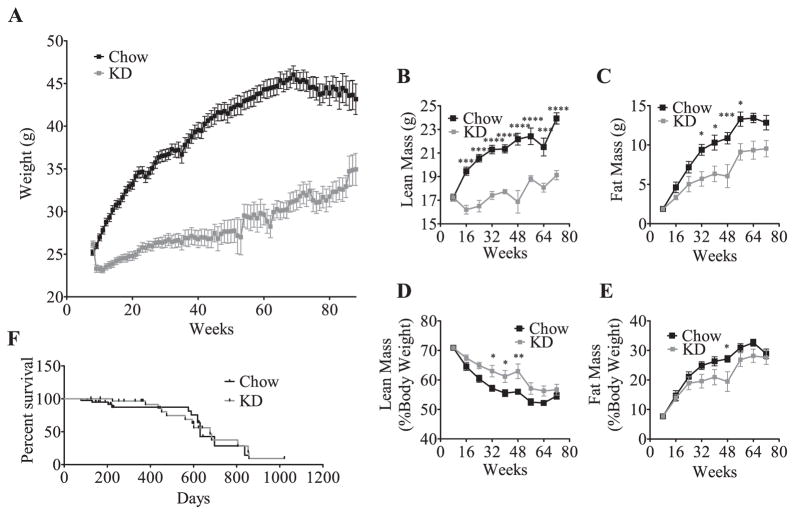
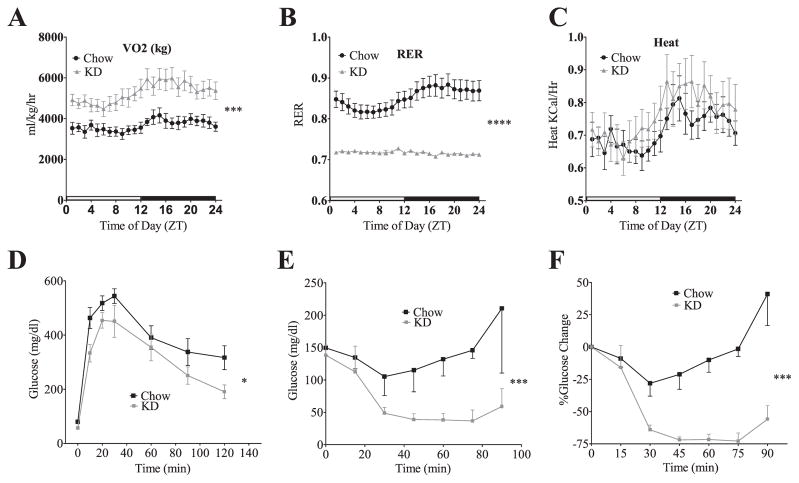
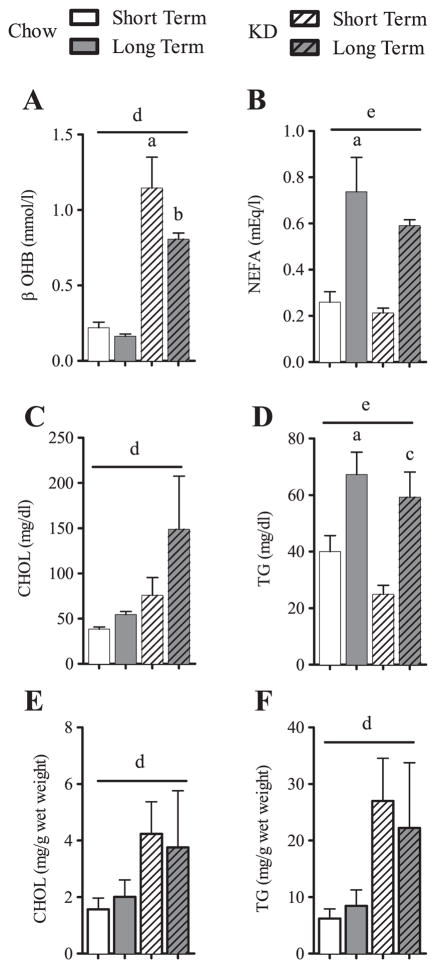
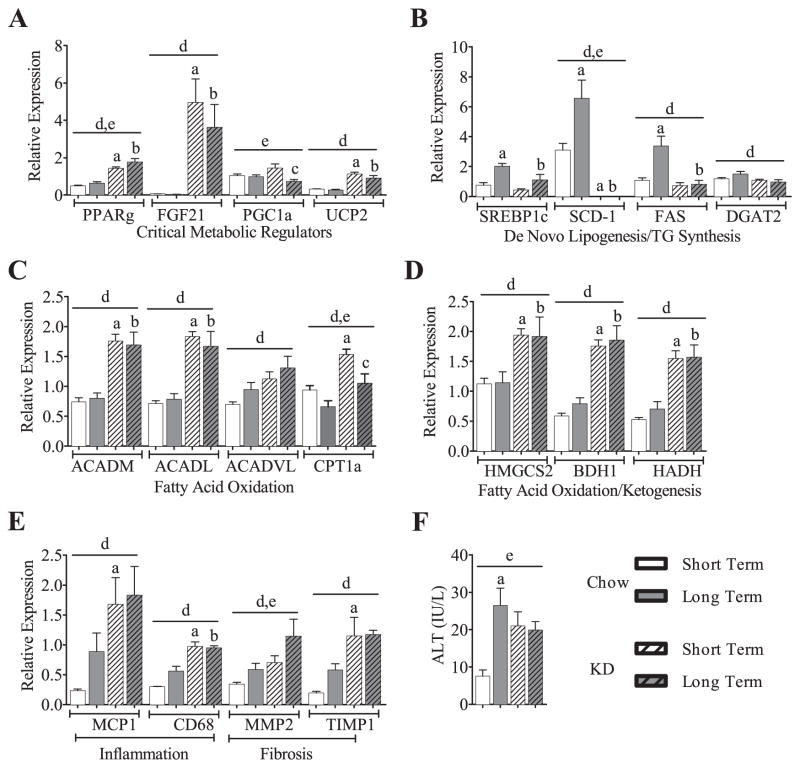
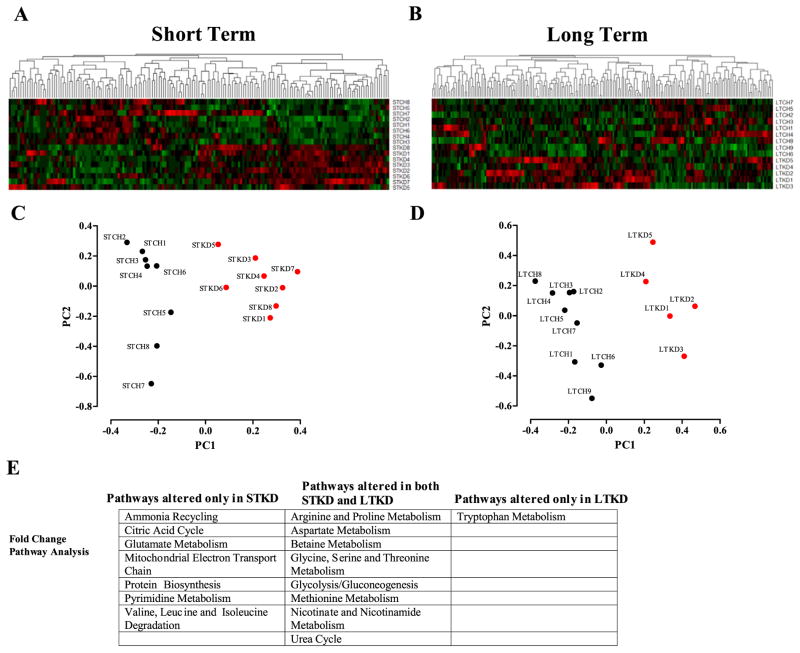
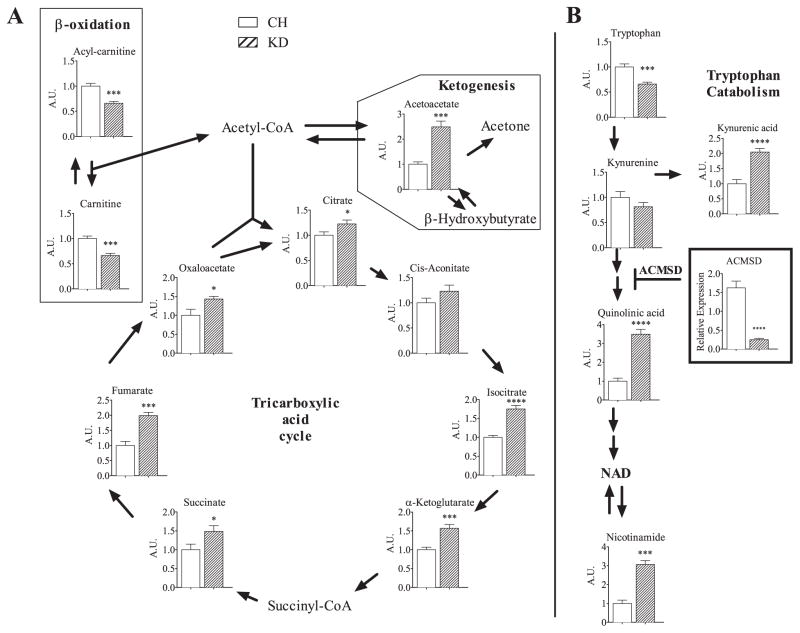
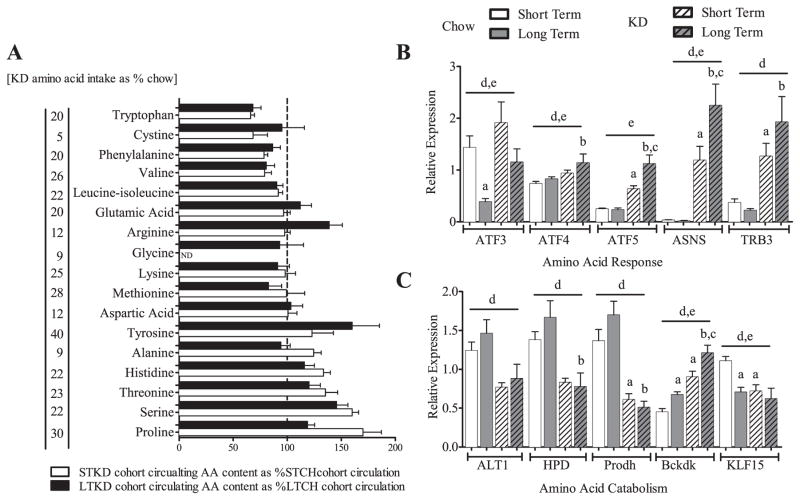
Ingestion of very low-carbohydrate ketogenic diets (KD) is associated with weight loss, lowering of glucose and insulin levels and improved systemic insulin sensitivity. However, the beneficial effects of long-term feeding have been the subject of debate. We therefore studied the effects of lifelong consumption of this diet in mice. Complete metabolic analyses were performed after 8 and 80weeks on the diet. In addition we performed a serum metabolomic analysis and examined hepatic gene expression. Lifelong consumption of KD had no effect on morbidity or mortality (KD vs. Chow, 676 vs. 630days) despite hepatic steatosis and inflammation in KD mice. The KD fed mice lost weight initially as previously reported (Kennnedy et al., 2007) and remained lighter and had less fat mass; KD consuming mice had higher levels of energy expenditure, improved glucose homeostasis and higher circulating levels of β-hydroxybutyrate and triglycerides than chow-fed controls. Hepatic expression of the critical metabolic regulators including fibroblast growth factor 21 were also higher in KD-fed mice while expression levels of lipogenic enzymes such as stearoyl-CoA desaturase-1 was reduced. Metabolomic analysis revealed compensatory changes in amino acid metabolism, primarily involving down-regulation of catabolic processes, demonstrating that mice eating KD can shift amino acid metabolism to conserve amino acid levels. Long-term KD feeding caused profound and persistent metabolic changes, the majority of which are seen as health promoting, and had no adverse effects on survival in mice.

Keywords: Free fatty acid metabolism; Hepatic steatosis; Ketogenesis; Ketogenic diet; Liver; Mass spectrometry; Metabolomics.


Figures

Fig. 1
Fig. 1
Ketogenic diet fed mice remain lighter and leaner than chow fed controls and have similar life expectancy. KD fed mice initially lose weight (A) and after a few months return to baseline, but remain lighter than chow-fed controls (effect of diet P < 0.0001). The values represent group means (±SEM, initial group size CH, n = 48; KD, n = 39). Significance in weight curve was determined with two-way ANOVA. Both lean mass (B) and fat (C) mass are reduced in KD fed mice compared to chow fed counterparts as measured by MRI, but when corrected for body mass (D & E), KD-fed mice have a greater percentage of lean mass (effect of diet P < 0.0001) and less fat mass (effect of diet P = 0.0002). The values represent group means ± SEM, CH, n = 6–13 per time point, KD, n = 8–11 per time point. Significance in body composition was determined with two-way ANOVA with Sidak’s post-hoc test for individual time point analysis, significance is designated by asterisks with *P < 0.05, **P < 0.01, ***P < 0.001, and ****P < 0.0001. Survival analysis in animals fed chow or KD demonstrating no significant alteration in morbidity or mortality in KD fed mice compared to CH fed mice (F). Comparison of survival curves was conducted with a log-rank (Mantel–Cox) test, P = 0.9092. Starting survival study contained CH n = 40, KD n = 31.
Fig. 2
Fig. 2
Mice fed KD for 60 weeks have sustained changes in metabolic rate and glucose homeostasis. KD-fed mice have a higher metabolic rate of VO2 consumption (A). The cyclic nature of the respiratory exchange rate (RER) is lost in the KD-fed mice (B) due to constant utilization of lipid as a fuel source. An indirect measure of heat (C) trends higher in the KD mice. The values for VO2 consumption, RER and heat all represent group means (±SEM, group size CH, n = 8; KD, n = 7). Mice fed KD for 60 weeks maintain glucose tolerance as measured by an IP glucose tolerance test (D). The values represent group means (±SEM, group size CH, n = 8; KD, n = 7). Mice fed KD for 60 weeks remain insulin-sensitive as shown by an ITT either by glucose level (E) or %change (F). The values represent group means (±SEM, group size CH, n = 7; KD, n = 5). Two-way Repeat Measures ANOVA for all datasets in this figure, significance is designated by asterisks with *P < 0.05, **P < 0.01, ***P < 0.001, and ****P < 0.0001.
Fig. 3
Fig. 3
Serum nutrient profiles and liver lipids for short or long-term feeding of chow and KD. Data is shown as means ± SEM and is shown for serum (A–D) or for liver (E–F). Two-way ANOVA with Sidak’s post-hoc test for individual time point analysis, significance (P < 0.05) is designated by letters: asignificantly different from STCH; bsignificantly different from LTCH; csignificantly different from STKD; dsignificant effect of diet; and esignificant effect of age. n = 4–9 per group.
Fig. 4
Fig. 4
Hepatic gene expression: during short or long-term feeding of KD, critical metabolic regulators remain elevated (A) and de novo lipogenic/triglyceride synthesis-genes remain depressed (B). With a few exceptions, expression in the liver of genes involved in fatty acid oxidation and ketogenesis elevate upon KD feeding and remain elevated long-term (C & D). KD feeding and/or aging increases gene expression markers (E) and the serum marker aminotransferase (F) of hepatic inflammation and fibrosis, but the increase is not cumulative. PPARγ, peroxisome proliferator-activated receptor gamma; FGF21, fibroblast growth factor 21; PGC1α, peroxisome proliferator-activated receptor gamma coactivator 1-alpha; UCP2, uncoupling protein 2, SCD-1, stearoyl-CoA desaturase-1; FAS, fatty acid synthase; DGAT2, diglyceride acyltransferase; SREBP1c, sterol regulatory element-binding transcription factor 1c; ACADM, acyl-Coenzyme A dehydrogenase [medium chain]; ACADL, acyl-Coenzyme A dehydrogenase [long chain]; ACADVL, acyl-Coenzyme A dehydrogenase [very long chain]; Hmgcs2, 3-hydroxy-3-methylgutaryl-CoA synthase 2 (mitochondrial); BDH1, 3-hydroxybutyrate dehydrogenase (type 1); HADH, hydroxyacyl-CoA dehydrogenase; MCP1, monocyte chemotactic protein-1; Cd68, cluster of differentiation 68; Mmp2, matrix metalloproteinase-2; TIMP1, tissue inhibitor of metalloproteinase 1. Graphs are shown means ± SEM. Two-way ANOVA utilized on all data sets, effects of duration and diet queried, post-hoc comparisons determined by Sidak’s post-hoc test for individual time point analysis, significance (P < 0.05) is designated by letters: asignificantly different from STCH; bsignificantly different from LTCH; csignificantly different from STKD; dsignificant effect of diet; and esignificant effect of age. n = 4–9 per group.
Fig. 5
Fig. 5
Heatmaps depicting hierarchical clustering of CH vs. KD metabolite composition. Unsupervised hierarchical clustering of serum metabolite profiles of STCH vs. STKD (A). Hierarchical clustering of LTCH vs. LTKD serum metabolite composition (B) (gradient of red color for metabolites for relative positive correlation and green colors for metabolites negatively correlated). Projection of individual samples onto the first two principal components segregate into their respective groups of short-term chow vs. KD (C) or long-term chow vs. KD (D). Table depicting a KEGG pathway analysis using metabolite fold change values for STCH vs. STKD and LTCH vs. LTKD (E). n = 5–9 per group.
Fig. 6
Fig. 6
Pathway depiction of metabolites altered with STCH or STKD feeding. Critical metabolic intermediates in BCAA metabolism, the citric acid cycle, ketogenesis, β-oxidation, and tryptophan catabolism pathways are shown. Chow values are normalized to “1”. The graph depicting Aminocarboxymuconate Semialdehyde Decarboxylase (ACMSD) denotes gene expression. Data is shown as means ± SEM. Asterisks designate significance by Student’s t-test. *P < 0.05, **P < 0.01, ***P < 0.001, ****P < 0.0001. n = 8 per group.
Fig. 7
Fig. 7
Low AA availability leads to a hepatic amino acid response and down-regulation of hepatic amino acid catabolism. Mice eating KD consumed 5–30%/daily of the AA of the mice on chow [levels in brackets], yet despite this low AA availability circulating levels of AA are largely maintained (A). Hepatic gene expression: Increases in amino acid response gene markers in KD-fed mice. ATF3, ATF4, ATF5, activating transcription factor 3,4,5, ASNS, asparagine synthetase (glutamine-hydrolyzing), TRB3, tribbles homolog 3 (B). Hepatic amino acid catabolism genes are decreased in KD samples suggesting protection of amino acid content. ALT1, glutamic-pyruvate transaminase (alanine aminotransferase); HPD, 4-hydroxyphenylpyruvate dioxygenase; Prodh, proline dehydrogenase (oxidase) 1; Bckdk, branched chain ketoacid dehydrogenase kinase; KLF15, Krüppel-like factor 15 (C). Data is shown as means ± SEM. Two-way ANOVA utilized on hepatic gene expression, effects of duration and diet queried, post-hoc comparisons determined by Sidak’s post-hoc test for individual time point analysis, significance (P < 0.05) is designated by letters: asignificantly different from STCH; bsignificantly different from LTCH; csignificantly different from STKD; dsignificant effect of diet; and esignificant effect of age. ND = none detected. Gene expression: n = 5–9 per group.

References

    1. Kennedy AR, Pissios P, Otu H, Roberson R, Xue B, Asakura K, Furukawa N, Marino FE, Liu FF, Kahn BB, Libermann TA, Maratos-Flier E. A high-fat, ketogenic diet induces a unique metabolic state in mice. Am J Physiol Endocrinol Metab. 2007;292:E1724–E1739. - PubMed
    1. Paoli A, Grimaldi K, D’Agostino D, Cenci L, Moro T, Bianco A, Palma A. Ketogenic diet does not affect strength performance in elite artistic gymnasts. J Int Soc Sports Nutr. 2011;9:34. - PMC - PubMed
    1. Volek J, Sharman M, Gómez A, Judelson DA, Rubin M, Watson G, Sokmen B, Silvestre R, French D, Kraemer W. Comparison of energy-restricted very low-carbohydrate and low-fat diets on weight loss and body composition in overweight men and women. Nutr Metab. 2004;1:13. - PMC - PubMed
    1. Neal EG, Chaffe H, Schwartz RH, Lawson MS, Edwards N, Fitzsimmons G, Whitney A, Cross JH. The ketogenic diet for the treatment of childhood epilepsy: a randomised controlled trial. Lancet Neurol. 2008;7:500–506. - PubMed
    1. Keene DL. A systematic review of the use of the ketogenic diet in childhood epilepsy. Pediatr Neurol. 2006;35:1–5. - PubMed