. 2015 Aug;146(2):147-59.
doi: 10.1085/jgp.201511386. Epub 2015 Jul 13.

Proton block of proton-activated TRPV1 current

Affiliations

Proton block of proton-activated TRPV1 current

Bo Hyun Lee et al. J Gen Physiol. 2015 Aug.

Abstract

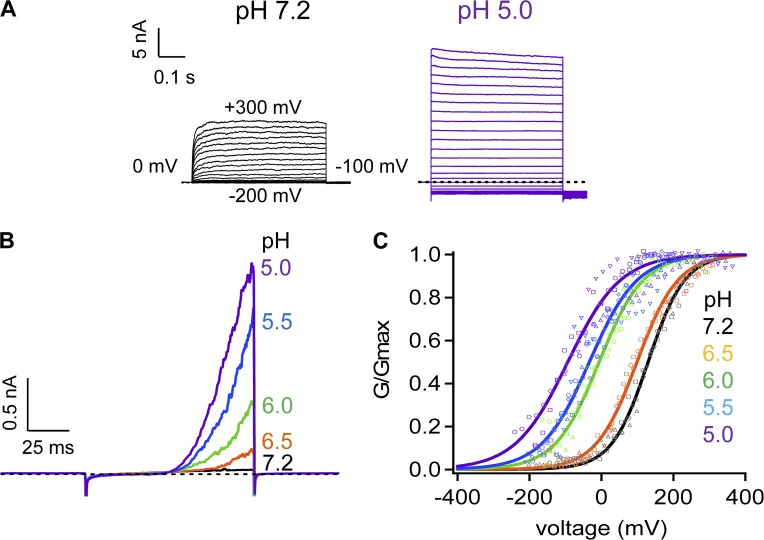
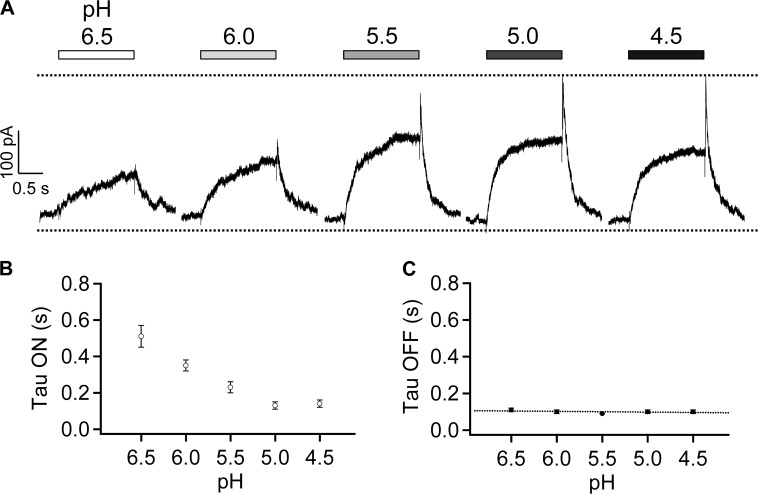
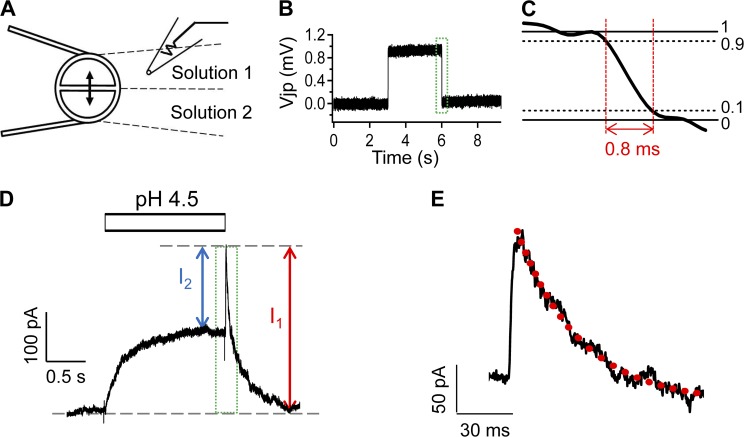
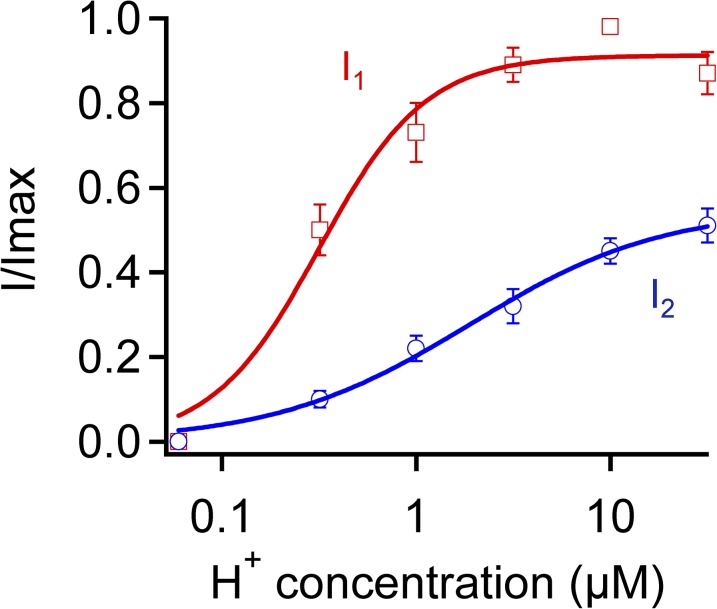
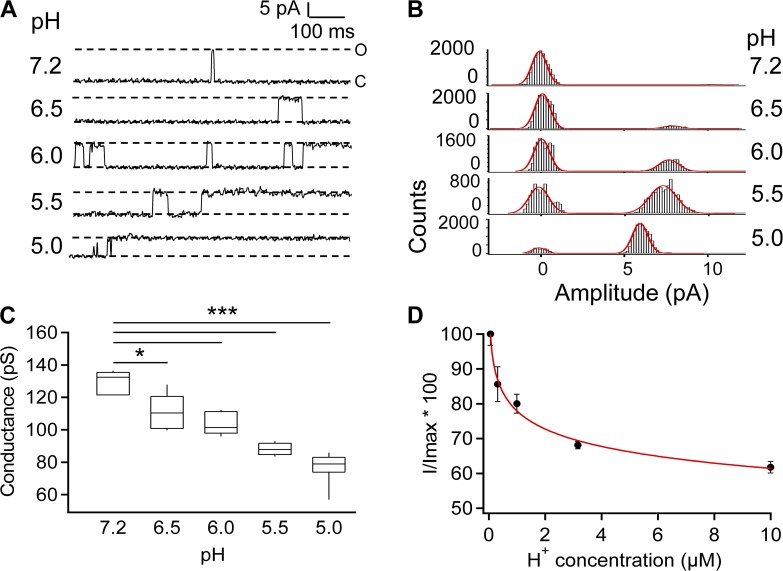
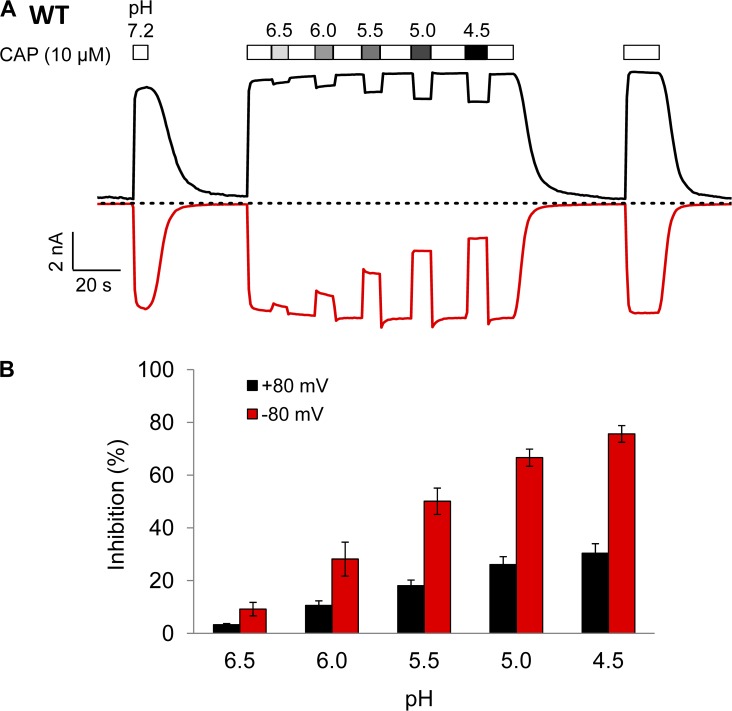
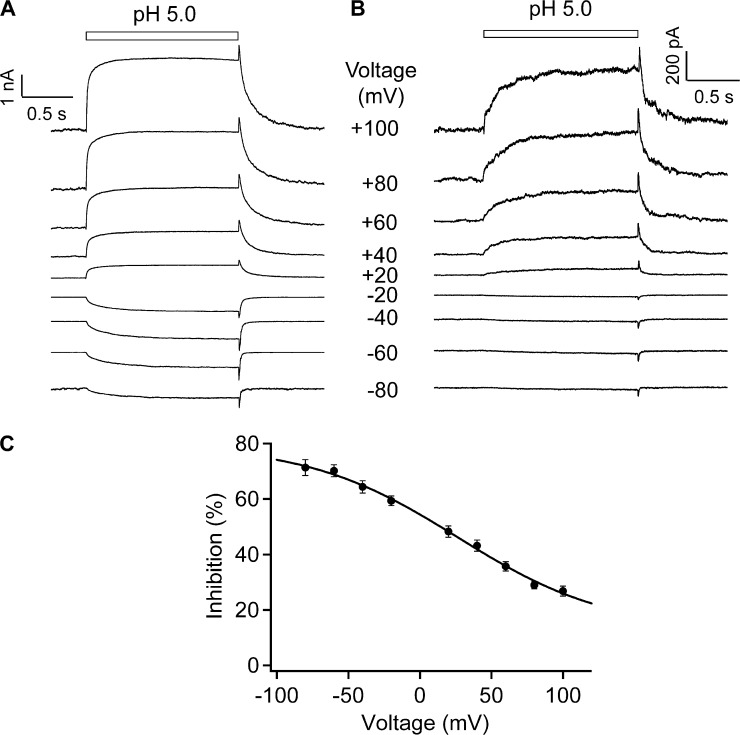
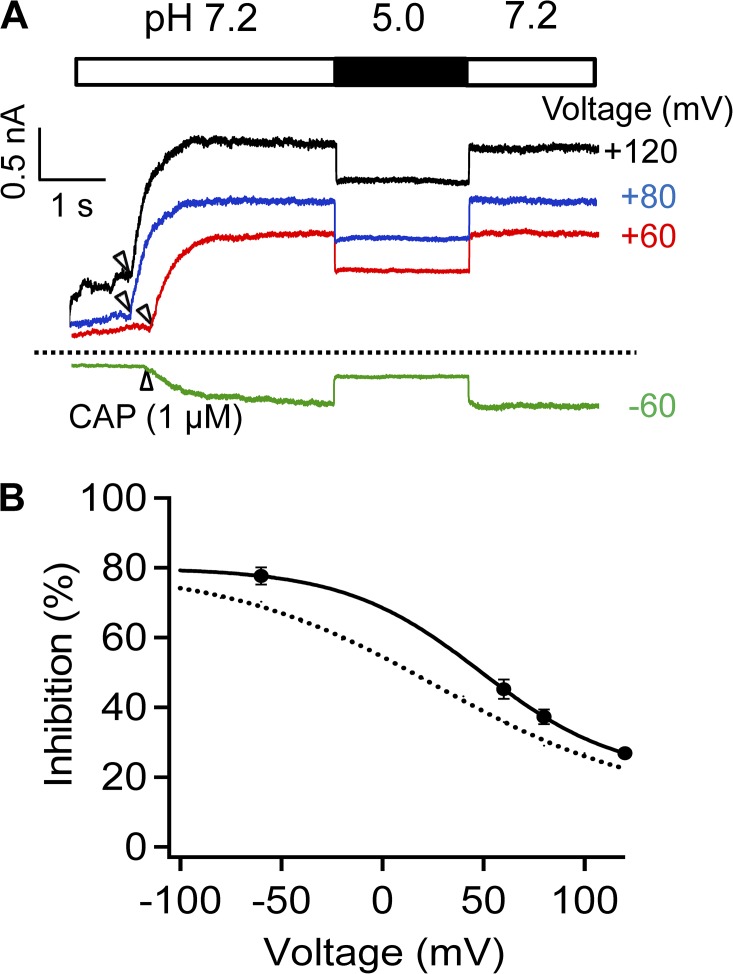
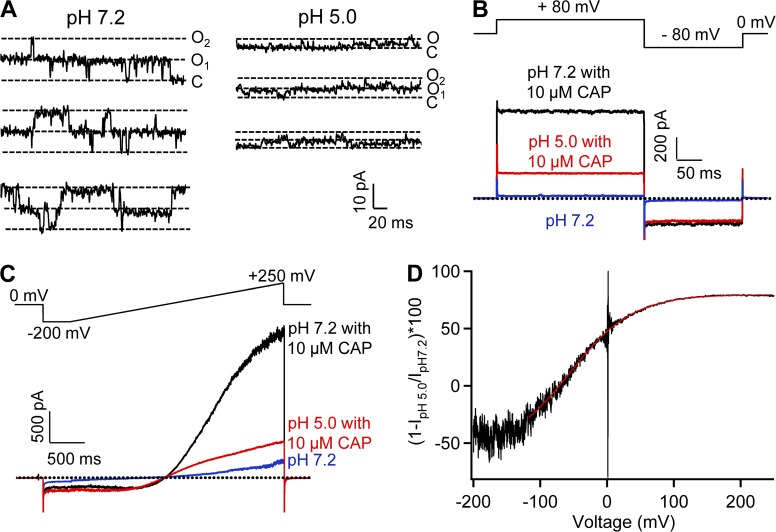
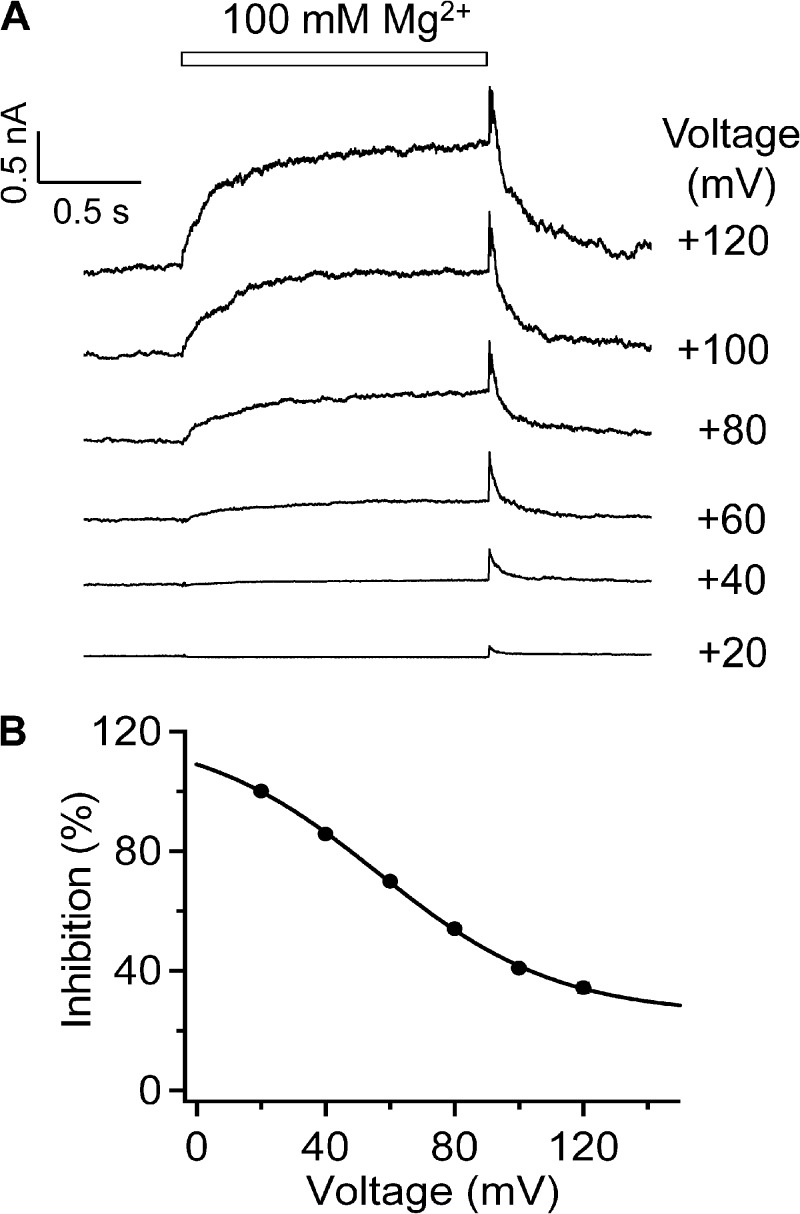
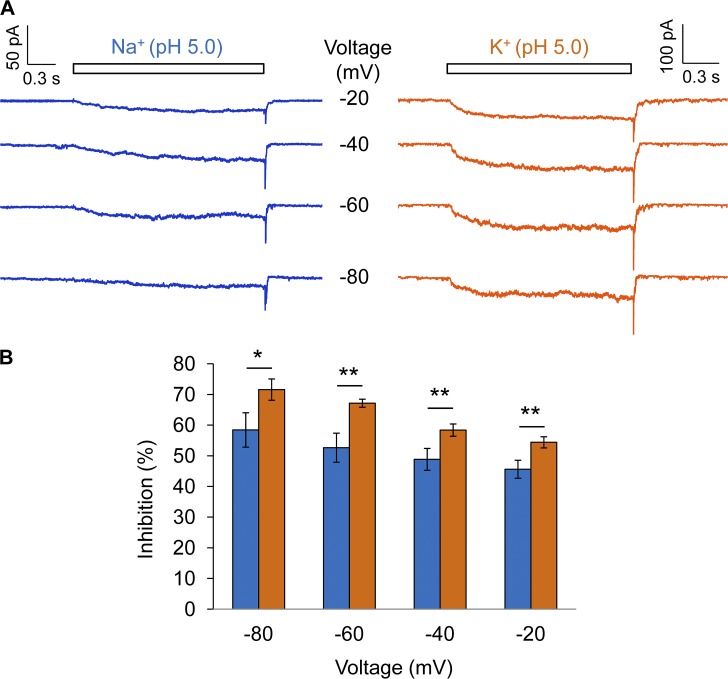
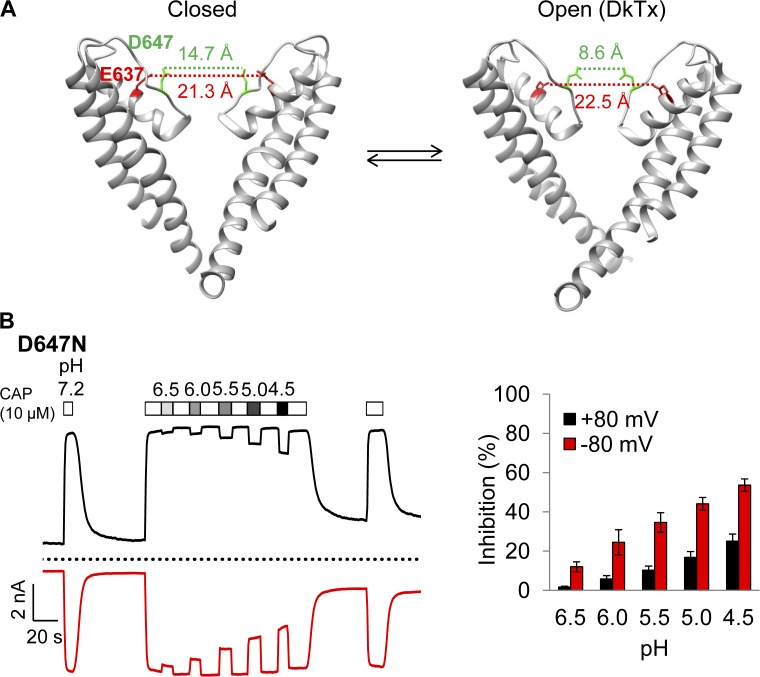
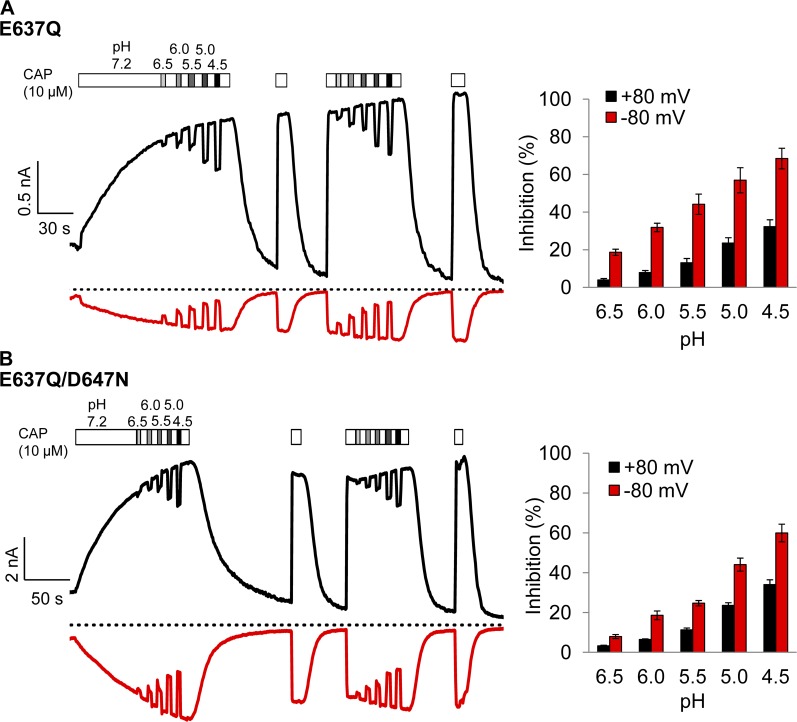
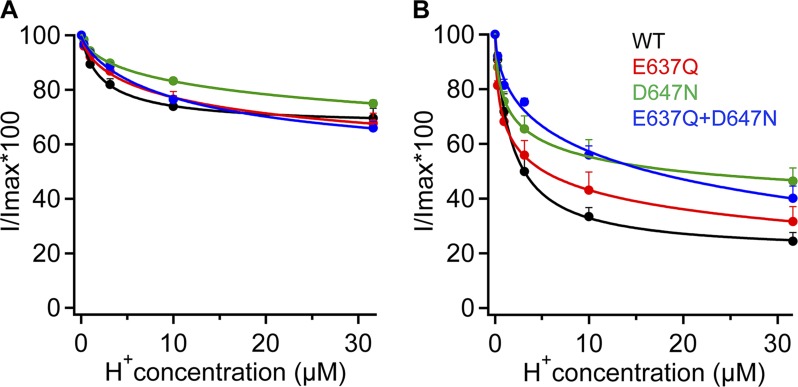
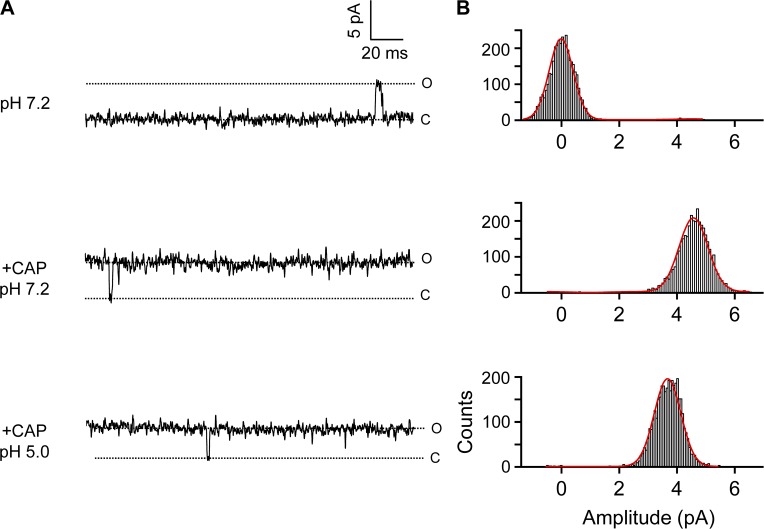
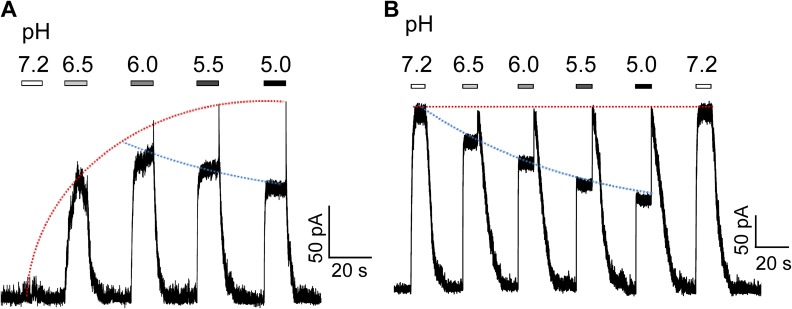
The TRPV1 cation channel is a polymodal nociceptor that is activated by heat and ligands such as capsaicin and is highly sensitive to changes in extracellular pH. In the body core, where temperature is usually stable and capsaicin is normally absent, H(+) released in response to ischemia, tissue injury, or inflammation is the best-known endogenous TRPV1 agonist, activating the channel to mediate pain and vasodilation. Paradoxically, removal of H(+) elicits a transient increase in TRPV1 current that is much larger than the initial H(+)-activated current. We found that this prominent OFF response is caused by rapid recovery from H(+) inhibition of the excitatory current carried by H(+)-activated TRPV1 channels. H(+) inhibited current by interfering with ion permeation. The degree of inhibition is voltage and permeant ion dependent, and it can be affected but not eliminated by mutations to acidic residues within or near the ion selectivity filter. The opposing H(+)-mediated gating and permeation effects produce complex current responses under different cellular conditions that are expected to greatly affect the response of nociceptive neurons and other TRPV1-expressing cells.


Figures

Figure 1.
Figure 1.
Extracellular H+ strongly activates TRPV1. (A) Representative whole-cell patch-clamp current traces recorded in Solution I in response to voltage steps at pH 7.2 (left) and pH 5.0 (right). Voltage steps were applied from a holding potential of 0 mV to various membrane potentials from −200 to 300 mV in 20-mV intervals. Dotted lines indicate zero current level. (B) Representative outside-out patch-clamp current traces recorded in Solution I in response to voltage ramps at different pH levels. Voltage ramps from −250 to 250 mV in 100 ms were applied from a holding potential of 0 mV. (C) H+-dependent shift of the G-V relationship. Different symbols represent separate recordings, whereas their colors match those of the pH levels. Superimposed are fits of a Boltzmann function with the following Vhalf and q values: pH 7.2, 129.9 mV and 0.5 e0 (n = 4); pH 6.5, 99.1 mV and 0.5 e0 (n = 3); pH 6.0, −6.1 mV and 0.4 e0 (n = 3); pH 5.5, −33.3 mV and 0.4 e0 (n = 5); pH 5.0, −93.2 mV and 0.3 e0 (n = 4).
Figure 2.
Figure 2.
H+ activates TRPV1 in a concentration-dependent manner. (A) Representative outside-out patch-clamp current traces at 40 mV in Solution IV in response to various pH levels from pH 6.5 to pH 4.5 (indicated by a bar on the top). Dotted lines indicate zero current level and the peak current level. Time constants of the current rising phase (B) and the current decline phase (C) are plotted against the extracellular pH level. n = 6 each. Error bars indicate mean ± SEM.
Figure 3.
Figure 3.
A rapid solution-switching method allows reliable recording of the OFF response. (A) Schematic diagram of rapid solution switching. (B) Representative current-clamp recording using solutions that had different junction potentials. (C) Example of solution-switching speed measured from the region indicated by the box in B. (D) Representative outside-out patch-clamp current induced by Solution IV at pH 4.5. (E) Expanded presentation of the OFF response marked by the box in D. The red dotted trace represents a single-exponential fit with a time constant of 0.10 ± 0.01 s−1 (n = 6).
Figure 4.
Figure 4.
The OFF response reveals two distinct H+-induced processes in TRPV1. The total OFF response current (I1, red squares) and the rising phase of the OFF response (I2, blue circles) were quantified in Solution IV. Curves represent fits of a Hill equation with the following EC50 and slope factor values: total current (I1), 0.3 µM, pH 6.5, and 1.6; rising phase current (I2), 1.9, pH 5.7, and 0.9. n = 6 each. Error bars indicate mean ± SEM.
Figure 5.
Figure 5.
Single-channel recording reveals two opposing effects of H+ on TRPV1. (A) Representative single-channel current traces recorded in outside-out configuration at 80 mV in Solution I at the indicated extracellular pH levels. The presented current traces were further processed by a digital filter to a final cutoff frequency of 0.41 kHz. (B) All-point histogram of single-channel events at the indicated pH levels. The superimposed curve represents a fit of a double-Gaussian function. (C) Box-and-whisker plot of single-channel conductance versus the corresponding pH level. The whisker top, box top, line inside the box, box bottom, and whisker bottom represent the maximum, 75th percentile, median, 25th percentile, and minimum value of each pool of conductance measurements, respectively. n = 5–11. *, P < 0.05; ***, P < 0.001. (D) Inhibition of conductance is plotted against the extracellular H+ concentration. Superimposed is a fit of a Hill function, with the following parameters: IC50, 2.2 µM; slope factor, 0.2. n = 5–11. Error bars indicate mean ± SEM.
Figure 6.
Figure 6.
H+ inhibition of macroscopic current. (A) Representative current traces from whole-cell recording at 80 mV (black) and −80 mV (red) using Solution IV. Extracellular H+ inhibits current induced by a saturating concentration of capsaicin (10 µM) in a pH-dependent manner. Dotted line indicates zero current level. (B) Percentage of current inhibition at different pH levels at 80 mV (black) and −80 mV (red). n = 5 each. Error bars indicate mean ± SEM.
Figure 7.
Figure 7.
Voltage-dependent H+ inhibition. Representative current traces from whole-cell recording in Solution I (A) and outside-out patch recording in Solution IV (B) at various voltages and pH 5.0. (C) The ratio I2/I1 measured from outside-out patch recordings in Solution IV exhibits voltage dependence. The superimposed curve represents a fit of a Boltzmann function with 26.6 mV for Vhalf and 0.48 e0 for q. n = 5–9. Error bars indicate mean ± SEM.
Figure 8.
Figure 8.
Voltage-dependent inhibition of capsaicin-activated current. (A) Representative currents from outside-out patch recording at various voltages in Solution IV. Arrows indicate the time when capsaicin (3 µM) was applied. Dotted line indicates zero current level. (B) The percentage of current inhibition at pH 5.0 is plotted against voltage. The superimposed curve represents a fit of a Boltzmann function with 48.7 mV for Vhalf and 0.75 e0 for q. The dotted curve represents the Boltzmann fit as shown in Fig. 7 C. n = 2–7. Error bars indicate mean ± SEM.
Figure 9.
Figure 9.
Current inhibition by intracellular H+. (A) Representative single-channel current traces recorded from an inside-out patch at 80 mV with Solution IV at pH 7.2 (left) or pH 5.0 (right) in the bath. (B and C) Representative macroscopic current traces recorded from inside-out patches at stable voltages (B) or in response to voltage ramps (C). (D) Voltage dependence of H+ inhibition (black trace) was fitted to a Boltzmann function (red trace).
Figure 10.
Figure 10.
The OFF response of Mg2+-induced TRPV1 current. (A) Representative currents from outside-out patch recording in Solution II (containing 100 mM Mg2+) at various voltages. (B) The ratio I2/I1 exhibits voltage dependence in Mg2+-induced inhibition. The superimposed curve represents a fit of a Boltzmann function with 56.3 mV for Vhalf and 0.91 e0 for q. n = 3–6. Error bars indicate mean ± SEM.
Figure 11.
Figure 11.
Interaction between H+ and permeant ions. (A) Representative currents from outside-out patch recording at pH 5.0 using different permeant ions, Na+ (left, Solution I) or K+ (right, Solution III), at various voltages. (B) The ratio I2/I1 exhibits permeant ion dependence. n = 5 each. *, P < 0.05; **, P < 0.01. Error bars indicate mean ± SEM.
Figure 12.
Figure 12.
Concentration- and voltage-dependent inhibition of D647N current by H+. (A) The cryo-EM pore structures of TRPV1 in the closed (left; Protein Data Bank accession no. 3J5P) and double-knot toxin DkTx–bound (right; Protein Data Bank accession no. 3J5Q) states. Only two of the four subunits are shown. Dotted lines indicate the distances between the hydroxyl groups of E637 and D647. (B) Representative current traces induced by 10 µM capsaicin from whole-cell recording at ±80 mV in Solution IV containing different concentrations of H+ (left) and the percentage of current inhibition (right). Dotted line indicates zero current level. n = 4. Error bars indicate mean ± SEM.
Figure 13.
Figure 13.
Mutations E637Q and E637Q/D647N do not prevent H+ inhibition. Representative current traces of E637Q (A) or E637Q/D647N (B) from whole-cell recording in Solution IV at ±80 mV (left) and the percentage of current inhibition (right). Dotted lines indicate zero current level. n = 6 each. Error bars indicate mean ± SEM.
Figure 14.
Figure 14.
Summary of H+-dependent inhibition of currents from wild type, E637Q, D647N, and E637Q/D647N in whole-cell configuration using Solution IV at 80 mV (A) or −80 mV (B). Curves represent fits of a Hill equation with the following EC50 and slope factor: (A) Wild type, 2.3 µM, pH 5.6, and 0.9; E637Q, 16.8 µM, pH 4.8, and 0.6; D647N, 34.6 µM, pH 4.9, and 0.5; E637Q/D647N, 13.2 µM, pH 4.9, and 0.8. (B) Wild type, 1.7 µM, pH 5.8, and 1.0; E637Q, 0.5 µM, pH 6.3, and 0.2; D647N, 1.4 µM, pH 5.9, and 0.4; E637Q/D647N, 37.7 µM, pH 4.4, and 0.4. n = 4–6. Error bars indicate mean ± SEM.
Figure 15.
Figure 15.
Single-channel recordings confirm H+ inhibition of E637Q/D647N mutation channels. (A) Representative single-channel current traces recorded in outside-out configuration at 80 mV in Solution IV at the indicated extracellular pH levels in the presence or absence of capsaicin. The presented current traces were processed by a digital filter to a final cutoff frequency of 0.41 kHz. (B) All-point histograms of single-channel events at the indicated pH levels. The superimposed curve represents the fit of a double-Gaussian function. n = 3–5.
Figure 16.
Figure 16.
Variable TRPV1 responses to H+ under different conditions. Representative outside-out patch current traces at 40 mV in Solution I containing 10 nM (A) or 3 µM (B) capsaicin in response to H+ at different concentrations. The trend lines indicate gating (red) and permeation (blue) effects of H+ on TRPV1.

References

    1. Ahern G.P., Brooks I.M., Miyares R.L., and Wang X.B.. 2005. Extracellular cations sensitize and gate capsaicin receptor TRPV1 modulating pain signaling. J. Neurosci. 25:5109–5116. 10.1523/JNEUROSCI.0237-05.2005 - DOI - PMC - PubMed
    1. Aneiros E., Cao L., Papakosta M., Stevens E.B., Phillips S., and Grimm C.. 2011. The biophysical and molecular basis of TRPV1 proton gating. EMBO J. 30:994–1002. 10.1038/emboj.2011.19 - DOI - PMC - PubMed
    1. Baumann T.K., and Martenson M.E.. 2000. Extracellular protons both increase the activity and reduce the conductance of capsaicin-gated channels. J. Neurosci. 20:RC80. - PMC - PubMed
    1. Bers D.M. 2001. Excitation-contraction coupling and cardiac contractile force. Kluwer Academic Publishers, Norwell, MA: 427 pp10.1007/978-94-010-0658-3 - DOI
    1. Bevan S., and Geppetti P.. 1994. Protons: small stimulants of capsaicin-sensitive sensory nerves. Trends Neurosci. 17:509–512. 10.1016/0166-2236(94)90149-X - DOI - PubMed

Publication types