. 2015 Jul 28;112(30):E4147-55.
doi: 10.1073/pnas.1503106112. Epub 2015 Jul 13.

Navigating natural variation in herbivory-induced secondary metabolism in coyote tobacco populations using MS/MS structural analysis

Affiliations

Navigating natural variation in herbivory-induced secondary metabolism in coyote tobacco populations using MS/MS structural analysis

Dapeng Li et al. Proc Natl Acad Sci U S A. .

Abstract

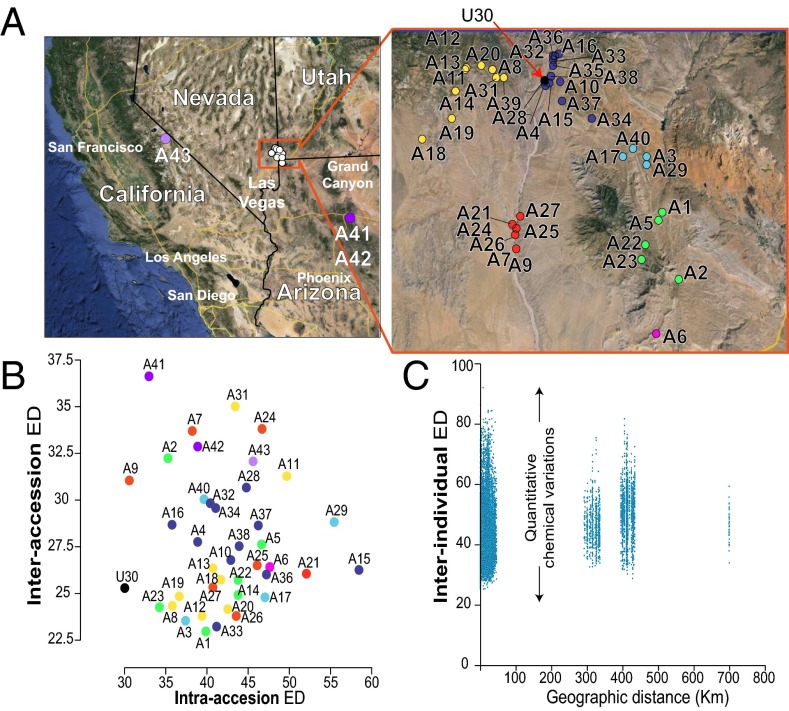
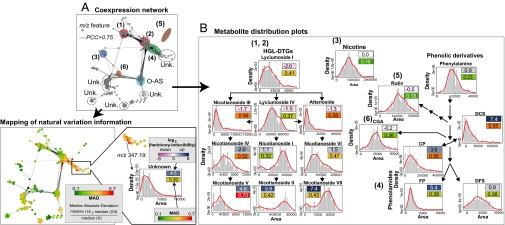
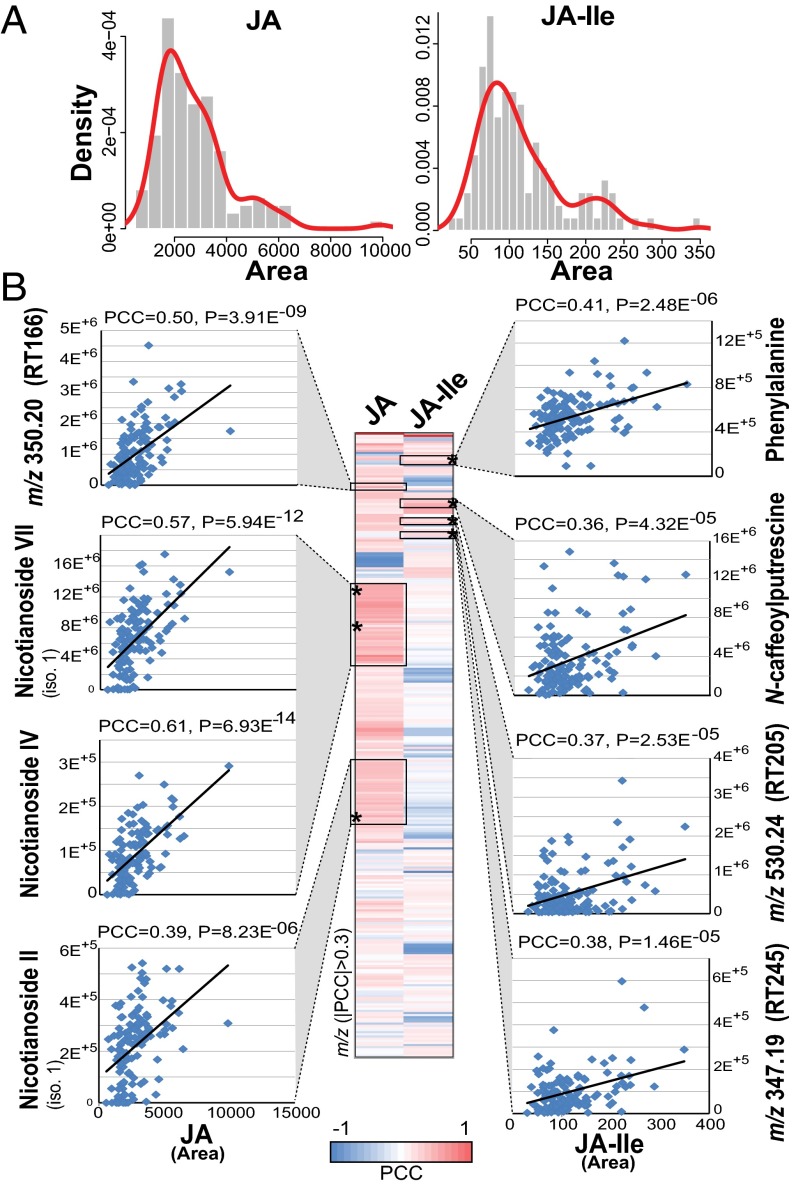
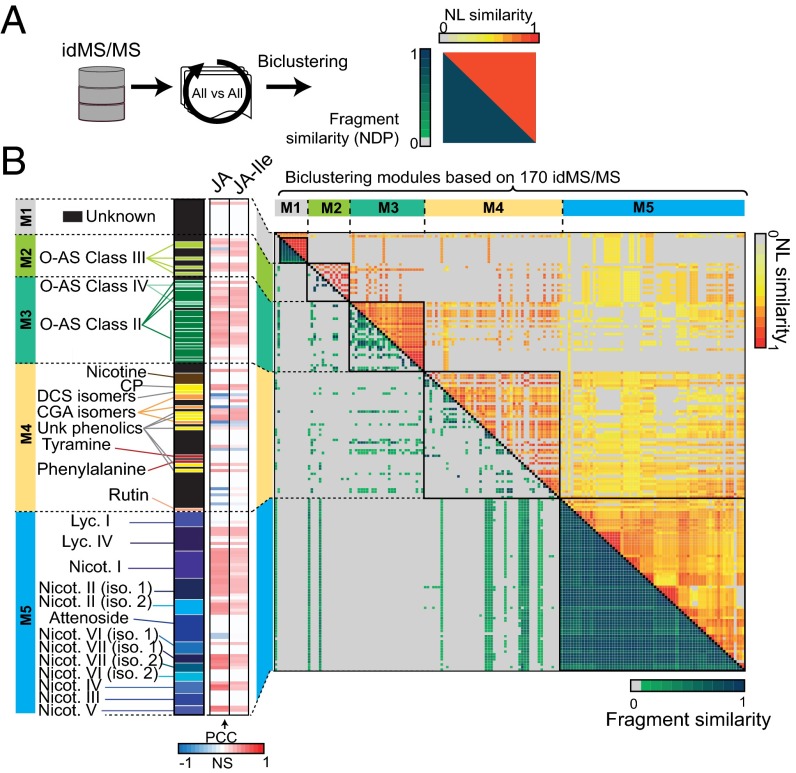
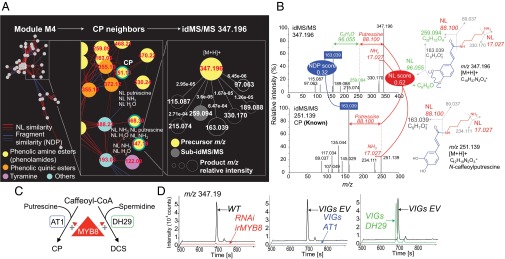
Natural variation can be extremely useful in unraveling the determinants of phenotypic trait evolution but has rarely been analyzed with unbiased metabolic profiling to understand how its effects are organized at the level of biochemical pathways. Native populations of Nicotiana attenuata, a wild tobacco species, have been shown to be highly genetically diverse for traits important for their interactions with insects. To resolve the chemodiversity existing in these populations, we developed a metabolomics and computational pipeline to annotate leaf metabolic responses to Manduca sexta herbivory. We selected seeds from 43 accessions of different populations from the southwestern United States--including the well-characterized Utah 30th generation inbred accession--and grew 183 plants in the glasshouse for standardized herbivory elicitation. Metabolic profiles were generated from elicited leaves of each plant using a high-throughput ultra HPLC (UHPLC)-quadrupole TOFMS (qTOFMS) method, processed to systematically infer covariation patterns among biochemically related metabolites, as well as unknown ones, and finally assembled to map natural variation. Navigating this map revealed metabolic branch-specific variations that surprisingly only partly overlapped with jasmonate accumulation polymorphisms and deviated from canonical jasmonate signaling. Fragmentation analysis via indiscriminant tandem mass spectrometry (idMS/MS) was conducted with 10 accessions that spanned a large proportion of the variance found in the complete accession dataset, and compound spectra were computationally assembled into spectral similarity networks. The biological information captured by this networking approach facilitates the mining of the mass spectral data of unknowns with high natural variation, as demonstrated by the annotation of a strongly herbivory-inducible phenolic derivative, and can guide pathway analysis.

Keywords: mass spectrometry; metabolomics; natural variation; plant–insect interactions.


Conflict of interest statement

The authors declare no conflict of interest.

Figures

Fig. 1.
Fig. 1.
Herbivory-induced metabolic profiles of N. attenuata populations exhibit extensive intra- and interaccession quantitative variations. (A) The location of the 43 accession seed collection sites in Utah, Nevada, Arizona, and California. A close-up for the collection sites in Utah is presented. Full GPS coordinates are provided in SI Appendix, Table S1. Colors were arbitrarily given to accessions to highlight accessions collected within the same large geographic region. (B) Classification of accession according to intraaccession (x axis) and interaccession (y axis) Euclidean distances calculated for the complete metabolic profile. As expected, metabolomes of replicated plants from U30, a Utah accession inbred for 30 generations, show low variations. Plants from seeds collected in California and Arizona exhibit higher inter- than intraaccession variations. (C) Scatter plots of Euclidean distances calculated individual sample pairs, demonstrating no clear relationship between geographical distance and metabolic profile variations. Each dot represents one sample pair, and its coordinates correspond to the geographic distance (x axis) and Euclidean distance of the metabolic profiles for this sample pair. Closely related individuals exhibit high quantitative metabolic variation when grown under glasshouse conditions, and no correlation is detected between the geographic and Euclidean distances.
Fig. 2.
Fig. 2.
Natural variation affects metabolite inducibility by herbivory at both pathway and single compound scales. (A) Covariance network visualized for metabolite-derived m/z features [Pearson correlation coefficient (PCC) of >0.75, biolayout, based on 1,044 m/z features extracted from 183 samples] obtained by nontargeted postprocessing of N. attenuata accession UHPLC-qTOFMS metabolic profiles indicates pathway-specific and compound-explicit differential inducibility by herbivory and variability through accessions. Different compound classes are annotated using different colored ellipses. Unk., unknown compound class. The resulting network topology was used to map m/z feature-specific natural variation coefficients calculated as relative median absolute distance (relative MAD); the degree of MAD is indicated by the node color from green (low) to red (high). In the MAD formula, Xi represents the ith value across the population for the m/z signal denoted as X. (B) Simplified metabolic schemes and density distribution plots for main intermediates in known secondary metabolic pathways involved in antiherbivore responses in N. attenuata that were extracted from the coexpression network: (diagrams 1 and 2) hydroxygeranyllinalool diterpene glycosides (HGL-DTGs); (diagram 3) nicotine; (diagram 4) phenolamides (CP, N-caffeoylputrescine; DCS, N′,N′′-dicaffeoylspermidine; DFS, N′,N′′-diferuloylspermidine, FP, N-feruloylputrescine); (diagram 5) rutin; (diagram 6) CGA, chlorogenic acid. Distribution histogram plots are overlaid with a density line depict distribution of intensities for known metabolites across the dataset with x axis, area of intensities, and y axis, fitted density with histogram. Nicotine, phenylalanine, rutin, and CGA, which show no to moderate induction by herbivory, exhibit the lowest degree of natural variation in our analysis. Metabolite inducibility is defined as the log2-scaled fold change value between herbivory-induced and control samples of U30 (average fold change from 13 replicates) and is depicted by color boxes ranging from pink (low) to blue (high). The log2-scaled inducibility and relative MAD values are reported in the corresponding boxes. Statistics for log2-scaled fold changes are reported in Dataset S1.
Fig. 3.
Fig. 3.
Natural variation in jasmonate levels only partly accounts for polymorphisms in specialized metabolism and highlights unknown metabolites associated with jasmonate signaling. (A) Density distribution plots (x axis, area of intensities and y axis, fitted density with histogram) (123 samples) illustrating natural variation patterns in JA and JA-Ile levels analyzed by targeted LC-MS/MS/MS for leaf samples collected 1 h after simulated herbivory from glasshouse-grown accessions of N. attenuata. (B) Heatmap of pairwise Pearson correlation coefficients (PCCs) (only PCCs of >0.3 are shown based on 123 samples) for significant coregulation patterns between deconvoluted m/z signals and JA and JA-Ile levels. Examples are presented for known and unknown metabolites with significant correlations with either JA or JA-Ile. Boxes denote in-source fragmentation clusters translating from metabolite ionization and fragmentation. An * indicates the position of metabolite-specific precursor ions from which quantitative data used for the scatter plot representations are derived. iso., isomer; RT, retention time in seconds.
Fig. 4.
Fig. 4.
Biclustering of idMS/MS according to structural relationships computed from fragment and neutral loss similarity metrics facilitate compound class assignments. (A) All-against-all alignment of idMS/MS based on fragment and neutral loss similarity calculation. (B) Biclustering using the R Diffcoex package of idMS/MS according to results of these two similarity analyses identifies five idMS/MS modules (M1, M2, M3, M4, and M5) that partly overlap to a priori knowledge on compound class definition. Green-to-blue gradient denotes medium-to-high fragment similarity whereas that from yellow-to-red indicates medium-to-high neutral loss similarity. Compound annotation is indicated on the left of the heatmap. Black cells correspond to unknown metabolites whereas the different color variations correspond to different compound classes. The next heatmap bar visualizes significant Pearson correlation values with JA and JA-Ile induced levels as detected in Fig. 3. A neutral loss (NL) map in which shared NLs between classified idMS/MS are reported is presented in SI Appendix, Fig. S6. This map was used to infer NLs overrepresented in a particular module. Close views on module subsections highlighting shared NLs and relevant m/z features resulting from fragmentation are reported in SI Appendix, Figs. S7 and S8. CGA, chlorogenic acid; DCS, N′,N′′-dicaffeoylspermidine; iso., isomer; Lyc., lyciumoside; Nicot., nicotianoside; O-AS, O-acyl sugars.
Fig. 5.
Fig. 5.
Navigating the idMS/MS similarity network supports structural predictions for novel herbivory-regulated metabolites. (A) Close-up views on the similarity network constructed for module 4 resulting from the biclustering analysis. Module 4 is enriched in previously characterized and structurally elucidated phenolamides, most of which are strongly responsive to simulated herbivory treatments, but also includes unknown metabolites with JA signaling associated natural variation such as m/z 347.19 at retention time 245 s. The composite idMS/MS for m/z 347.19 is the one of the first network neighbors of N-caffeoylputrescine (CP) with idMS/MS m/z 251.13 due to neutral loss and fragment-based similarities. (B) idMS/MS m/z 251.13 and m/z 347.19 share neutral loss corresponding to the loss of putrescine. The intense fragment peak at m/z 163.04 shared by both idMS/MS corresponds to the caffeoyl moiety cleavage from the putrescine. Interestingly, in the case of idMS/MS m/z 347.19, only this fragment derives from an additional neutral loss of C6H8O as part of pseudo-MS3 reaction supported by the alignment of idMS/MS m/z 259.13. (C) Working model for MYB8-regulated N-acyltransferase–mediated production of phenolamides. AT1 catalyzes the formation of putrescine-based phenolamides whereas DH29 acts as a first committed step in spermidine conjugate production. (D) Extracted ion traces for m/z 347.19 supporting its classification as an MYB8-dependent, putrescine-based phenolamide dependent on the catalytic activity of AT1 (SI Appendix, Table S3). Additional results obtained from molecular studies of the metabolic conversion from CP to the phenolamide-related m/z 347.19 are presented in SI Appendix, Fig. S10. EV, empty-vector VIGs control; irMYB8, stably silenced MYB8 transformant; VIGs, virus-induced gene transient silencing.

References

    1. Xiao Q, et al. Sources of variability in metabolite measurements from urinary samples. PLoS ONE. 2014;9(5):e95749. - PMC - PubMed
    1. Weng JK. The evolutionary paths towards complexity: A metabolic perspective. New Phytol. 2014;201(4):1141–1149. - PubMed
    1. Agrawal AA, Hastings AP, Johnson MT, Maron JL, Salminen JP. Insect herbivores drive real-time ecological and evolutionary change in plant populations. Science. 2012;338(6103):113–116. - PubMed
    1. Berenbaum MR, Zangerl AR. Facing the future of plant-insect interaction research: Le retour à la “raison d’être”. Plant Physiol. 2008;146(3):804–811. - PMC - PubMed
    1. Prasad KV, et al. A gain-of-function polymorphism controlling complex traits and fitness in nature. Science. 2012;337(6098):1081–1084. - PMC - PubMed

Publication types