. 2015 Jul 28;112(30):E4094-103.
doi: 10.1073/pnas.1421580112. Epub 2015 Jul 13.

TACI deficiency leads to alternatively activated macrophage phenotype and susceptibility to Leishmania infection

Affiliations

TACI deficiency leads to alternatively activated macrophage phenotype and susceptibility to Leishmania infection

Windy R Allman et al. Proc Natl Acad Sci U S A. .

Abstract

The TNF family member, transmembrane activator and calcium-modulator and cyclophilin ligand interactor (TACI), is a key molecule for plasma cell maintenance and is required in infections where protection depends on antibody response. Here, we report that compared with WT mouse, TACI KO Μϕs expressed lower levels of Toll-like receptors (TLRs), CD14, myeloid differentiation primary response protein 88, and adaptor protein Toll/IL-1 receptor domain-containing adapter-inducing IFN-β and responded poorly to TLR agonists. Analysis of Μϕ phenotype revealed that, in the absence of TACI, Μϕs adapt the alternatively activated (M2) phenotype. Steady-state expression levels for M2 markers IL-4Rα, CD206, CCL22, IL-10, Arg1, IL1RN, and FIZZ1 were significantly higher in TACI KO Μϕ than in WT cells. Confirming their M2 phenotype, TACI-KO Mϕs were unable to control Leishmania major infection in vitro, and intradermal inoculation of Leishmania resulted in a more severe manifestation of disease than in the resistant C57BL/6 strain. Transfer of WT Μϕs to TACI KO mice was sufficient to significantly reduce disease severity. TACI is likely to influence Mϕ phenotype by mediating B cell-activating factor belonging to the TNF family (BAFF) and a proliferation inducing ligand (APRIL) signals because both these ligands down-regulated M2 markers in WT but not in TACI-deficient Μϕs. Moreover, treatment of Μϕs with BAFF or APRIL enhanced the clearance of Leishmania from cells only when TACI is expressed. These findings may have implications for understanding the shortcomings of host response in newborns where TACI expression is reduced and in combined variable immunodeficiency patients where TACI signaling is ablated.

Keywords: APRIL; BAFF; Leishmania; TACI; macrophage.


Conflict of interest statement

The authors declare no conflict of interest.

Figures
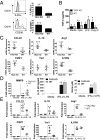
Fig. 1.
Fig. 1.
Expression of M1 and M2 markers in Mϕs. (A) Shown in histogram is the expression of IL-4Rα and CD206 in purified pMϕs determined by flow cytometry. Mean percentages ± SD of CD11b+IL-4Rα+ and CD11b+CD206+ cells from three experiments are plotted. (B) Concentration of TGF-β in the supernatants of pMϕs after CpG, LPS, or Poly I:C stimulation for 24 h. ELISA results shown are the mean ± SD of six determinations from three independent experiments. (C) Ex vivo mRNA expression of M2 markers by pMϕs. Relative gene expression normalized to GAPDH ± SD was plotted. (D) pMϕs were treated with 50 ng/mL IFN-γ and 100 ng/mL LPS (M1 stimulus) or left in media for 24 h. Fold differences in MMP9 mRNA expression compared with media were determined by qPCR. Culture supernatant IL-12p40 levels were measured in ELISA, and nitrite production was measured using Griess reagent. (E) TACI KO and WT pMϕs were treated with 15 ng/mL IL-4 and 15 ng/mL IL-13 (M2 stimulus) or left in media for 24 h. Fold differences of CCL22, IL-10, Arg1, IL1RN, Ym1, and FIZZ1 mRNA expression compared with media control were determined by qPCR. Mean ± SD was obtained from three independent experiments each with at least three mice per group.*P < 0.05, **P < 0.01, and ***P < 0.001 for statistical differences between WT and TACI KO cells.
Fig. 2.
Fig. 2.
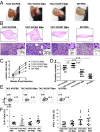
Macrophage infection with L. major. (A–C) BMDMs were infected with stationary phase cultures of L. major promastigotes. At 6 h, 2 d, and 4 d after infection, slides were fixed and stained. (A) Diff-Quick stain of WT and TACI KO Mϕs 4 d after infection is shown. Red arrows indicate intracellular Leishmania amastigotes. (B) Kinetics of parasite load in BMDMs. Results expressed either as the mean number of parasites/infected Mϕs or as percentage of Mϕs that were infected by Leishmania. *P < 0.05 and ***P < 0.001 for statistical differences between WT and TACI KO mice. (C) Nitrite production in Leishmenia-infected BMDMs was measured in culture supernatants using Griess reagent. *P < 0.05 for statistical differences between WT and TACI KO mice. #P < 0.05 for statistical differences between 6 h and 2 d. (D–H) The ears of WT and TACI KO mice were infected with 1 × 10⁴ metacyclic promastigotes of Leishmania by i.d. injection. (D) Representative ear images 5 wk after i.d. infection with Leishmania. (E) Kinetics of ear lesion size over the course of a 12-wk Leishmania infection in TACI KO (n = 9) and WT mice (n = 9). (F) Representative H&E-stained sections of WT and TACI KO ears 5 wk after i.d. infection with Leishmania. (Upper) Magnification, 1.25×. (Lower) Magnification, 100×. Red arrows indicate intracellular Leishmania amastigotes. (G) Representative immunohistochemical staining of ear sections showing iNOS expression at 5 wk of Leishmania infection. Shown at 10× magnification. (H) Parasite load in ear or draining LN of TACI KO and WT mice 5 wk after infection with Leishmania. Results expressed as the geometric mean number of parasites per organ. ††P < 0.01 for statistical differences between 5 and 12 wk after infection. *P < 0.05, **P < 0.01, and ***P < 0.001 for statistical differences between the WT and TACI KO mice.
Fig. 3.
Fig. 3.
Analysis of in vivo host response following L. major infection in TACI KO mice. (A and B) TACI KO and WT mice were infected i.d. with 2 × 10⁵ metacyclic promastigotes of RFP-Leishmania. Two weeks after infection with RFP-Leishmania, infected dermal Mϕs (RFP-Leishmania+CD11b+Ly6G−CD11b−) were sorted from ear. Experiment was repeated three times with pooled digests from four to six ears per experiment. (A) Mean percentage ± SD and MFI ± SD of RFP-Leishmania+ dermal Mϕs determined by flow cytometry are plotted. (B) Quantification of genes associated with M2 phenotype in RFP-Leishmania–infected dermal Mϕs. Relative gene expression compared with GAPDH ± SD was determined by qPCR. Mean values from three experiments are plotted. (C and D) The ears of WT and TACI KO mice were infected with 1 × 10⁴ metacyclic promastigotes of Leishmania by i.d. injection. (C) Representative intracellular cytokine staining plots indicating the frequency of Th1 (IFN-γ) and Th2 (IL-4) CD4+ T cells 2, 5, and 12 wk after infection found within the Leishmania infected ear lesion. Freshly isolated ear-derived skin cells were directly stained for IFN-γ or IL-4. (D) Kinetic analysis of mean percentages ± SD of CD4+IL-4+ and CD4+IFN-γ+ cells from two experiments are plotted as chart with 10 mice per group. *P < 0.05, **P < 0.01, and ***P < 0.001 for statistical differences between TACI KO and WT mice.
Fig. 4.
Fig. 4.
Adoptive transfer of WT Mϕs to TACI KO mice protects against cutaneous leishmaniasis. Adherent pMϕs (CD11b+MHCII+Ly6G−CD11c− cells) were isolated from naïve WT or TACI KO mice and i.v. transferred (3 × 10⁶ cells per mouse) to TACI KO mice that were infected with 1 × 10⁴ metacyclic promastigotes of Leishmania by i.d. injection the previous day. Figure label indicates the strain of host/strain of Mϕs adoptively transferred. (A) Representative ear images 5 wk after i.d. infection with Leishmania. (B) Representative H&E-stained sections of WT and TACI KO ears 5 wk after i.d. infection with Leishmania (Upper and Lower at 4× and 100× magnification, respectively). (Insets) Magnified views of representative vacuoles containing Leishmania amastigotes depicted as cartoons. (C) Kinetics of ear lesion size over the course of a 5-wk Leishmania infection. Mean lesion size ± SD was obtained from two independent experiments each with five mice per group. Statistical comparison can be found in SI Appendix, Table S1. (D) Parasite load in ear or draining LN of TACI KO and WT mice 5 wk after infection with Leishmania. Results expressed as the geometric mean number of parasites per ear (n = 10 mice per group). **P < 0.01 and ***P < 0.001 indicate for statistical differences between mouse groups. (E) Representative intracellular cytokine staining plots indicating the frequency of Th1 (IFN-γ) and Th2 (IL-4) CD4+ T cells at 5 wk after infection found within the ear Leishmania lesion. Freshly isolated ear-derived skin cells were directly stained for IFN-γ or IL-4. (F) Mean frequency ± SD of CD4+IL-4+ and CD4+ IFN-γ+ cells from two experiments are plotted as chart with 10 mice per group. *P < 0.05 for statistical differences between TACI KO and WT mice.
Fig. 5.
Fig. 5.
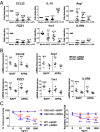
The effect of BAFF and APRIL stimulation of Mϕs on M2 polarization and parasite growth. (A) pMϕs from WT mouse were stimulated with BAFF, APRIL, IFN-γ, and LPS or left in media for 24 h. Fold differences of CCL22, IL-10, Arg1, FIZZ1, Ym1, and IL1RN mRNA expression compared with media control were determined by qPCR. Mean ± SD from six to nine samples from three independent experiments are shown. **P < 0.01 and ***P < 0.001 for statistical differences between media and stimulated cells. (B) qPCR analysis of M2 gene expression in BAFF- or APRIL-stimulated Mϕs that had been transfected with TACI siRNA or control siRNA. Relative gene expression normalized to GAPDH ± SD was plotted. Mean expression ± SD from five experiments is shown. *P < 0.05, **P < 0.01, and ***P < 0.001 for statistical differences between Control siRNA and TACI siRNA-treated cells. (C) pMϕs from WT or TACI KO mice were infected with stationary phase cultures of L. major promastigotes. After 6 h, extracellular Leishmania were washed from cells, and BAFF or APRIL was added to infected pMϕs at various concentrations. Mean number of parasites per infected pMϕs and the percentage of pMϕs that were infected by Leishmania were determined 48 h later. **P < 0.01 and ***P < 0.001 for statistical differences between media and cytokine-treated cells. Red asterisk indicates significant changes when BAFF was added, whereas the blue asterisk indicates statistically significant changes when APRIL was added to the cells.
Fig. 6.
Fig. 6.
TACI-mediated ERK1/2 signaling in pMϕs. (A) pMϕs from TACI KO or WT mice were stimulated with APRIL, LPS, and IFN-γ for 0, 3, and 24 h. Total and phosphorylated ERK1/2 molecules were detected by Western blot analysis. One of three experiments with similar results is shown. (B) The ratio of the band density of phosphorylated ERK1/2 molecules to total ERK1/2 was calculated for each condition. Mean fold induction in band density relative to 0 h ± SD from three experiments is shown. **P < 0.01 for statistical differences between WT and TACI KO cells. ##P < 0.01 and ###P < 0.001 for statistical differences between media and stimulated cells. (C–E) WT pMϕs were stimulated with APRIL in the presence or absence of U0126 inhibitor (20 nM) for 24 h. (C) Total and phosphorylated ERK1/2 molecules were detected in Western blot analysis. One of two experiments with similar results is shown. (D) CD80 expression was determined by flow cytometry. A representative experiment out of three repeats with similar results is shown. The frequencies of CD80+ cells are shown in each histogram. Solid black line indicates CD80 Ab staining, and filled histogram shows isotype controls Ab staining. (E) Culture supernatant IL-6 levels were measured by ELISA. Mean concentrations ± SD from three experiments are shown. Data from three experiments ± SD were plotted. ***P < 0.001 for statistical differences between U0126 treated and untreated cells. ###P < 0.001 for statistical differences in expression between media and APRIL-stimulated cells.

References

    1. Mackay F, Schneider P. Cracking the BAFF code. Nat Rev Immunol. 2009;9(7):491–502. - PubMed
    1. Katsenelson N, et al. Synthetic CpG oligodeoxynucleotides augment BAFF- and APRIL-mediated immunoglobulin secretion. Eur J Immunol. 2007;37(7):1785–1795. - PubMed
    1. von Bülow GU, van Deursen JM, Bram RJ. Regulation of the T-independent humoral response by TACI. Immunity. 2001;14(5):573–582. - PubMed
    1. Romberg N, et al. CVID-associated TACI mutations affect autoreactive B cell selection and activation. J Clin Invest. 2013;123(10):4283–4293. - PMC - PubMed
    1. Kanswal S, Katsenelson N, Selvapandiyan A, Bram RJ, Akkoyunlu M. Deficient TACI expression on B lymphocytes of newborn mice leads to defective Ig secretion in response to BAFF or APRIL. J Immunol. 2008;181(2):976–990. - PubMed

Publication types

MeSH terms

Substances