. 2015 Jul 28;112(30):9364-9.
doi: 10.1073/pnas.1510328112. Epub 2015 Jul 13.

High-throughput analysis of yeast replicative aging using a microfluidic system

Affiliations

High-throughput analysis of yeast replicative aging using a microfluidic system

Myeong Chan Jo et al. Proc Natl Acad Sci U S A. .

Abstract

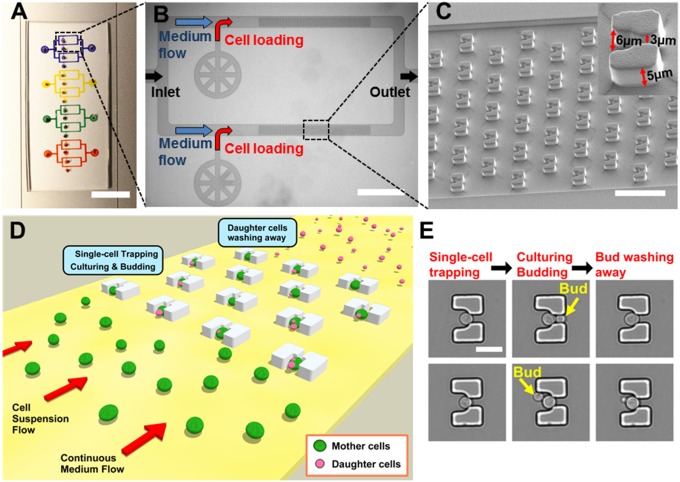
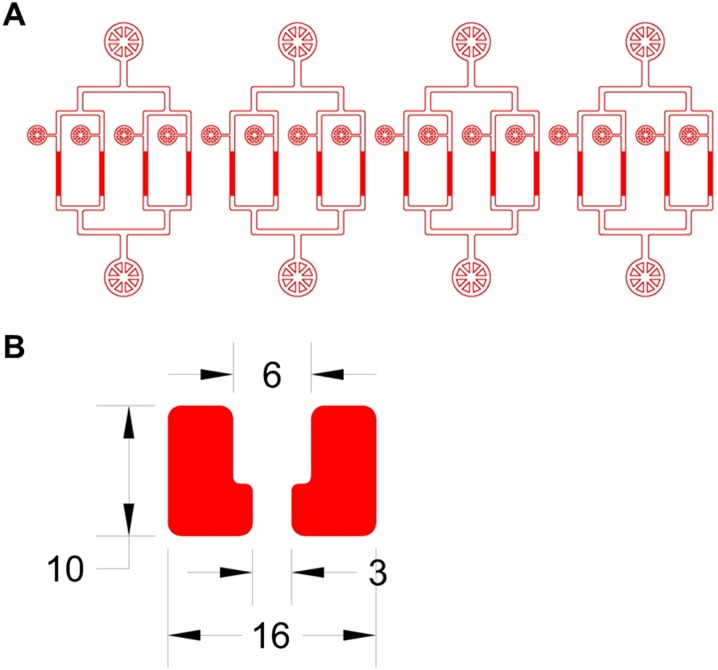
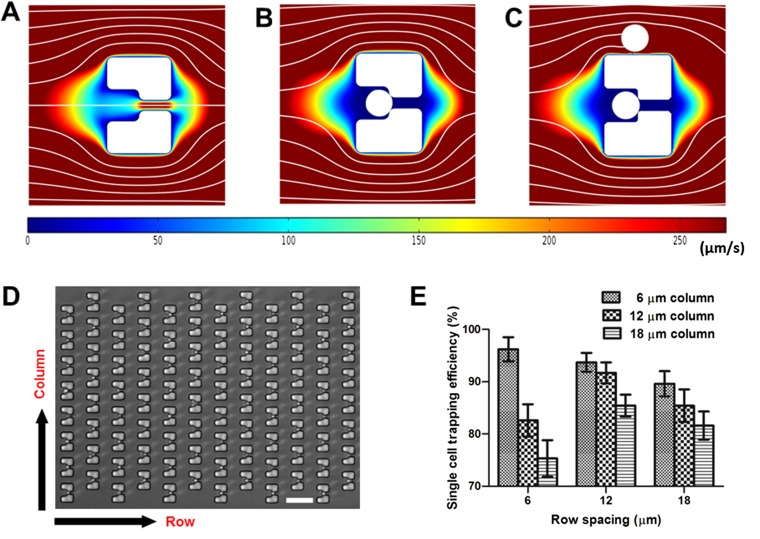
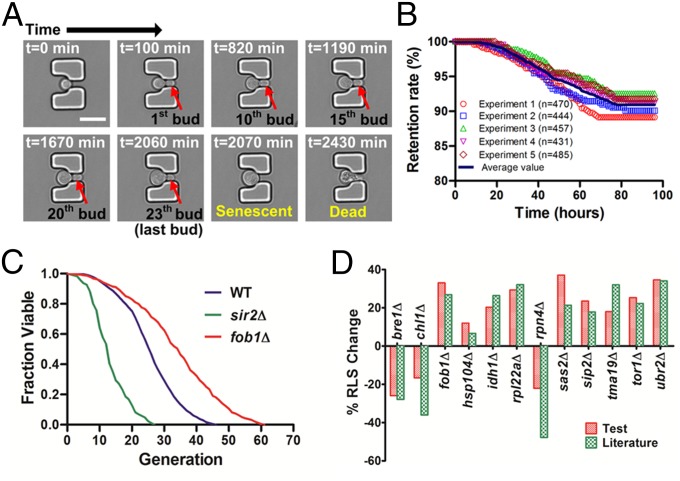
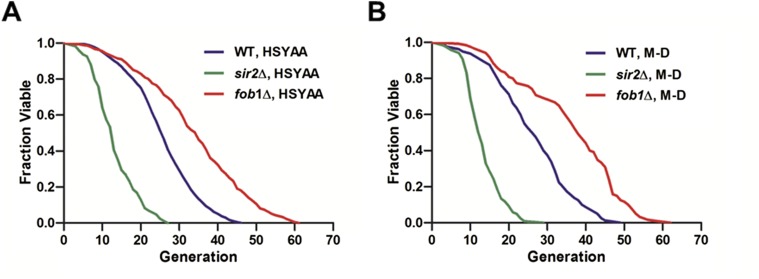
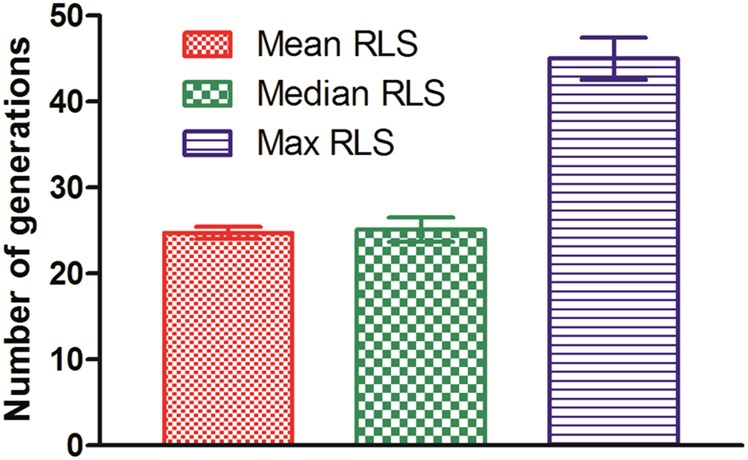
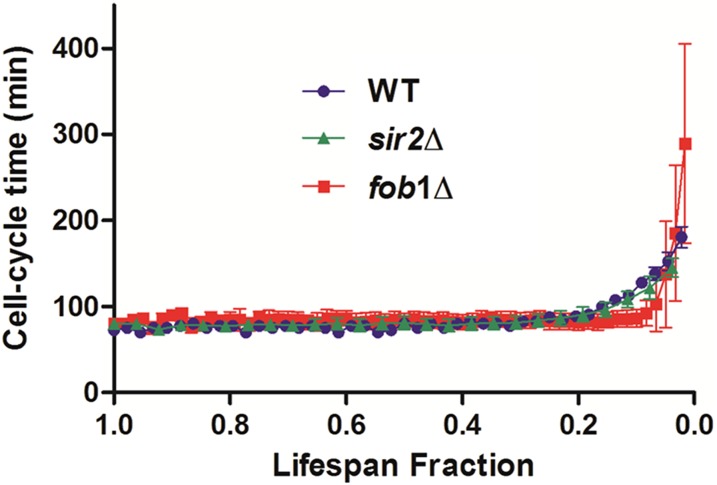
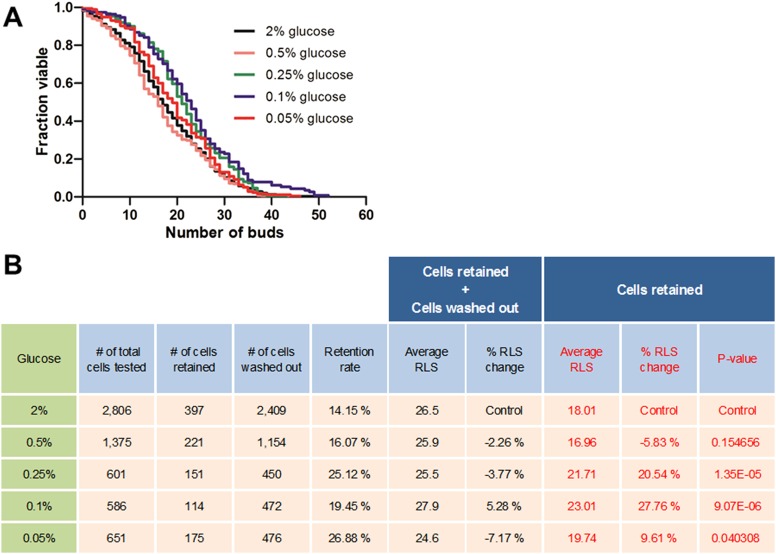
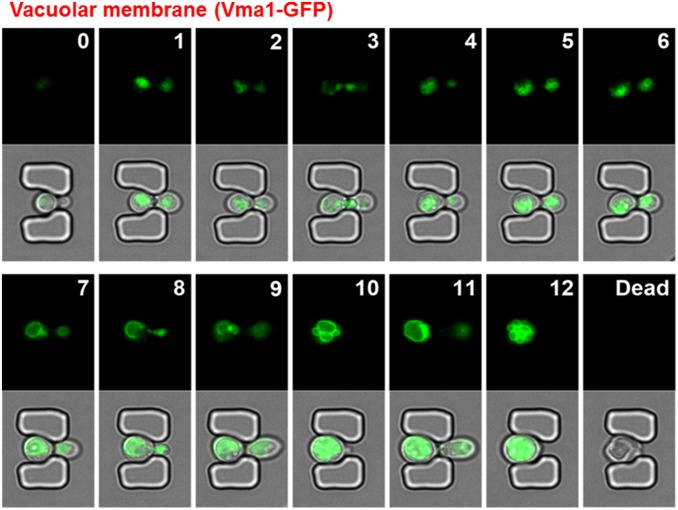
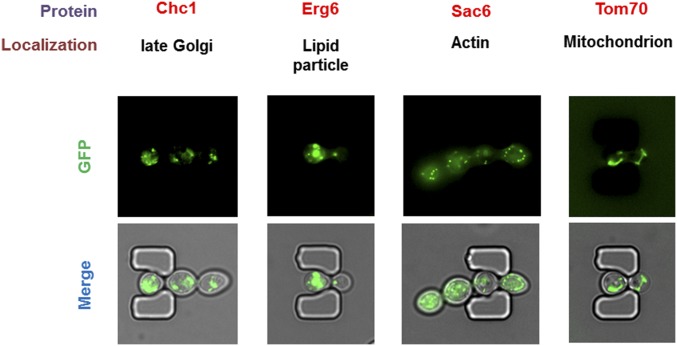
Saccharomyces cerevisiae has been an important model for studying the molecular mechanisms of aging in eukaryotic cells. However, the laborious and low-throughput methods of current yeast replicative lifespan assays limit their usefulness as a broad genetic screening platform for research on aging. We address this limitation by developing an efficient, high-throughput microfluidic single-cell analysis chip in combination with high-resolution time-lapse microscopy. This innovative design enables, to our knowledge for the first time, the determination of the yeast replicative lifespan in a high-throughput manner. Morphological and phenotypical changes during aging can also be monitored automatically with a much higher throughput than previous microfluidic designs. We demonstrate highly efficient trapping and retention of mother cells, determination of the replicative lifespan, and tracking of yeast cells throughout their entire lifespan. Using the high-resolution and large-scale data generated from the high-throughput yeast aging analysis (HYAA) chips, we investigated particular longevity-related changes in cell morphology and characteristics, including critical cell size, terminal morphology, and protein subcellular localization. In addition, because of the significantly improved retention rate of yeast mother cell, the HYAA-Chip was capable of demonstrating replicative lifespan extension by calorie restriction.

Keywords: Saccharomyces cerevisiae; calorie restriction; high-throughput; microfluidics; replicative aging.


Conflict of interest statement

The authors declare no conflict of interest.

Figures

Fig. 1.
Fig. 1.
Design and working mechanism of the HYAA-Chip for studying aging in yeast. (A) Optical image of the fabricated HYAA-Chip. (Scale bar: 10 mm.) (B) Microscopic image of branched trapping channels linked in parallel. (Scale bar: 1 mm.) (C) SEM of trap arrays in the HYAA-Chip at a 40° tilt angle. (Scale bar: 50 μm.) (Inset) SEM image of a magnified single-trap structure. (D) Schematic view showing the HYAA-Chip working mechanism. (E) Example images of a single yeast cell showing the working mechanism procedure. (Scale bar: 10 μm.)
Fig. S1.
Fig. S1.
Design of the HYAA-Chip and the trap structure. (A) Exported image from the AutoCAD file of the HYAA-Chip. The AutoCAD design file is available upon request. (B) Magnified view of the single trap in AutoCAD file showing detailed design and dimensions. The unit is microns.
Fig. S2.
Fig. S2.
Single yeast cell trapping. (A–C) Magnified view of simulated medium flow velocity field and streamlines for a single trap (A) before and (B) after single cell trapping, as well as (C) while bypassing a subsequent cell. Streamlines indicate the medium flow direction. Colors represent the magnitude of medium flow velocity. (D) Image of immobilized single yeast cells in a trap array to demonstrate the spacing between columns and rows. (Scale bar: 30 μm.) (E) Efficiency of single-cell trapping according to different column and row spacing in the trap array. Error bars represent the SD of four independent tests.
Fig. S3.
Fig. S3.
Images of different trap arrays using different column and row spacing in the HYAA-Chip. The spacing shown is as follows: (A) 6-μm column and 12-μm row; (B) 6-μm column and 18-μm row; (C) 12-μm column and 12-μm row; (D) 12-μm column and 18-μm row; (E) 18-μm column and 12-μm row; and (F) 18-μm column and 18-μm row. (Scale bars: 100 μm.)
Fig. 2.
Fig. 2.
Tracking the complete lifespan of trapped yeast cells. (A) Time course of the aging process from young mother until death for a single cell in the trap. Times given in each image indicate the culture duration of the trapped mother cell. (Scale bar: 10 μm.) (B) Retention rate of the initially trapped single yeast cells throughout the 96-h duration of five independent experiments. Average retention rate at the 96-h duration was 90.94 ± 1.2%. (C) Replicative lifespan analyses of WT, sir2Δ, and fob1Δ strains. Average lifespans: WT, 25.76 divisions (n = 458); sir2Δ, 13.32 divisions (n = 423); fob1Δ, 33.88 divisions (n = 474). Detailed statistical data are shown in Table S3. (D) The high-throughput replicative lifespan assay of 12 single-gene deletion mutations previously reported to affect lifespan. Percent change of average replicative lifespan for each mutation strain relative to experiment-matched wild-type cells for our test results, using the HYAA-Chip and the literature findings using the conventional microdissection method, is shown. More detailed data are shown in Table S2.
Fig. S4.
Fig. S4.
Comparison of yeast replicative lifespan measurements. (A) HYAA-Chip lifespan assay. (B) Conventional manual microdissection lifespan assay. More detailed data are shown in Table S1.
Fig. S5.
Fig. S5.
Reproducibility of the HYAA-Chip lifespan assay in WT cells. Each bar represents an average value of five independent RLS assays using the HYAA-Chip. Mean replicative lifespan, 24.74 ± 0.64 divisions; median replicative lifespan, 25.1 ± 1.28 divisions; maximum replicative lifespan, 45 ± 2.12 divisions.
Fig. S6.
Fig. S6.
Comparison of cell-cycle times in the WT, sir2Δ, and fob1Δi strains. The length of the last division before cell death was 180.4 ± 12.3 min for WT, 145.1 ± 10.9 min for the sir2Δ mutant, and 289.3 ± 115.8 min for the fob1Δ mutant. Data represent the average and SD.
Fig. S7.
Fig. S7.
Rate of cell size increase throughout the entire lifespan of budding yeast. Cell size increased gradually and then more dramatically as the cells reached senescence. An 81.3% increase in cell size was observed during the last four divisions.
Fig. S8.
Fig. S8.
Comparison of RLS between 12 single-gene deletion mutants. The 12 single-gene mutations previously reported to alter replicative lifespan were tested simultaneously within a single experiment using the HYAA-Chip. As an experiment-matched control, a WT strain was also tested with the mutations in the same experiment.
Fig. 3.
Fig. 3.
Effects of calorie restriction on aging. (A) Lifespan analyses of WT and sir2Δfob1Δ double mutant in SC media supplemented with 2, 0.5, and 0.05% glucose. Average lifespans for WT: 24.16 divisions for 2% (wt/vol) glucose (n = 222), 29.41 divisions for 0.5% glucose (n = 252), and 34.37 divisions for 0.05% glucose (n = 260). Average lifespans for sir2Δfob1Δ: 25.2 divisions for 2% (wt/vol) glucose (n = 212), 31.92 divisions for 0.5% glucose (n = 235), and 39.22 divisions for 0.05% glucose (n = 251). Detailed statistical data are shown in Table S3. (B) Percent change of average RLS by CR for WT and sir2Δfob1Δ double mutant relative to the experiment-matched 2% (wt/vol) glucose condition. WT: 21.73% for 0.5% glucose and 42.26% for 0.05% glucose; sir2Δfob1Δ: 26.67% for 0.5% glucose and 55.63% for 0.05% glucose.
Fig. S9.
Fig. S9.
Effects of calorie restriction on cell-cycle time. Comparison of cell-cycle times (average ± SD) for 2, 0.5, and 0.05% glucose for the WT strain. Last cell-cycle time before death: 2% (wt/vol) glucose, 187.6 ± 15.4 min; 0.5% glucose, 208.7 ± 13.1 min; 0.05%, 231.1 ± 16.3 min.
Fig. S10.
Fig. S10.
Lower retention rate of mother cells trapped in a microfluidic system could prevent accurate and reliable measurement of replicative lifespan. (A) RLS curves for various CR conditions based on raw data published by Huberts et al. (33). Only retained cells tracked throughout their entire lifespan were analyzed for the lifespan curve [n = 397 cells for 2% (wt/vol) glucose, excluding 2,409 cells washed out during the experiment; n = 221 cells for 0.5% glucose, excluding 1,154 cells washed out during the experiment; n = 151 cells for 0.25% glucose, excluding 450 cells washed out during the experiment; n = 114 cells for 0.1% glucose, excluding 472 cells washed out during the experiment; n = 175 cells for 0.05% glucose, excluding 476 cells washed out during the experiment]. (B) Detailed comparison with the previously published data (33).
Fig. 4.
Fig. 4.
Critical cell size can be a marker for longevity in the budding yeast. (A and B) Time-course images of a cell show growth to the critical size for initiation of budding. Times given in each image indicate the culture duration of the trapped mother cell. The cell began dividing with a (A) relatively smaller critical size, resulting in a relatively longer lifespan of 23 generations. When the cell began dividing with a (B) relatively larger critical size, the lifespan was shorter, consisting of only eight generations. (Scale bar: 10 μm.) (C) Correlation between the critical cell size and lifespan. The red line indicates a linear regression of the correlation (n = 270, R2 = 0.7185). (D) Critical cell size of WT strain grown in 2, 0.5, and 0.05% (wt/vol) glucose in SC media and the fob1Δ strain grown in 2% (wt/vol) glucose. Average critical cell sizes: WT 2% (wt/vol) glucose, 5.85 μm (n = 215); WT 0.5% glucose, 4.96 μm (n = 220); WT 0.05% glucose, 4.39 μm (n = 237); fob1Δ 2% (wt/vol) glucose, 5.17 μm (n = 232). Asterisks indicate statistically significant differences (P < 0.0001) compared with WT grown in 2% (wt/vol) glucose in SC medium. Detailed statistical data are shown in Table S3.
Fig. 5.
Fig. 5.
Characterization of terminal morphology in aging cells. (A) Example images of three different terminal morphologies: the unbudded, round-budded, and elongated-budded states. (Scale bar: 10 μm.) (B–D) Lifespan of cells that arrested in the unbudded and budded (round-budded and elongated-budded) states for (B) WT (n = 418), (C) sir2Δ (n = 407), and (D) fob1Δ (n = 440). (E) Proportion of cells arrested in the three states for the WT, sir2Δ, and fob1Δ strains.
Fig. 6.
Fig. 6.
Tracking protein subcellular localization of trapped yeast cells during aging. (Upper) Time-course images of GFP showing nucleolus localization of GFP-tagged Nop56 from young mother until death for a single cell in the trap. (Lower) The corresponding merged images of GFP and bright-field. The numbers given in each GFP image indicate the generation of the trapped mother cell.
Fig. S11.
Fig. S11.
Tracking protein subcellular localization of trapped yeast cells during aging. (Upper) Time-course images of GFP showing vacuole localization of GFP-tagged Vma1 from young mother until death for a single cell in the trap. (Lower) The corresponding merged images of GFP and bright-field. The numbers given in each GFP image indicate the generation of the trapped mother cell.
Fig. S12.
Fig. S12.
Representative images of protein subcellular localization that was tracked with the HYAA-Chip during aging. Chc1, Erg6, Sac6, and Tom70 are well-characterized markers for late Golgi, lipid particle, actin, and mitochondria, respectively.

Similar articles

Cited by

References

    1. López-Otín C, Blasco MA, Partridge L, Serrano M, Kroemer G. The hallmarks of aging. Cell. 2013;153(6):1194–1217. - PMC - PubMed
    1. Braun RJ, Büttner S, Ring J, Kroemer G, Madeo F. Nervous yeast: Modeling neurotoxic cell death. Trends Biochem Sci. 2010;35(3):135–144. - PubMed
    1. Bleackley MR, Macgillivray RTA. Transition metal homeostasis: From yeast to human disease. Biometals. 2011;24(5):785–809. - PubMed
    1. Pfau SJ, Amon A. Chromosomal instability and aneuploidy in cancer: From yeast to man. EMBO Rep. 2012;13(6):515–527. - PMC - PubMed
    1. Miller RA. Extending life: Scientific prospects and political obstacles. Milbank Q. 2002;80(1):155–174. - PMC - PubMed

Publication types