. 2015 Jul 1:8:329-37.
doi: 10.2147/CCID.S83857. eCollection 2015.

Topically applied ceramide accumulates in skin glyphs

Affiliations

Topically applied ceramide accumulates in skin glyphs

Qihong Zhang et al. Clin Cosmet Investig Dermatol. .

Abstract

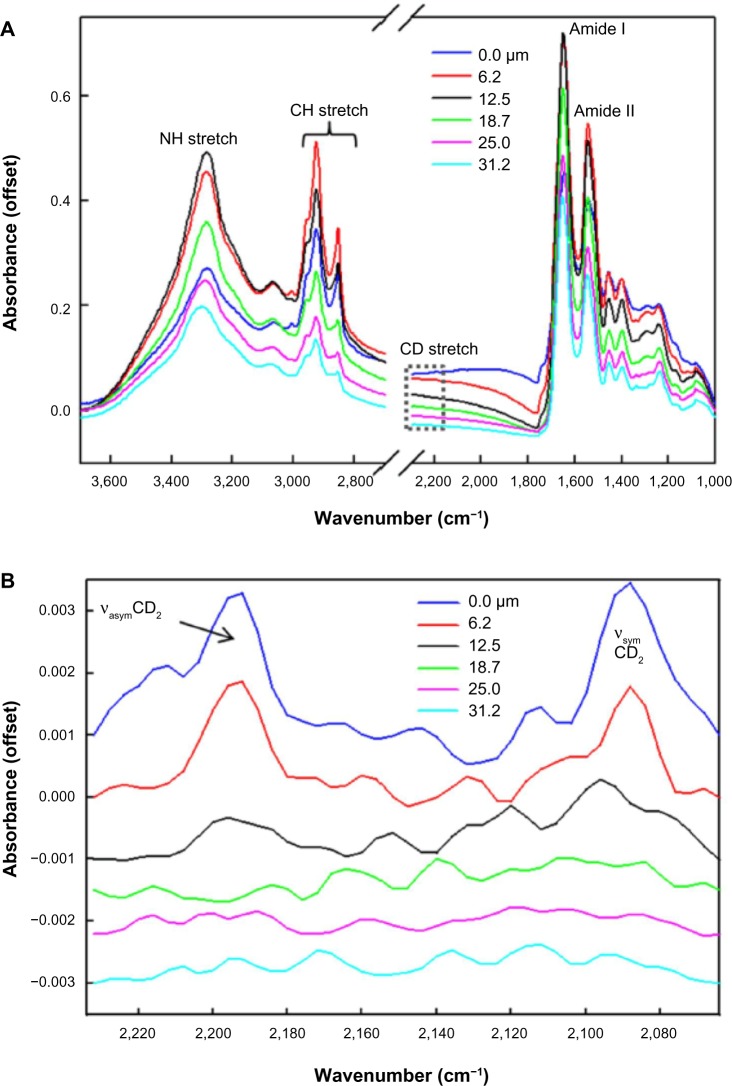
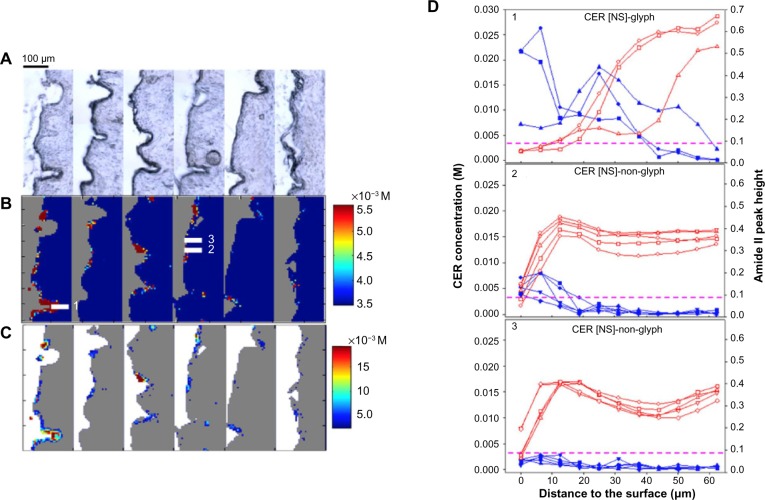
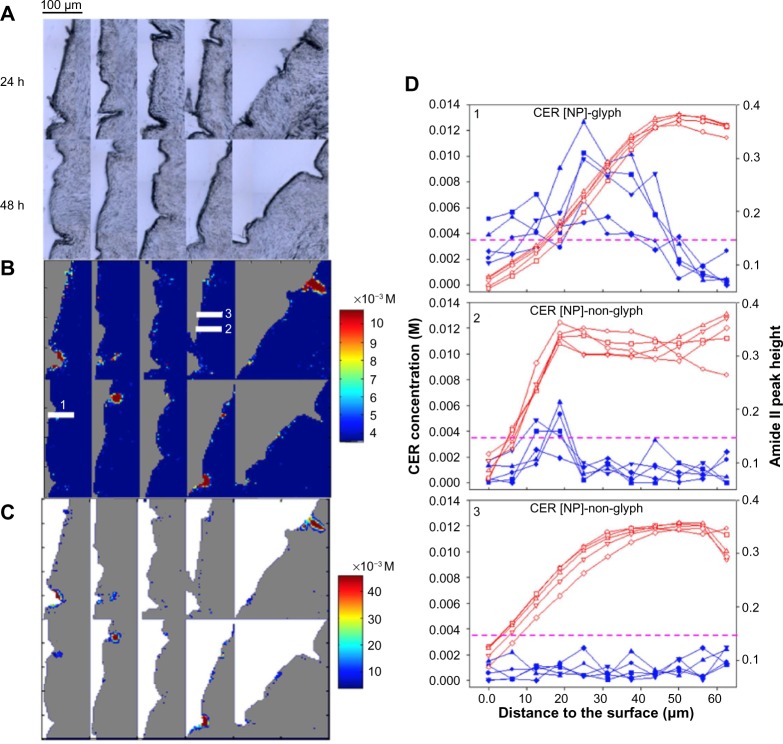
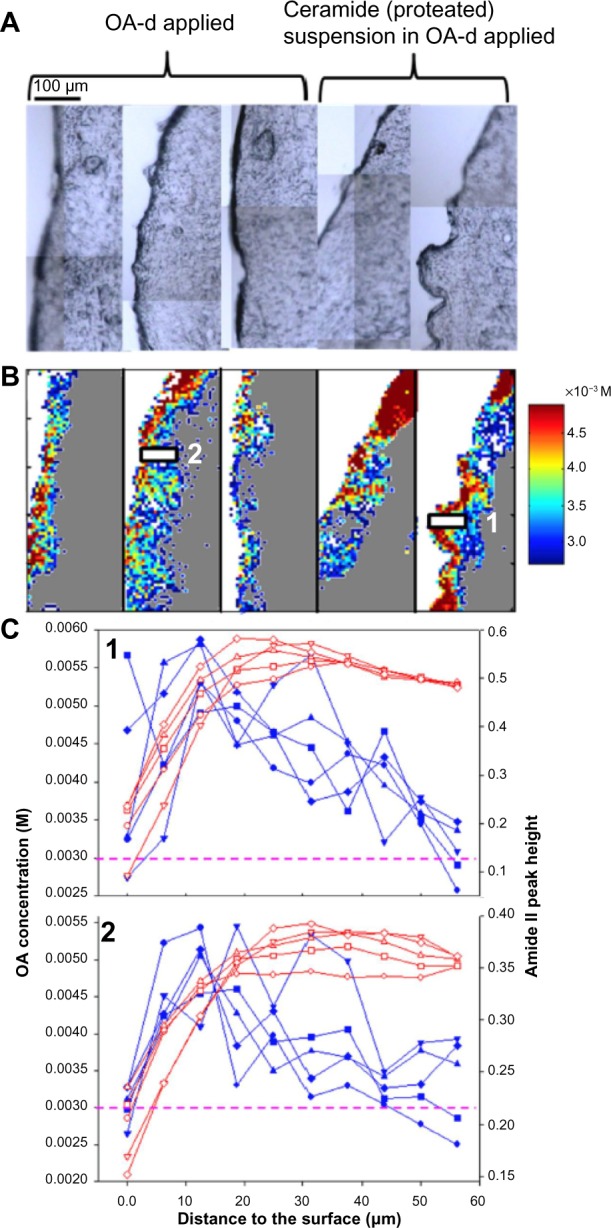
Ceramides (CERs), structural components of the stratum corneum (SC), impart essential barrier properties to this thin outer layer of the epidermis. Variations in CER species within this layer have been linked to several skin diseases. A recent proliferation of CER-containing topical skin-care products warrants the elucidation of CER penetration profiles in both healthy and diseased skin. In the current study, the spatial distributions of CER concentration profiles, following topical application of two species of CER, were tracked using infrared imaging. Suspensions of single-chain perdeuterated sphingosine and phytosphingosine CER in oleic acid were applied, in separate experiments, to the surface of healthy intact ex vivo human skin using Franz diffusion cells. Following either a 24- or 48-hour incubation period at 34°C, infrared images were acquired from microtomed skin sections. Both CER species accumulated in glyph regions of the skin and penetrated into the SC, to a limited extent, only in these regions. The concentration profiles observed herein were independent of the CER species and incubation time utilized in the study. As a result, a very heterogeneous, sparse, spatial distribution of CERs in the SC was revealed. In contrast, oleic acid was found to be fairly homogeneously distributed throughout the SC and viable epidermis, albeit at lower concentrations in the latter. A more uniform, lateral distribution of CERs in the SC would likely be important for barrier efficacy or enhancement.

Keywords: infrared imaging; oleic acid; stratum corneum; topical delivery.


Figures

Figure 1
Figure 1
(A) Typical single-pixel infrared spectra of N-palmitoyl-D-erythro-sphingosine (CER[NS]-d31) at different depths in skin. (B) The CD2 stretching region (2,234–2,064 cm−1) is highlighted at the same depths in A. This spectral region is baseline corrected.
Figure 2
Figure 2
Spatial distribution and concentration of N-palmitoyl-D-erythro-sphingosine (CER [NS]-d31) penetration in skin. (A) Visible micrographs of microtomed skin sections (stratum corneum [SC] on the left side of each section). (B) Infrared (IR) images (of the same sections) of CER [NS]-d31 concentration. The concentration range of 3.5–5.5×10⁻³ M is shown to highlight the distribution of CER [NS]-d31. The area outside the skin is shown in gray. (C) IR images of CER [NS]-d31 concentration above detection limit (±1 standard deviation). The concentration below the detection limit is shown in gray. The area outside the skin is shown in white. (D) Line plots of ceramide concentration and Amide II peak height were compared between glyph and non-glyph regions labeled in B; three to five adjacent lines of pixels are shown. Notes: Blue lines and symbols: ceramide concentration; red lines and symbols: Amide II peak height. Magenta dash lines indicate the detection limit of 3.5×10⁻³ M of CER. Scale bar is 100 µm. Abbreviation: CER, ceramide.
Figure 3
Figure 3
(A) Visible image of a skin section with a deep, broad glyph. (B) Infrared image of the N-palmitoyl-D-erythro-sphingosine (CER [NS]-d31) concentration profile for the same section. (C) Concentration image of the region marked with the white box in B, enlarged and rotated clockwise, along with color-coded lines highlighting the pixels from which the line plots in D originate. (D) Line plots of CER [NS]-d31 concentration and Amide II peak height as marked in C. Notes: Closed symbol: CER [NS]-d31 concentration; open symbol: Amide II peak height. Cyan dashed line indicates the surface of the SC (Amide II peak height ~0.2 AU). Scale bar is 100 µm. Abbreviation: SC, stratum corneum.
Figure 4
Figure 4
Spatial distribution and concentration of N-palmitoyl-D-erythro-phytosphingosine (CER [NP]-d31) penetration in skin. (A) Visible micrographs of microtomed skin sections (stratum corneum on the left side of each section) for 24- and 48-hour incubation periods. (B) Infrared (IR) images (of the same sections) of CER [NP]-d31 concentration. The concentration range of 3.5–10.7×10⁻³ M is shown to highlight the distribution of CER [NP]-d31. The area outside the skin is shown in gray. (C) IR images of CER [NP]-d31 concentration above the detection limit (±1 standard deviation). The concentration below the detection limit is shown in gray. Area outside the skin is shown in white. (D) Line plots of ceramide concentration and Amide II peak height were compared between glyph and non-glyph regions as labeled in B for five adjacent lines of pixels. Notes: Blue: ceramide concentration; red: Amide II peak height. Magenta dashed lines indicate the detection limit of 3.5×10⁻³ M. Scale bar is 100 µm.
Figure 5
Figure 5
(A) Visible micrographs of control skin sections for two different treatments as labeled. (B) Infrared images of acyl chain perdeuterated oleic acid (OA-d) concentration and distribution in skin for the same sections. (C) Line plots of OA-d concentration and Amide II peak height were compared between the two controls as labeled in B (five adjacent lines of pixels). Notes: Blue: OA-d concentration; red: Amide II peak height. Magenta dashed lines indicate the detection limit of 3.0×10⁻³ M of OA-d. Scale bar is 100 µm.

References

    1. Huwiler A, Kolter T, Pfeilschifter J, Sandhoff K. Physiology and pathophysiology of sphingolipid metabolism and signaling. Biochim Biophys Acta. 2000;1485(2–3):63–99. - PubMed
    1. Bouwstra JA, Ponec M. The skin barrier in healthy and diseased state. Biochim Biophys Acta. 2006;1758(12):2080–2095. - PubMed
    1. Imokawa G, Abe A, Jin K, Higaki Y, Kawashima M, Hidano A. Decreased level of ceramides in stratum corneum of atopic dermatitis: an etiologic factor in atopic dry skin? J Invest Dermatol. 1991;96(4):523–526. - PubMed
    1. Motta S, Monti M, Sesana S, Mellesi L, Ghidoni R, Caputo R. Abnormality of water barrier function in psoriasis. Role of ceramide fractions. Arch Dermatol. 1994;130(4):452–456. - PubMed
    1. van Smeden J, Janssens M, Gooris GS, Bouwstra JA. The important role of stratum corneum lipids for the cutaneous barrier function. Biochim Biophys Acta. 2014;1841(3):295–313. - PubMed