. 2015 Jun 24;7(1):55.
doi: 10.1186/s13073-015-0177-8. eCollection 2015.

Virulence genes are a signature of the microbiome in the colorectal tumor microenvironment

Affiliations

Virulence genes are a signature of the microbiome in the colorectal tumor microenvironment

Michael B Burns et al. Genome Med. .

Abstract

Background: The human gut microbiome is associated with the development of colon cancer, and recent studies have found changes in the microbiome in cancer patients compared to healthy controls. Studying the microbial communities in the tumor microenvironment may shed light on the role of host-bacteria interactions in colorectal cancer. Here, we highlight the major shifts in the colorectal tumor microbiome relative to that of matched normal colon tissue from the same individual, allowing us to survey the microbial communities in the tumor microenvironment and providing intrinsic control for environmental and host genetic effects on the microbiome.

Methods: We sequenced the microbiome in 44 primary tumor and 44 patient-matched normal colon tissue samples to determine differentially abundant microbial taxa These data were also used to functionally characterize the microbiome of the cancer and normal sample pairs and identify functional pathways enriched in the tumor-associated microbiota.

Results: We find that tumors harbor distinct microbial communities compared to nearby healthy tissue. Our results show increased microbial diversity in the tumor microenvironment, with changes in the abundances of commensal and pathogenic bacterial taxa, including Fusobacterium and Providencia. While Fusobacterium has previously been implicated in colorectal cancer, Providencia is a novel tumor-associated agent which has not been identified in previous studies. Additionally, we identified a clear, significant enrichment of predicted virulence-associated genes in the colorectal cancer microenvironment, likely dependent upon the genomes of Fusobacterium and Providencia.

Conclusions: This work identifies bacterial taxa significantly correlated with colorectal cancer, including a novel finding of an elevated abundance of Providencia in the tumor microenvironment. We also describe the predicted metabolic pathways and enzymes differentially present in the tumor-associated microbiome, and show an enrichment of virulence-associated bacterial genes in the tumor microenvironment. This predicted virulence enrichment supports the hypothesis that the microbiome plays an active role in colorectal cancer development and/or progression. Our results provide a starting point for future prognostic and therapeutic research with the potential to improve patient outcomes.


Figures
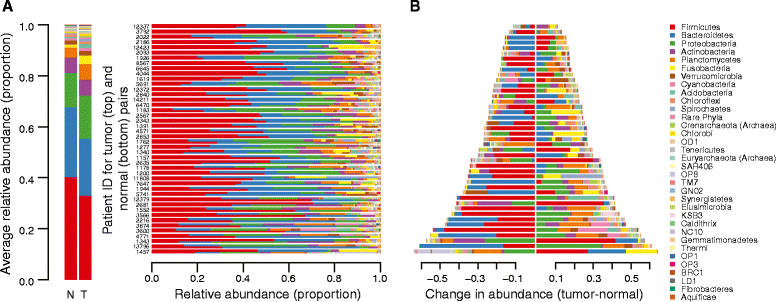
Fig. 1
Fig. 1
Differences in bacterial and archaeal phyla within the normal and colorectal cancer microbiomes. a Stacked bar plots indicating the proportional abundances of microbial phyla that are present at ≥1 % in at least one sample. The averages across all normal samples (N) and tumor samples (T) are presented at the left. Rows are arranged as patient-matched tumor (top) and normal (bottom) pairs. Patient ID numbers are appended to the right of the row pairs. b The data in panel (a) presented as the difference in abundance (Tumor – Normal) for each phylum, sorted in the same patient order, where a value of 0 would indicate no difference. Note that the legend at the right is common to panels (a) and (b)
Fig. 2
Fig. 2
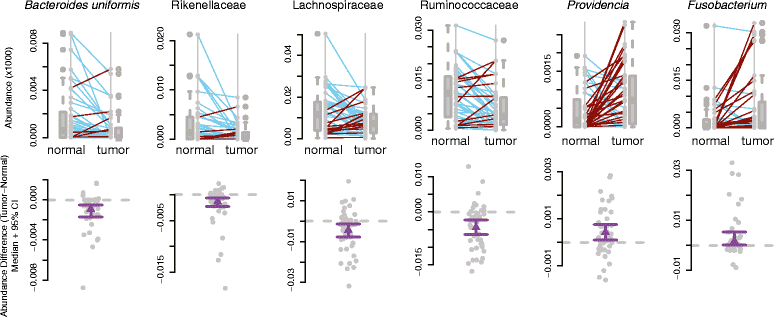
Differentially abundant taxa between matched normal and colorectal cancer microbiomes. Boxplots with corresponding paired dotplots indicating the relative abundances of several taxa showing differential abundance between tumor and normal samples. Lines connect the abundance in the normal (left) and tumor sample (right). Line colors indicate the directionality of the abundance change (blue and red for decreased and increased abundance in the tumor relative to the normal, respectively). Below we plot the difference between the tumor and normal abundance as grey dots, with the purple line representing the 95 % confidence (95 % CI) interval and the mean. Values at 0 (grey dotted lines) represent no change between normal and tumor
Fig. 3
Fig. 3
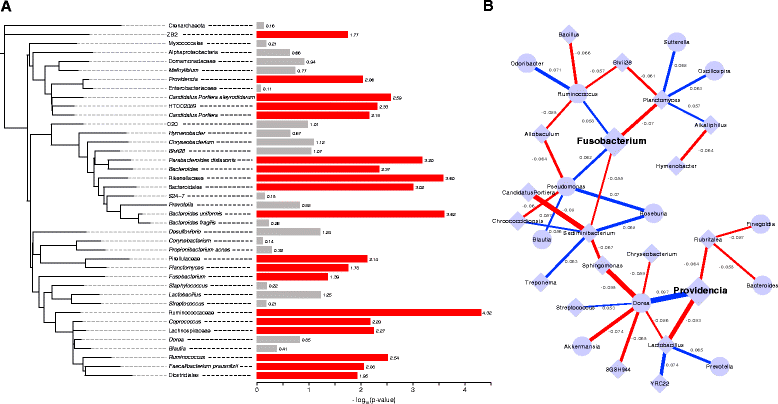
Relationships among the taxa found in colorectal cancer patients’ microbiomes. a Phylogenetic tree depicting the relatedness of the bacterial taxa present (>0.1 % of total) within 50 % or more of the samples. The bars to the right indicate the –log10(p value) from the Wilcoxon signed rank test to determine differential abundance between the normal and tumor microbiomes. Red bars indicate significance at 10 % FDR, while gray bars indicate that the specific taxon did not reach significance. b Correlation network showing the relationship among the abundances of genera with absolute values of 0.05 or more and statistical significance (pseudo p value <0.05). Edges indicate correlations: the edge thickness represents the magnitude and the color represents the sign (blue is positive correlation, red is negative correlation). Each node is a microbial genus where diamond shaped nodes indicate a higher average abundance and circular nodes indicate a lower average abundance in the tumor microbiome compared with normal
Fig. 4
Fig. 4
Differences in metabolic (KEGG) pathways within the normal and colorectal cancer microbiomes. a Stacked bar plots indicating the proportional abundances of metabolic pathways present at ≥1 % in at least one sample. The averages across all normal samples (N) and tumor samples (T) are presented at the left. Rows are arranged as patient-matched tumor (top) and normal (bottom) pairs. Patient ID numbers are appended to the right of the row pairs. b The data from panel (a), presented as the difference in abundance (Tumor – Normal) for each phylum, sorted in the same patient order, where a value of 0 would indicate no difference. Note that the legend at the right is common to panels (a) and (b)
Fig. 5
Fig. 5
Differentially abundant pathways and enzyme classes between matched normal and colorectal tissue microbiomes. a Boxplots with corresponding paired dotplots indicating the relative abundances of several pathways showing differential abundance between tumor and normal samples. Lines connect the abundance in the normal (left) and tumor sample (right). Line colors indicate the directionality of the abundance change (blue and red for decreased and increased abundance in the tumor relative to the normal, respectively). Below we plot the difference between the tumor and normal abundance as grey dots, with the purple line representing the 95 % confidence interval (95 % CI) and the mean. Values at 0 (grey dotted lines) represent no change between normal and tumor. b Barchart showing the p values (−log10 transformed) obtained from Fisher’s exact test used to determine virulence category enrichment in the tumor-associated microbiome on the x-axis with the gene categories labeled on the y-axis. Red bars indicate significance by Fisher’s exact test (p < 0.005) and gray bars indicate no statistical significance. The blue dashed line indicates the standard significance cutoff of p = 0.05. c Barchart from the analysis in panel (b), demonstrating the fold-enrichment of virulence protein-encoding genes in the tumor-associated microbiome. The x-axis is the fold enrichment of the different virulence enzyme classes within the tumor microbiome relative to the normal microbiome. The vertical blue dotted line placed at 1 indicates the point where there is no difference between the normal and tumor microbiomes. d Venn diagram indicating the numbers of shared virulence-associated genes among Providencia, Fusobacterium, and the set of statistically significantly increased abundance genes at the tumor

References

    1. Jemal A, Bray F, Center MM, Ferlay J, Ward E, Forman D. Global cancer statistics. CA Cancer J Clin. 2011;61:69–90. doi: 10.3322/caac.20107. - DOI - PubMed
    1. The Human Microbiome Consortium Structure, function and diversity of the healthy human microbiome. Nature. 2012;486:207–214. doi: 10.1038/nature11234. - DOI - PMC - PubMed
    1. Jones ML, Ganopolsky JG, Martoni CJ, Labbé A, Prakash S. Emerging science of the human microbiome. Gut Microbes. 2014;5:446–457. doi: 10.4161/gmic.29810. - DOI - PubMed
    1. Konstantinov SR, Kuipers EJ, Peppelenbosch MP. Functional genomic analyses of the gut microbiota for CRC screening. Nat Rev Gastroenterol Hepatol. 2013;10:741–745. doi: 10.1038/nrgastro.2013.178. - DOI - PubMed
    1. Sobhani I, Tap J, Roudot-Thoraval F, Roperch JP, Letulle S, Langella P, et al. Microbial dysbiosis in colorectal cancer (CRC) patients. PLoS One. 2011;6 doi: 10.1371/journal.pone.0016393. - DOI - PMC - PubMed