Review
. 2015 Jun;3(3):e00149.
doi: 10.1002/prp2.149. Epub 2015 May 20.

Analysis of drug combinations: current methodological landscape

Affiliations
Review

Analysis of drug combinations: current methodological landscape

Julie Foucquier et al. Pharmacol Res Perspect. 2015 Jun.

Erratum in

  • Corrigendum.
    [No authors listed] [No authors listed] Pharmacol Res Perspect. 2019 Dec;7(6):e00549. doi: 10.1002/prp2.549. Pharmacol Res Perspect. 2019. PMID: 31859462 Free PMC article. No abstract available.

Abstract

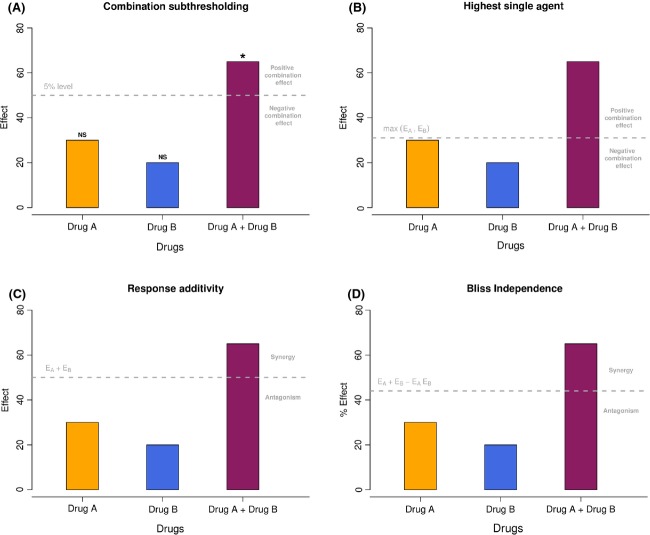
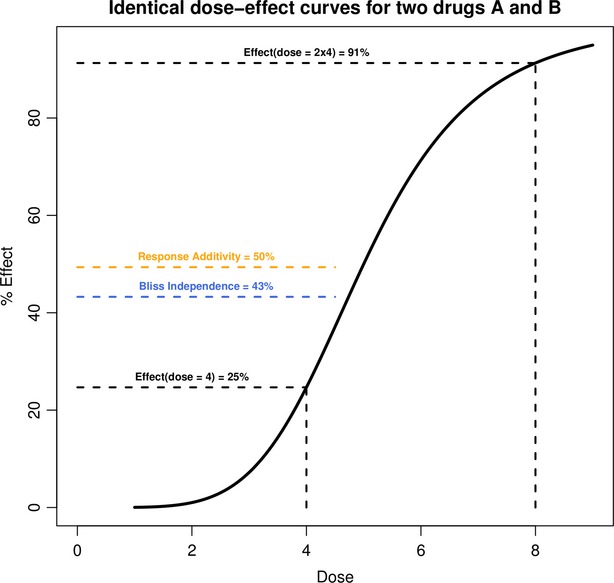
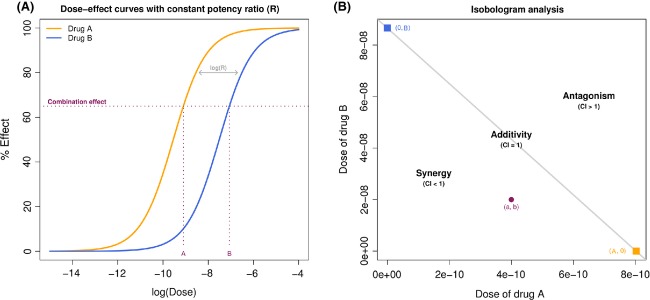
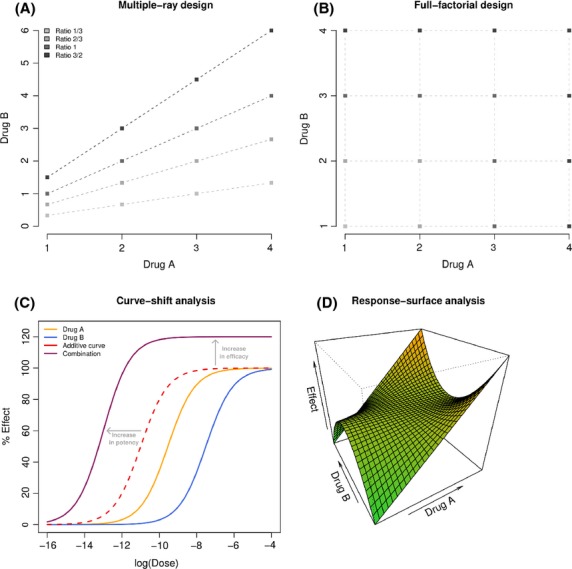
Combination therapies exploit the chances for better efficacy, decreased toxicity, and reduced development of drug resistance and owing to these advantages, have become a standard for the treatment of several diseases and continue to represent a promising approach in indications of unmet medical need. In this context, studying the effects of a combination of drugs in order to provide evidence of a significant superiority compared to the single agents is of particular interest. Research in this field has resulted in a large number of papers and revealed several issues. Here, we propose an overview of the current methodological landscape concerning the study of combination effects. First, we aim to provide the minimal set of mathematical and pharmacological concepts necessary to understand the most commonly used approaches, divided into effect-based approaches and dose-effect-based approaches, and introduced in light of their respective practical advantages and limitations. Then, we discuss six main common methodological issues that scientists have to face at each step of the development of new combination therapies. In particular, in the absence of a reference methodology suitable for all biomedical situations, the analysis of drug combinations should benefit from a collective, appropriate, and rigorous application of the concepts and methods reviewed here.

Keywords: Bliss; combination index; drug combination; loewe; synergy.


Figures

Figure 1
Figure 1
Illustration of the four effect-based approaches. (A) Combination Subthresholding, (B) Highest Single Agent, (C), Response Additivity, and (D) Bliss Independence. Based on EA = 30, EB = 20, and EAB = 65. NS, Nonsignificant; *, Significant at the 5% level.
Figure 2
Figure 2
Possible inconsistency in assessing drug synergy based on Response Additivity or Bliss Independence. Identical simulated dose–effect curve for two different drugs. Suppose that a dose = 4 of drug A results in 25% of effect, likewise for drug B. From Response Additivity, one would conclude in synergism with a combination effect above 50%. From Bliss Independence, one would conclude in synergism with a combination effect above 43%. However, note that either a dose = 2 × 4 = 8 of drug A or of drug B alone brings the effect up to 91%. Therefore, a total of dose = 8 of the hypothetical combined drug elicits less effect under Response Additivity or Bliss Independence than the same dose of either drug alone, yet one would conclude synergism.
Figure 3
Figure 3
Illustration of the Loewe Additivity. (A) Dose–effect curves for two drugs A and B (here with constant potency ratio R) allow estimation of the single doses AE and BE reaching the combination effect E produced by the combination of doses a of drug A and b of drug B. (B) Isobologram analysis at the combination effect E. The single doses AE and BE are used to draw the line of additivity. The localization of the experimental point (a, b) corresponding to the doses actually needed for a combination effect E with respect to the line of additivity can be translated in term of synergy, additivity, and antagonism.
Figure 4
Figure 4
Optimizing dose ratio. (A) Multiple-ray design exploring 16 combinations (4 ratios × 4 doses). (B) Full factorial design exploring 16 combinations (4 × 4 doses). (C) Curve-shift analysis. The dose–effect curve for a combination at a given ratio (in purple) is compared to the additive expectation (in red) which can illustrate synergy by both an increase in potency and/or an increase in efficacy relatively to the single agent responses. Additive and combination curves are represented as functions of the dose of the more potent drug (here drug A). (D) Response-surface analysis can provide a complete description of the combination effect over a large range of doses.

References

    1. Belen’kii MS, Schinazi RF. Multiple drug effect analysis with confidence interval. Antiviral Res. 1994;25:1–11. - PubMed
    1. Berenbaum M. Synergy, additivism and antagonism in immunosuppression - critical review. Clin Exp Immunol. 1977;28:1–18. - PMC - PubMed
    1. Berenbaum MC. A method for testing for synergy with any number of agents. J Infect Dis. 1978;137:122–130. - PubMed
    1. Berenbaum M. What is synergy? Pharmacol Rev. 1989;41:93–141. - PubMed
    1. Berthoud H-R. Synergy: a concept in search of a definition. Endocrinology. 2013;154:3974–3977. - PMC - PubMed