

The putative P-gp inhibitor telmisartan does not affect the transcellular permeability and cellular uptake of the calcium channel antagonist verapamil in the P-glycoprotein expressing cell line MDCK II MDR1
- PMID: 26171231
- PMCID: PMC4492727
- DOI: 10.1002/prp2.151
The putative P-gp inhibitor telmisartan does not affect the transcellular permeability and cellular uptake of the calcium channel antagonist verapamil in the P-glycoprotein expressing cell line MDCK II MDR1
Abstract
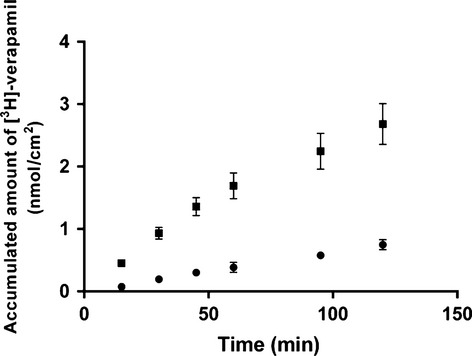
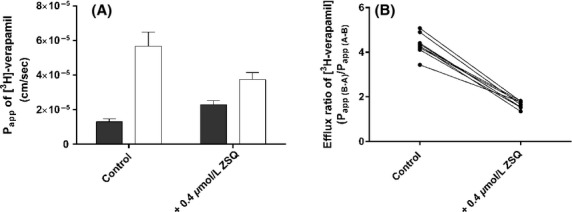
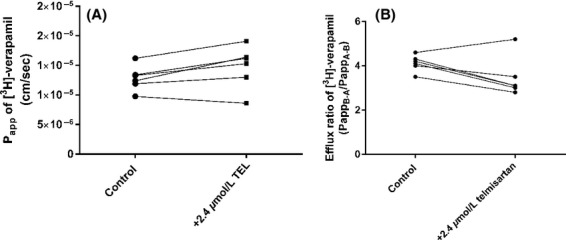
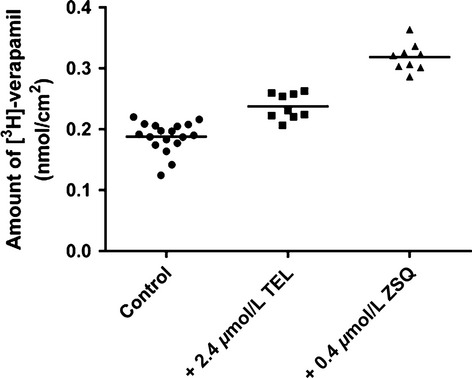
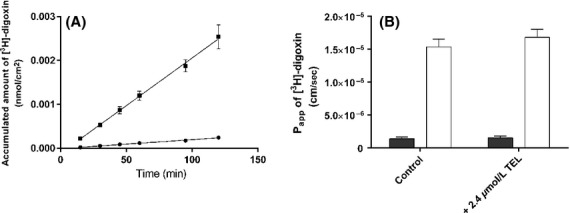
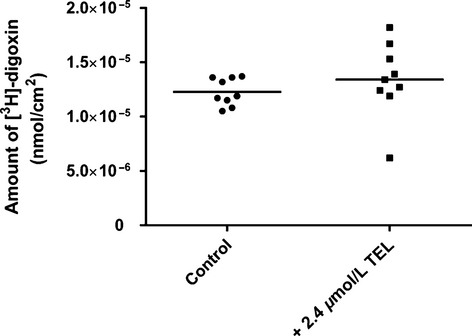
Verapamil is used in high doses for the treatment of cluster headache. Verapamil has been described as a P-glycoprotein (P-gp, ABCB1) substrate. We wished to evaluate in vitro whether co administration of a P-gp inhibitor with verapamil could be a feasible strategy for increasing CNS uptake of verapamil. Fluxes of radiolabelled verapamil across MDCK II MDR1 monolayers were measured in the absence and presence of the putative P-gp inhibitor telmisartan (a clinically approved drug compound). Verapamil displayed a vectorial basolateral-to-apical transepithelial efflux across the MDCK II MDR1 monolayers with a permeability of 5.7 × 10(-5) cm sec(-1) compared to an apical to basolateral permeability of 1.3 × 10(-5) cm sec(-1). The efflux could be inhibited with the P-gp inhibitor zosuquidar. Zosuquidar (0.4 μmol/L) reduced the efflux ratio (PB-A/PA-B) for verapamil 4.6-1.6. The presence of telmisartan, however, only caused a slight reduction in P-gp-mediated verapamil transport to an efflux ratio of 3.4. Overall, the results of the present in vitro approach indicate, that clinical use of telmisartan as a P-gp inhibitor may not be an effective strategy for increasing brain uptake of verapamil by co-administration with telmisartan.
Keywords: Blood–brain barrier; P-glycoprotein; cluster headache; telmisartan; verapamil.
Figures
Similar articles
-
Bidirectional transport of rhodamine 123 and Hoechst 33342, fluorescence probes of the binding sites on P-glycoprotein, across MDCK-MDR1 cell monolayers.J Pharm Sci. 2004 May;93(5):1185-94. doi: 10.1002/jps.20046. J Pharm Sci. 2004. PMID: 15067695
-
Screening novel CNS drug candidates for P-glycoprotein interactions using the cell line iP-gp: In vitro efflux ratios from iP-gp and MDCK-MDR1 monolayers compared to brain distribution data from mice.Eur J Pharm Biopharm. 2021 Dec;169:211-219. doi: 10.1016/j.ejpb.2021.10.006. Epub 2021 Oct 28. Eur J Pharm Biopharm. 2021. PMID: 34756975
-
P-Glycoprotein expression in human retinal pigment epithelium cell lines.Exp Eye Res. 2006 Jul;83(1):24-30. doi: 10.1016/j.exer.2005.10.029. Epub 2006 Mar 10. Exp Eye Res. 2006. PMID: 16530756
-
Characterization of the IPEC-J2 MDR1 (iP-gp) cell line as a tool for identification of P-gp substrates.Eur J Pharm Sci. 2018 Jan 15;112:112-121. doi: 10.1016/j.ejps.2017.11.007. Epub 2017 Nov 13. Eur J Pharm Sci. 2018. PMID: 29146563
-
In vitro concentration dependent transport of phenytoin and phenobarbital, but not ethosuximide, by human P-glycoprotein.Life Sci. 2010 Jun 5;86(23-24):899-905. doi: 10.1016/j.lfs.2010.04.008. Epub 2010 Apr 24. Life Sci. 2010. PMID: 20417647
Cited by
-
Y-320, a novel immune-modulator, sensitizes multidrug-resistant tumors to chemotherapy.Am J Transl Res. 2020 Feb 15;12(2):551-562. eCollection 2020. Am J Transl Res. 2020. PMID: 32194903 Free PMC article.
References
-
- Chang C, Bahadduri PM, Polli JE, Swaan PW, Ekins S. Rapid identification of P-glycoprotein substrates and inhibitors. Drug Metab Dispos. 2006;34:1976–1984. - PubMed
-
- Cho MJ, Thompson DP, Cramer CT, Vidmar TJ, Scieszka JF. The Madin Darby canine kidney (MDCK) epithelial cell monolayer as a model cellular transport barrier. Pharm Res. 1989;6:71–77. - PubMed
-
- Cohen AS, Matharu MS, Goadsby PJ. Electrocardiographic abnormalities in patients with cluster headache on verapamil therapy. Neurology. 2007;69:668–675. - PubMed
-
- Dantzig AH, Shepard RL, Cao J, Law KL, Ehlhardt WJ, Baughman TM, et al. Reversal of P-glycoprotein-mediated multidrug resistance by a potent cyclopropyldibenzosuberane modulator, LY335979. Cancer Res. 1996;56:4171–4179. - PubMed
LinkOut - more resources
Full Text Sources
Other Literature Sources
Miscellaneous
