

Peripheral chemoreceptors determine the respiratory sensitivity of central chemoreceptors to CO2 : role of carotid body CO2
- PMID: 26171601
- PMCID: PMC4594294
- DOI: 10.1113/JP270114
Peripheral chemoreceptors determine the respiratory sensitivity of central chemoreceptors to CO2 : role of carotid body CO2
Abstract
We asked if the type of carotid body (CB) chemoreceptor stimulus influenced the ventilatory gain of the central chemoreceptors to CO2 . The effect of CB normoxic hypocapnia, normocapnia and hypercapnia (carotid body PCO2 ≈ 22, 41 and 68 mmHg, respectively) on the ventilatory CO2 sensitivity of central chemoreceptors was studied in seven awake dogs with vascularly-isolated and extracorporeally-perfused CBs. Chemosensitivity with one CB was similar to that in intact dogs. In four CB-denervated dogs, absence of hyper-/hypoventilatory responses to CB perfusion with PCO2 of 19-75 mmHg confirmed separation of the perfused CB circulation from the brain. The group mean central CO2 response slopes were increased 303% for minute ventilation (V̇I)(P ≤ 0.01) and 251% for mean inspiratory flow rate (VT /TI ) (P ≤ 0.05) when the CB was hypercapnic vs. hypocapnic; central CO2 response slopes for tidal volume (VT ), breathing frequency (fb ) and rate of rise of the diaphragm EMG increased in 6 of 7 animals but the group mean changes did not reach statistical significance. Group mean central CO2 response slopes were also increased 237% for V̇I(P ≤ 0.01) and 249% for VT /TI (P ≤ 0.05) when the CB was normocapnic vs. hypocapnic, but no significant differences in any of the central ventilatory response indices were found between CB normocapnia and hypercapnia. These hyperadditive effects of CB hyper-/hypocapnia agree with previous findings using CB hyper-/hypoxia.We propose that hyperaddition is the dominant form of chemoreceptor interaction in quiet wakefulness when the chemosensory control system is intact, response gains physiological, and carotid body chemoreceptors are driven by a wide range of O2 and/or CO2 .
© 2015 The Authors. The Journal of Physiology © 2015 The Physiological Society.
Figures
 ,
,  and
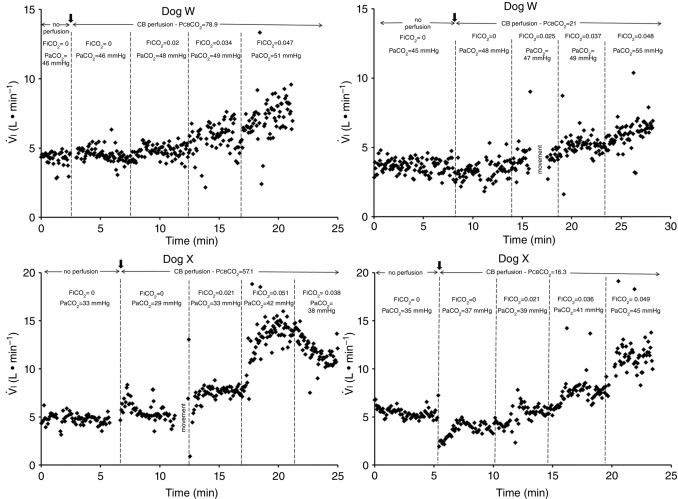
and  for each condition are indicated above each panel. Dog W (upper panels) showed limited response to CB hypo- or hypercapnic perfusion during air breathing. Dog X (lower panels) showed larger responses to CB hypo- or hypercapnic perfusion during air breathing. Note that in both dogs,(a) there was a transient hyper-or hypoventilation in response to CB hypercapnia and CB hypocapnia, respectively (filled arrow and vertical dashed line),(b) after the transient peak or nadir, partial ventilatory compensation occurred (between first two vertical dashed lines in each panel), and(c) the ventilatory responses to increased
  and systemic hypercapnia (last 3 sections in each panel) were greater in both dogs during CB hypercapnia vs. CB hypocapnia (compare right panel to left panel in each dog after the filled arrow and vertical dashed line).
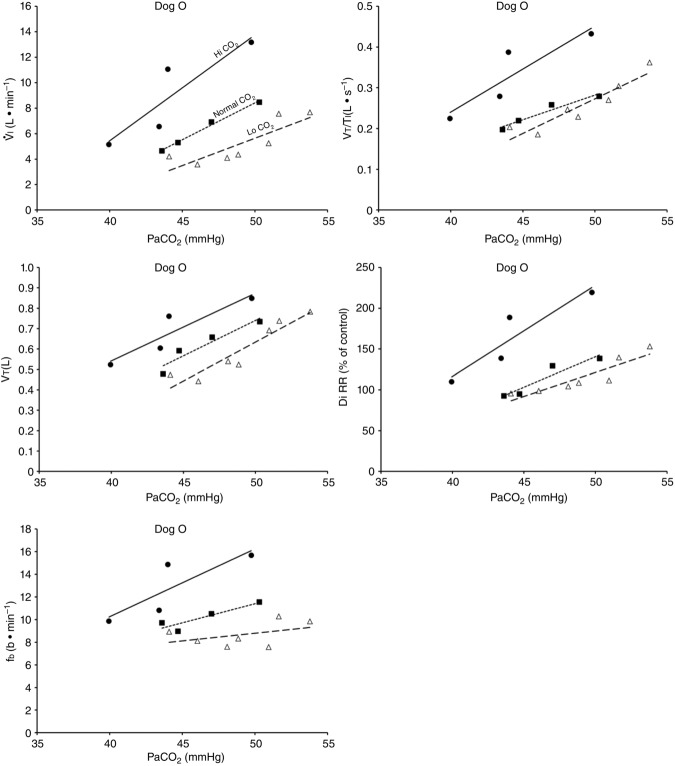
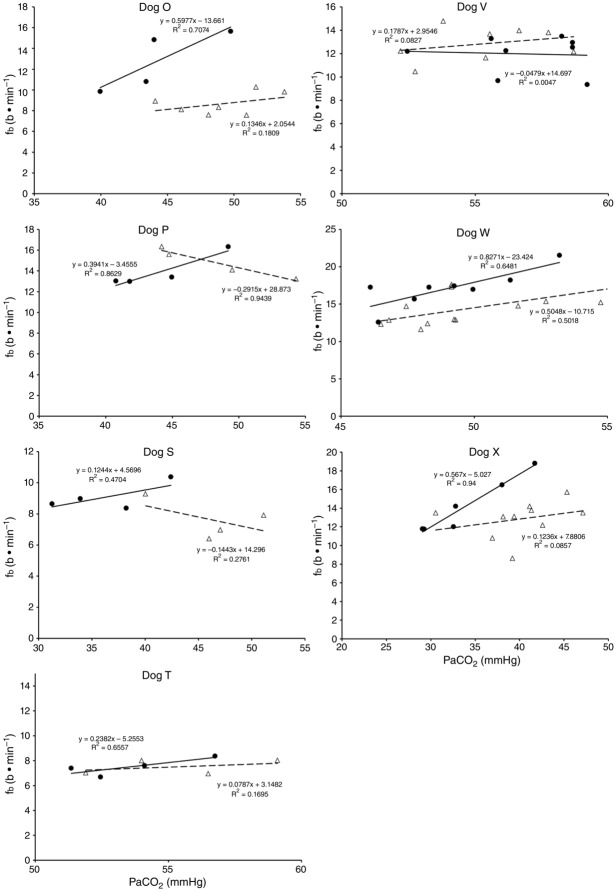
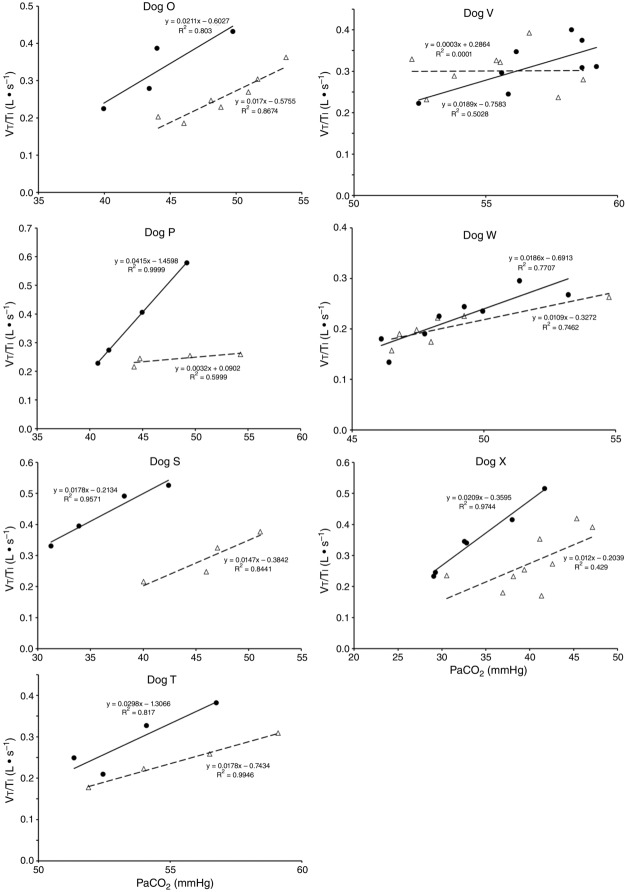
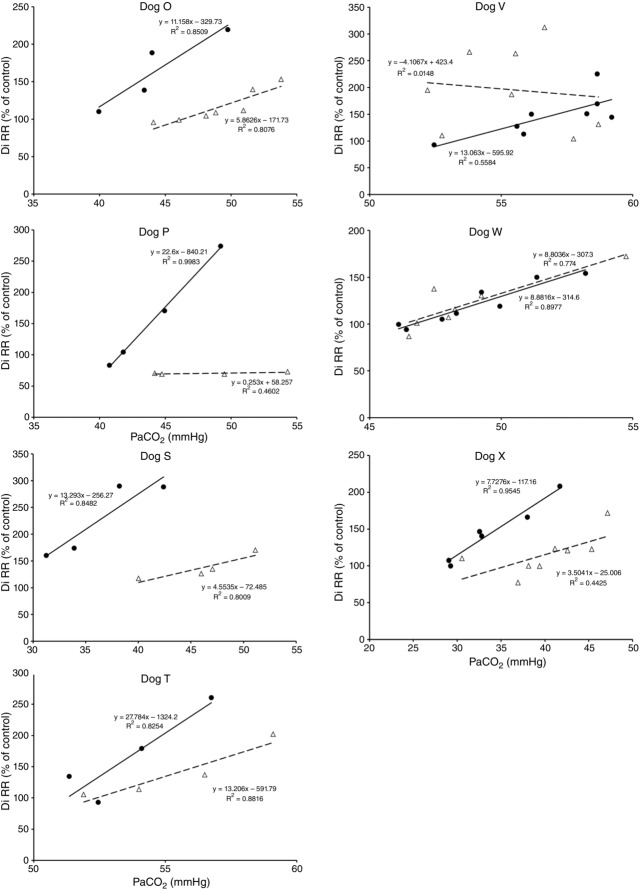
 = 39.2 mmHg), CB hypercapnic (
 = 73.4 mmHg) and CB hypocapnic (
 = 22.3 mmHg) perfusion in a representative dog. Lines are linear regressions.
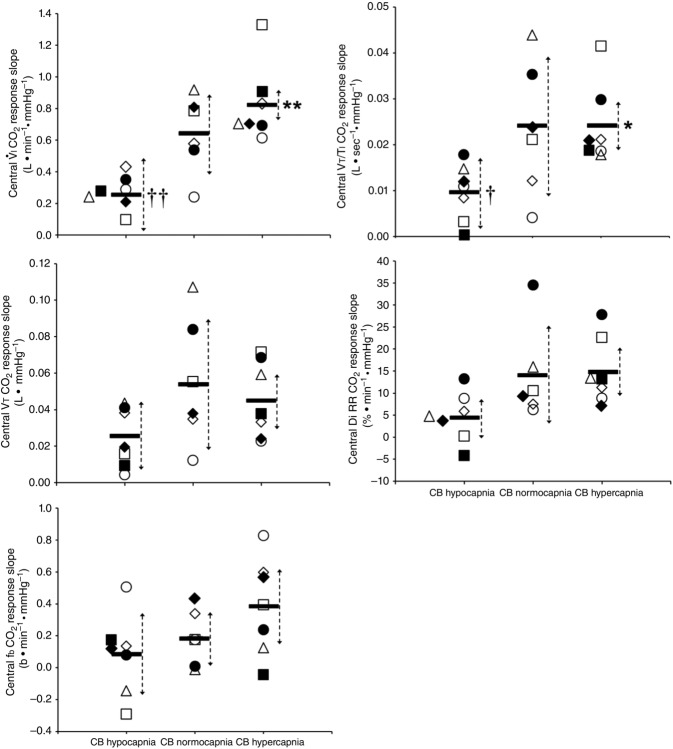
 = 22.3 ± 2.9 mmHg) and CB hypercapnia (
 = 68.2 ± 8.3 mmHg), n = 6 for CB normocapnia (
 = 41.1 ± 6.1 mmHg). (See text for details.)
 to increased F
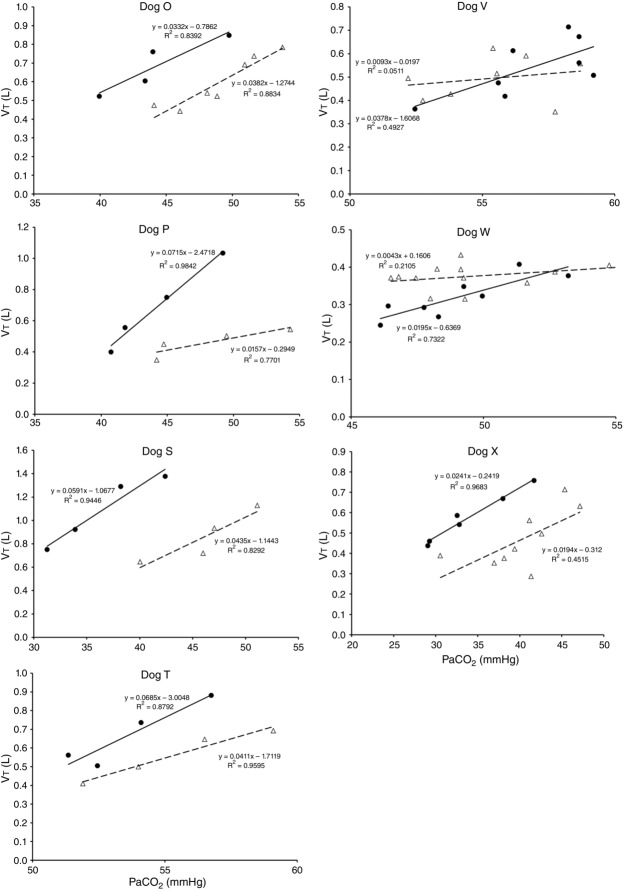
Comment in
-
The peripheral-central chemoreflex interaction: where do we stand and what is the next step?J Physiol. 2016 Mar 15;594(6):1527-8. doi: 10.1113/JP271901. J Physiol. 2016. PMID: 26995262 Free PMC article. No abstract available.
Similar articles
-
Central-peripheral chemoreceptor ventilatory interaction in awake goats.Respir Physiol. 1989 Jun;76(3):383-91. doi: 10.1016/0034-5687(89)90078-9. Respir Physiol. 1989. PMID: 2501845
-
Ventilatory effects of specific carotid body hypocapnia and hypoxia in awake dogs.J Appl Physiol (1985). 1997 Mar;82(3):791-8. doi: 10.1152/jappl.1997.82.3.791. J Appl Physiol (1985). 1997. PMID: 9074965
-
Response time and sensitivity of the ventilatory response to CO2 in unanesthetized intact dogs: central vs. peripheral chemoreceptors.J Appl Physiol (1985). 2006 Jan;100(1):13-9. doi: 10.1152/japplphysiol.00926.2005. Epub 2005 Sep 15. J Appl Physiol (1985). 2006. PMID: 16166236
-
The essential role of carotid body chemoreceptors in sleep apnea.Can J Physiol Pharmacol. 2003 Aug;81(8):774-9. doi: 10.1139/y03-056. Can J Physiol Pharmacol. 2003. PMID: 12897806 Review.
-
Rethinking O2, CO2 and breathing during wakefulness and sleep.J Physiol. 2024 Nov;602(21):5571-5585. doi: 10.1113/JP284551. Epub 2023 Sep 26. J Physiol. 2024. PMID: 37750243 Review.
Cited by
-
Hypercapnia: An Aggravating Factor in Asthma.J Clin Med. 2020 Oct 5;9(10):3207. doi: 10.3390/jcm9103207. J Clin Med. 2020. PMID: 33027886 Free PMC article. Review.
-
Potential Role of the Retrotrapezoid Nucleus in Mediating Cardio-Respiratory Dysfunction in Heart Failure With Preserved Ejection Fraction.Front Physiol. 2022 Apr 12;13:863963. doi: 10.3389/fphys.2022.863963. eCollection 2022. Front Physiol. 2022. PMID: 35492622 Free PMC article. Review.
-
Respiratory and autonomic dysfunction in congenital central hypoventilation syndrome.J Neurophysiol. 2016 Aug 1;116(2):742-52. doi: 10.1152/jn.00026.2016. Epub 2016 May 25. J Neurophysiol. 2016. PMID: 27226447 Free PMC article. Review.
-
Ventilatory and chemoreceptor responses to hypercapnia in neonatal rats chronically exposed to moderate hyperoxia.Respir Physiol Neurobiol. 2017 Mar;237:22-34. doi: 10.1016/j.resp.2016.12.008. Epub 2016 Dec 26. Respir Physiol Neurobiol. 2017. PMID: 28034711 Free PMC article.
-
Interdependent feedback regulation of breathing by the carotid bodies and the retrotrapezoid nucleus.J Physiol. 2018 Aug;596(15):3029-3042. doi: 10.1113/JP274357. Epub 2017 Dec 27. J Physiol. 2018. PMID: 29168167 Free PMC article. Review.
References
-
- Berkenbosch A, van Beek JH, Olievier CN, De Goede J. Quanjer PH. Central respiratory CO2 sensitivity at extreme hypocapnia. Respir Physiol. 1984;55:95–102. - PubMed
-
- Bisgard GE, Busch MA, Daristotle L, Berssenbrugge AD. Forster HV. Carotid body hypercapnia does not elicit ventilatory acclimatization in goats. Respir Physiol. 1986;65:113–125. - PubMed
-
- Bisgard GE, Forster HV. Klein JP. Recovery of peripheral chemoreceptor function after denervation in ponies. J Appl Physiol. 1980;49:964–970. - PubMed
Publication types
MeSH terms
Substances
Grants and funding
LinkOut - more resources
Full Text Sources