

ProLuCID: An improved SEQUEST-like algorithm with enhanced sensitivity and specificity
- PMID: 26171723
- PMCID: PMC4630125
- DOI: 10.1016/j.jprot.2015.07.001
ProLuCID: An improved SEQUEST-like algorithm with enhanced sensitivity and specificity
Abstract
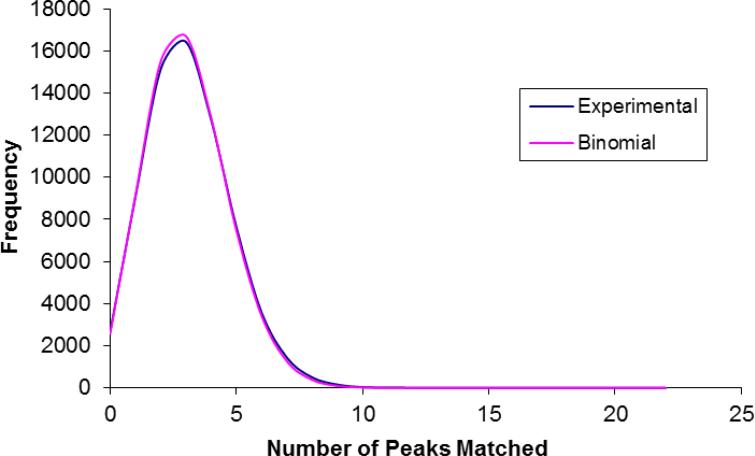
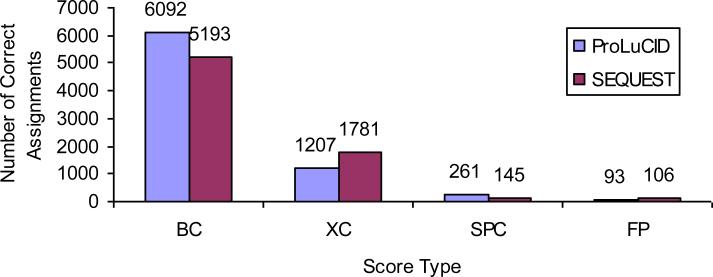
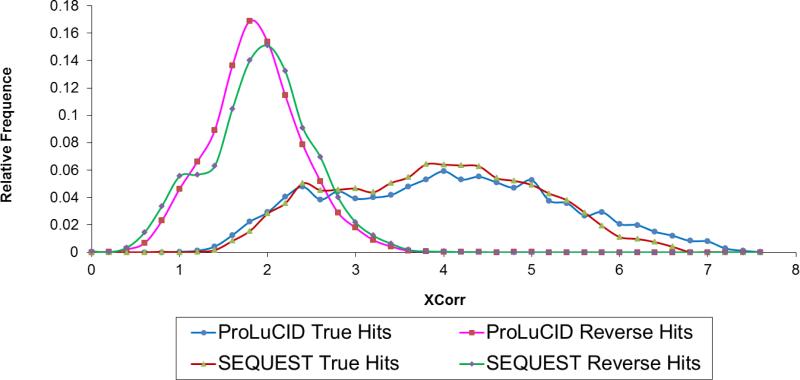
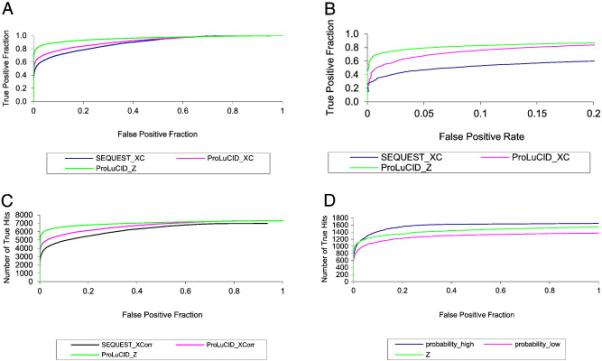
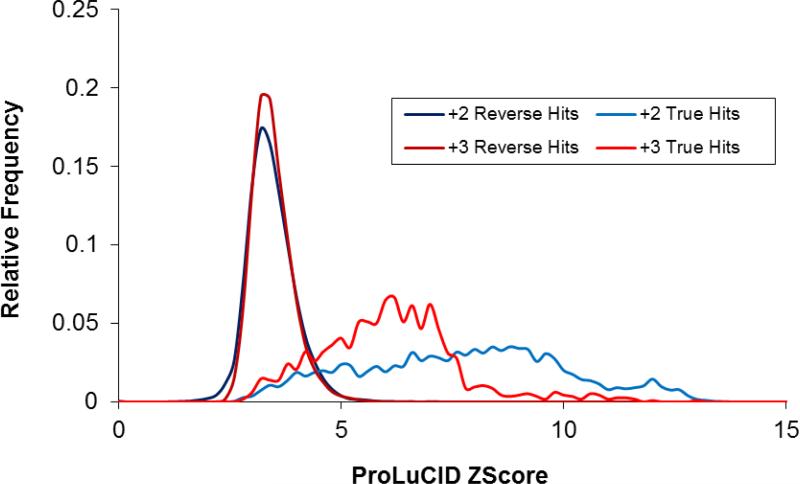
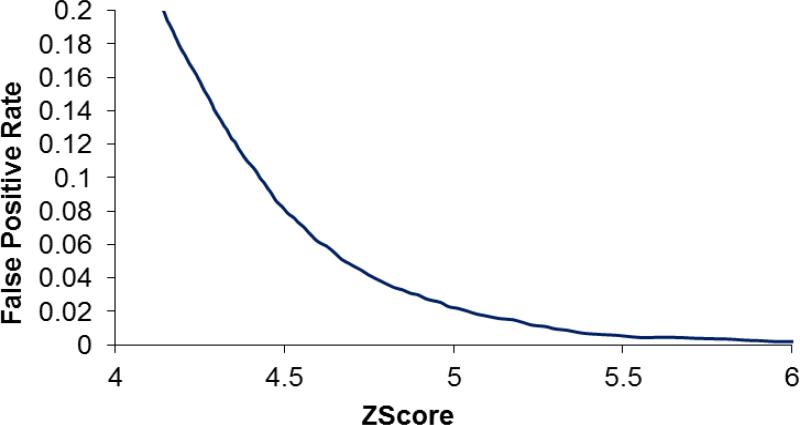
ProLuCID, a new algorithm for peptide identification using tandem mass spectrometry and protein sequence databases has been developed. This algorithm uses a three tier scoring scheme. First, a binomial probability is used as a preliminary scoring scheme to select candidate peptides. The binomial probability scores generated by ProLuCID minimize molecular weight bias and are independent of database size. A modified cross-correlation score is calculated for each candidate peptide identified by the binomial probability. This cross-correlation scoring function models the isotopic distributions of fragment ions of candidate peptides which ultimately results in higher sensitivity and specificity than that obtained with the SEQUEST XCorr. Finally, ProLuCID uses the distribution of XCorr values for all of the selected candidate peptides to compute a Z score for the peptide hit with the highest XCorr. The ProLuCID Z score combines the discriminative power of XCorr and DeltaCN, the standard parameters for assessing the quality of the peptide identification using SEQUEST, and displays significant improvement in specificity over ProLuCID XCorr alone. ProLuCID is also able to take advantage of high resolution MS/MS spectra leading to further improvements in specificity when compared to low resolution tandem MS data. A comparison of filtered data searched with SEQUEST and ProLuCID using the same false discovery rate as estimated by a target-decoy database strategy, shows that ProLuCID was able to identify as many as 25% more proteins than SEQUEST. ProLuCID is implemented in Java and can be easily installed on a single computer or a computer cluster. This article is part of a Special Issue entitled: Computational Proteomics.
Keywords: Bioinformatics; Identification; Mass spectrometry; ProLuCID; Proteomics; Sequest.
Copyright © 2015. Published by Elsevier B.V.
Figures
Similar articles
-
A fast SEQUEST cross correlation algorithm.J Proteome Res. 2008 Oct;7(10):4598-602. doi: 10.1021/pr800420s. Epub 2008 Sep 6. J Proteome Res. 2008. PMID: 18774840
-
Probability-based validation of protein identifications using a modified SEQUEST algorithm.Anal Chem. 2002 Nov 1;74(21):5593-9. doi: 10.1021/ac025826t. Anal Chem. 2002. PMID: 12433093
-
Optimization of filtering criterion for SEQUEST database searching to improve proteome coverage in shotgun proteomics.BMC Bioinformatics. 2007 Aug 31;8:323. doi: 10.1186/1471-2105-8-323. BMC Bioinformatics. 2007. PMID: 17761002 Free PMC article.
-
Improving protein identification from tandem mass spectrometry data by one-step methods and integrating data from other platforms.Brief Bioinform. 2016 Mar;17(2):262-9. doi: 10.1093/bib/bbv043. Epub 2015 Jul 3. Brief Bioinform. 2016. PMID: 26141827 Free PMC article. Review.
-
Protein identification using Sorcerer 2 and SEQUEST.Curr Protoc Bioinformatics. 2009 Dec;Chapter 13:Unit 13.3. doi: 10.1002/0471250953.bi1303s28. Curr Protoc Bioinformatics. 2009. PMID: 19957274 Review.
Cited by
-
Loss of MAGEL2 in Prader-Willi syndrome leads to decreased secretory granule and neuropeptide production.JCI Insight. 2020 Sep 3;5(17):e138576. doi: 10.1172/jci.insight.138576. JCI Insight. 2020. PMID: 32879135 Free PMC article.
-
OSBPL2 mutations impair autophagy and lead to hearing loss, potentially remedied by rapamycin.Autophagy. 2022 Nov;18(11):2593-2614. doi: 10.1080/15548627.2022.2040891. Epub 2022 Mar 6. Autophagy. 2022. PMID: 35253614 Free PMC article.
-
Protein turnover models for LC-MS data of heavy water metabolic labeling.Brief Bioinform. 2022 Mar 10;23(2):bbab598. doi: 10.1093/bib/bbab598. Brief Bioinform. 2022. PMID: 35062023 Free PMC article.
-
Analysis of proteome-wide degradation dynamics in ALS SOD1 iPSC-derived patient neurons reveals disrupted VCP homeostasis.Cell Rep. 2023 Oct 31;42(10):113160. doi: 10.1016/j.celrep.2023.113160. Epub 2023 Sep 29. Cell Rep. 2023. PMID: 37776851 Free PMC article.
-
Identification of IMC43, a novel IMC protein that collaborates with IMC32 to form an essential daughter bud assembly complex in Toxoplasma gondii.PLoS Pathog. 2023 Oct 2;19(10):e1011707. doi: 10.1371/journal.ppat.1011707. eCollection 2023 Oct. PLoS Pathog. 2023. PMID: 37782662 Free PMC article.
References
-
- Link AJ, et al. Direct analysis of protein complexes using mass spectrometry. Nat Biotechnol. 1999;17:676–682. doi:10.1038/10890. - PubMed
-
- Washburn MP, Wolters D, Yates JR., 3rd Large-scale analysis of the yeast proteome by multidimensional protein identification technology. Nat Biotechnol. 2001;19:242–247. - PubMed
-
- Nesvizhskii AI. Protein identification by tandem mass spectrometry and sequence database searching. Methods Mol Biol. 2006;367:87–120. - PubMed
-
- Olsen JV, et al. Parts per million mass accuracy on an Orbitrap mass spectrometer via lock mass injection into a C-trap. Mol Cell Proteomics. 2005;4:2010–2021. - PubMed
Publication types
MeSH terms
Substances
Grants and funding
LinkOut - more resources
Full Text Sources
Other Literature Sources
