. 2015 Sep 15;6(27):24361-75.
doi: 10.18632/oncotarget.4458.

eIF3 controls cell size independently of S6K1-activity

Affiliations

eIF3 controls cell size independently of S6K1-activity

Katharina Schipany et al. Oncotarget. .

Abstract

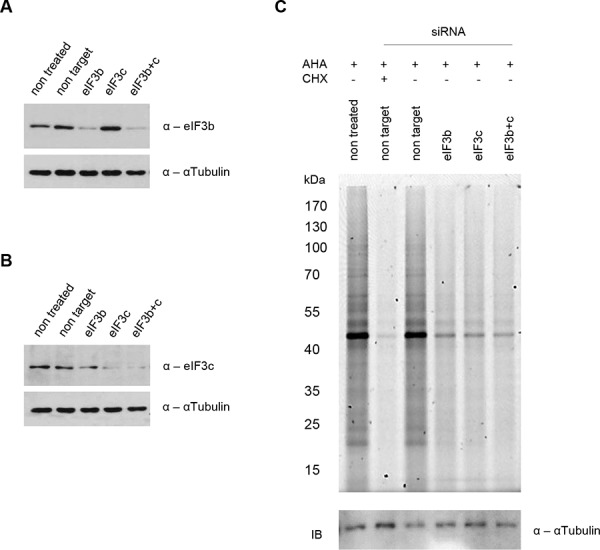
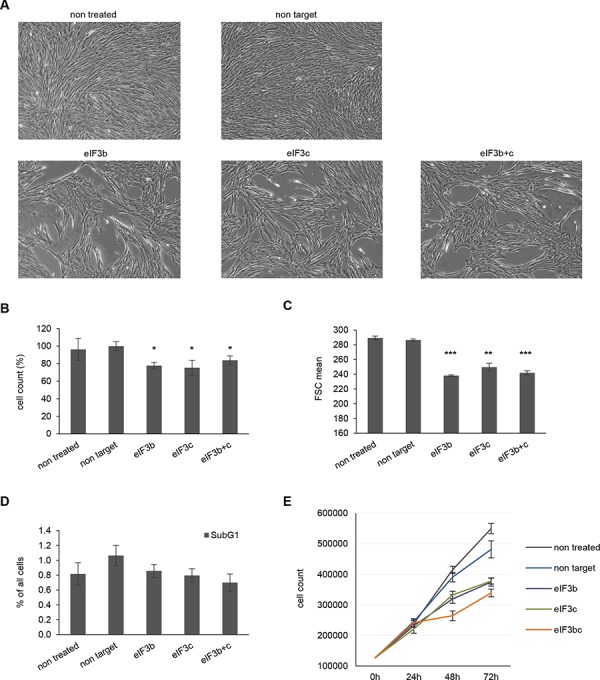
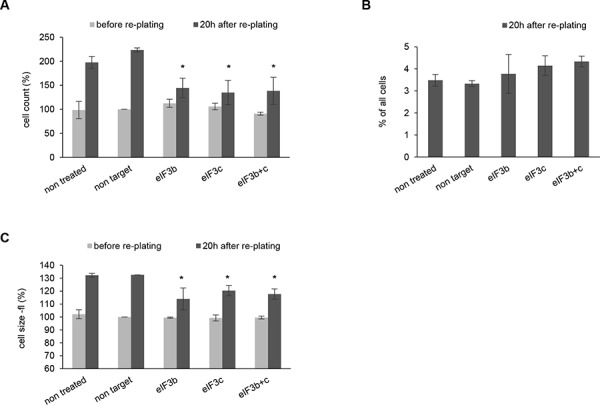
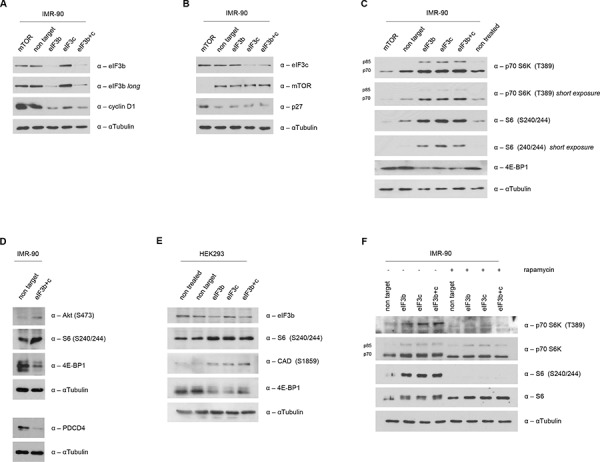
All multicellular organisms require a life-long regulation of the number and the size of cells, which build up their organs. mTOR acts as a signaling nodule for the regulation of protein synthesis and growth. To activate the translational cascade, mTOR phosphorylates S6 kinase (S6K1), which is liberated from the eIF3-complex and mobilized for activation of its downstream targets. How S6K1 regulates cell size remains unclear. Here, we challenged cell size control through S6K1 by specifically depleting its binding partner eIF3 in normal and transformed cell lines. We show that loss of eIF3 leads to a massive reduction of cell size and cell number accompanied with an unexpected increase in S6K1-activity. The hyperactive S6K1-signaling was rapamycin-sensitive, suggesting an upstream mTOR-regulation. A selective S6K1 inhibitor (PF-4708671) was unable to interfere with the reduced size, despite efficiently inhibiting S6K1-activity. Restoration of eIF3 expression recovered size defects, without affecting the p-S6 levels. We further show that two, yet uncharacterized, cancer-associated mutations in the eIF3-complex, have the capacity to recover from reduced size phenotype, suggesting a possible role for eIF3 in regulating cancer cell size. Collectively, our results uncover a role for eIF3-complex in maintenance of normal and neoplastic cell size - independent of S6K1-signaling.

Keywords: S6K; cancer; cell size; eIF3; mTOR.


Conflict of interest statement

CONFLICTS OF INTEREST

The authors declare that they have no conflict of interest.

Figures

Figure 1
Figure 1. siRNA mediated knockdown of eIF3b and/or eIF3c blocks nascent protein synthesis in IMR-90 cells
IMR-90 cells were transfected with specific siRNAs or left untreated as indicated. A and B. Knockdown efficiency was confirmed by immunoblotting using antibodies specific for (A) eIF3b and (B) eIF3c. αTubulin serves as a loading control. C. L-azidohomoalanine (AHA) incorporation was measured after 3.5 hours. Cycloheximide (CHX) was used as a control for total protein synthesis inhibition at a final concentration of 50 μM. Nascent protein synthesis was evaluated by fluorescent scanning of AHA bound Tetramethylrhodamine (TAMRA) at Ex550/Em570. Loading was verified by immunoblotting using αTubulin antibody as a control.
Figure 2
Figure 2. Depletion of eIF3b and/or eIF3c decreases proliferation and cell size of IMR-90 cells
A. Representative pictures of siRNA treated IMR-90 cells 72 hours post transfection are shown (magnification 4x). B. Cell numbers were measured using Casy cell counter at 72 h after transfection. Total numbers were normalized to non-target siRNA-transfected cells. C. Cell size was assessed by flow cytometry using the parameter forward scatter (FSC). D. Percentage of apoptotic cells (subG1-fraction) was determined by flow cytometry of propidium iodide (PI)-labeled cells at 72 h post transfection. One representative experiment out of two is shown. E. Proliferation curves of control and eIF3b-, eIF3c- and eIF3b and c-depleted IMR-90 cells. Cells were transfected and counted at 0, 24, 48 and 72 hours post transfection. (B and C) Figures show means of two independent experiments performed in triplicates. Error bars represent means ± SD.
Figure 3
Figure 3. Depletion of eIF3b and/or eIF3c in HEK293 cells causes reduced proliferation and smaller cell size after re-plating of cells
A. Cells numbers were measured before (72 h after transfection) and 20 h after re-plating. Cell numbers were normalized to non-target siRNA-transfected cells before re-plating. B. Percentage of apoptotic cells was evaluated by PI-staining. One representative experiment out of two independent experiments performed in triplicates is shown. C. Cell size was determined with Casy cell counter by analyzing cell volume (fl). Cell volumes were normalized to non-target siRNA-transfected cells before re-plating. (A, C) Figures show means of two independent experiments performed in triplicates. Error bars represent means ± SD.
Figure 4
Figure 4. Increased S6K1-activity in eIF3b and/or eIF3c-depleted cells
A. Western blot analysis of eIF3b and Cyclin D1 was performed in eIF3b and/or eIF3c-depleted IMR-90 cells at 16h after re-plating. B. At the same time-point, eIF3c, p27 and mTOR expression levels were determined in eIF3b and/or eIF3c-depleted IMR-90 cells. To avoid any interference in the detection of eIF3b and eIF3c due to similar protein size on the same membrane, same lysates were detected on separate membranes. C. Expression levels of mTORC1-specific targets were evaluated by western blotting in eIF3b/c- or mTOR-depleted IMR-90 cells. D. mTORC2-specific target p-AKT (S473) as well as PDCD4 expression levels were detected in cell lysates of IMR-90 as indicated. E. mTORC1 and mTORC2-specific targets were determined in HEK293 cells by immunoblotting. F. 48 hours post transfection, IMR-90 cells were treated with 100nM rapamycin or DMSO for another 24 hours. Total and phosphorylated S6K1 and S6 protein levels were evaluated by immunoblotting. αTubulin was used as appropriate loading control in all panels.
Figure 5
Figure 5. Subcellular and cell cycle dependent localization of eIF3b and eIF3c
A. Cellular localization of endogenous eIF3b and eIF3c was verified in cytoplasmic (C) and nuclear lysates (N) of IMR-90 and HEK293 cells. Purity of protein fractions was confirmed by the use of antibodies specific for cytoplasmic (αTubulin) and nuclear (Fibrillarin) proteins. B. IMR-90 cells were cell cycle synchronized in G0/G1 via serum deprivation and then re-stimulated. Cell cycle regulated proteins like p27, cyclinD1 and cyclinA were used as a control to show the stages of cell cycle progression upon serum re-stimulation (upper panel). Total and subcellular fractions of the same pool of cells were analyzed for eIF3b protein expression at 0, 1, 6, 12 and 24 hours post serum re-stimulation (lower panel).
Figure 6
Figure 6. Cell size, proliferation and cell cycle distribution are independent of S6K1 activity
A. siRNA-transfected cells were re-plated for additional 16 h in presence or absence of S6K1 inhibitor PF-4708671. p-S6 (Ser240/244) levels as a readout are shown. GAPDH was used as a loading control. B. Cell number was determined using Casy cell counter. Total numbers were normalized to non-target siRNA-transfected cells. C. Cell size was determined by FSC values using flow cytometry. (B-C) Figures show means of three independent experiments performed in triplicates. D. Cell cycle distribution including subG1 levels for apoptotic cells. One representative experiment out of three independent experiments performed in triplicates is shown. E. IMR-90 cells were treated with DMSO, 100 nM Rapamycin, 10 μM PF-4708671 or 20 μg/ml Cycloheximide for 24 hours. Cell size was measured for each phase of the cell cycle by flow cytometry. F. Corresponding cell lysates were immunoblotted for p-S6 (S240/244). G. IMR-90 cells were transfected with specific siRNAs for 72 hours as indicated. Cell size was assessed by flow cytometry for each phase of the cell cycle. H. Corresponding cell lysates were immunoblotted to confirm knockdown efficiency. (E, G) One representative experiment out of two independent experiments performed in triplicates is shown. Error bars correspond to means ± SD.
Figure 7
Figure 7. Re-expression of wild-type and mutant forms of eIF3b and eIF3c restores knockdown-induced cell size defects, independently of S6K1-activity
A. Schematic representation of eIF3b and eIF3c protein secondary structure including annotated Pfam-A protein domains. The substitution missense mutation of eIF3b (p.T668P) is located in the eIF2A region and of eIF3c (p.P309T) in the N terminal region. RRM_1, RNA recognition motif; eIF2A, eukaryotic translation initiation factor eIF2A; eIF-3c_N, eukaryotic initiation factor 3 subunit 8 N terminus; PCI, PCI domain (Cosmic database). B. IMR-90 cells depleted for eIF3b and eIF3c were transfected with empty vector (eV), wild-type (Wt) eIF3b, Wt eIF3c or the corresponding mutants. To avoid interference in detection of eIF3b, eIF3c and HA-tagged proteins due to similar protein size, the same lysates were detected on separate membranes. C. A control vector carrying GFP-spectrin was co-transfected in all settings used. Cell size was measured in GFP-negative (untransfected fraction) and GFP-positive cells (transfected fraction). Representative bar diagrams out of two independent experiments are shown. Error bars correspond to means ± SD. D. Phosphorylation levels of S6 (S240/244) protein were determined by phospho-specific flow cytometry in GFP-positive cells using the same co-transfection setting as in (C) Representative bar diagrams and histogram overlays out of two independent experiments are shown.

Similar articles

Cited by

References

    1. Lloyd AC. The regulation of cell size. Cell. 2013;154:1194–1205. - PubMed
    1. Fingar DC, Salama S, Tsou C, Harlow E, Blenis J. Mammalian cell size is controlled by mTOR and its downstream targets S6K1 and 4EBP1/eIF4E. Genes Dev. 2002;16:1472–1487. - PMC - PubMed
    1. Conlon I, Raff M. Size control in animal development. Cell. 1999;96:235–244. - PubMed
    1. Rosenwald IB. The role of translation in neoplastic transformation from a pathologist's point of view. Oncogene. 2004;23:3230–3247. - PubMed
    1. Zhang L, Pan X, Hershey JW. Individual overexpression of five subunits of human translation initiation factor eIF3 promotes malignant transformation of immortal fibroblast cells. J Biol Chem. 2007;282:5790–5800. - PubMed

Publication types

MeSH terms

LinkOut - more resources