Review
. 2015 Jul-Aug;35(4):1056-76.
doi: 10.1148/rg.2015140232.

Segmentation and Image Analysis of Abnormal Lungs at CT: Current Approaches, Challenges, and Future Trends

Affiliations
Review

Segmentation and Image Analysis of Abnormal Lungs at CT: Current Approaches, Challenges, and Future Trends

Awais Mansoor et al. Radiographics. 2015 Jul-Aug.

Abstract

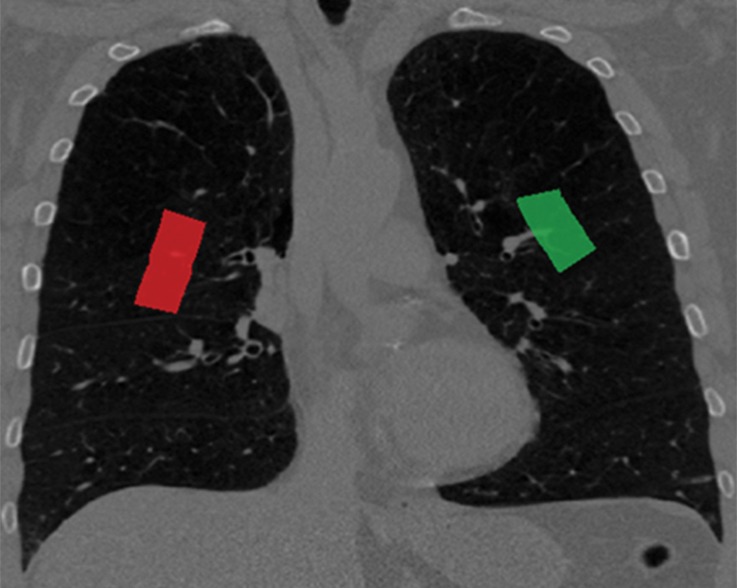
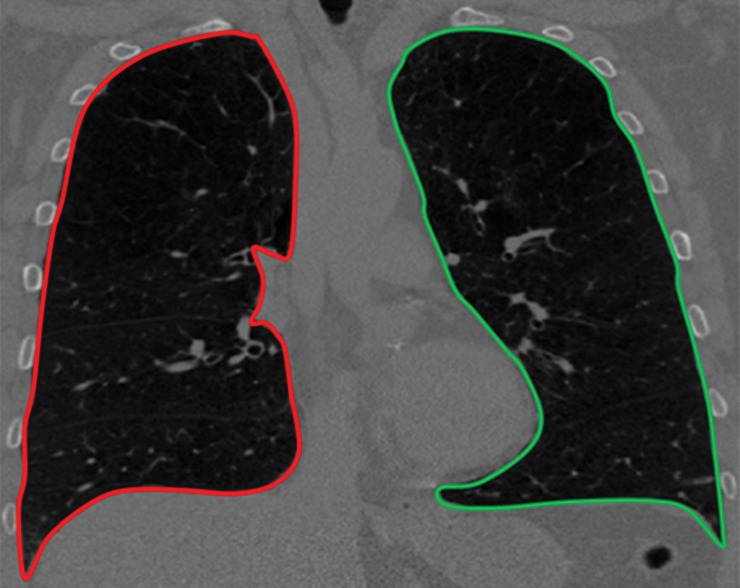
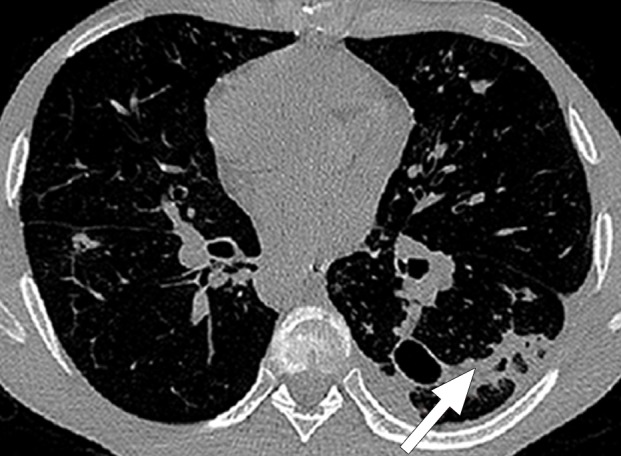
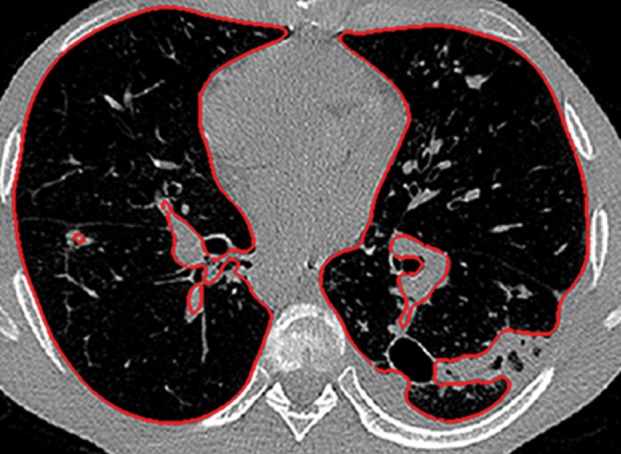
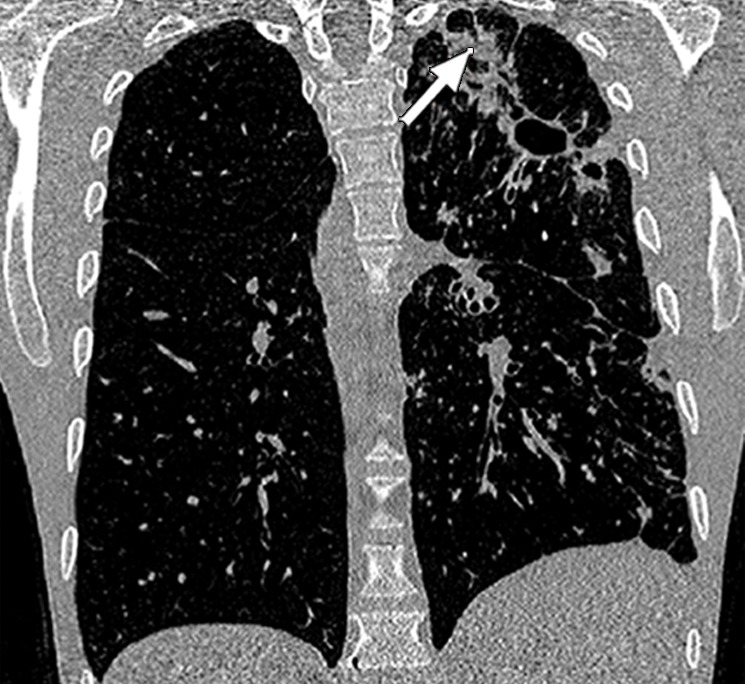
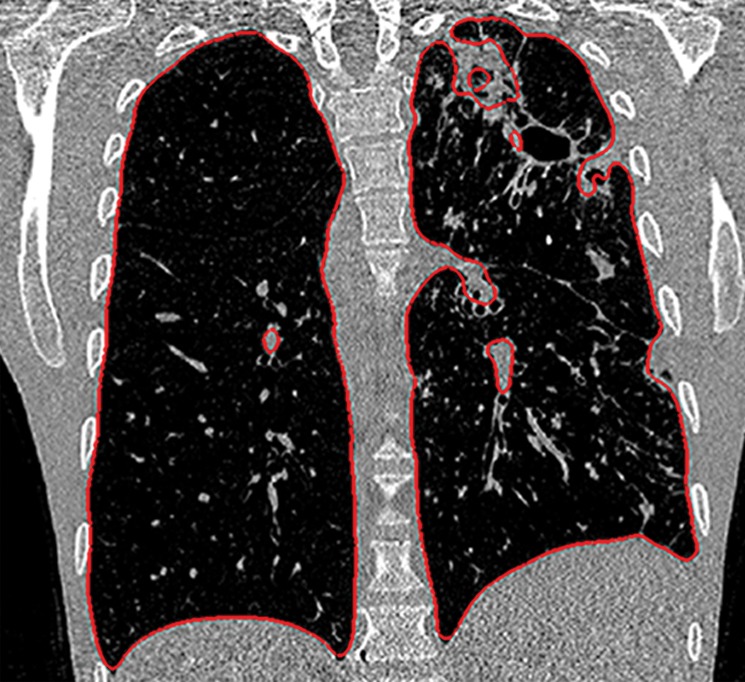
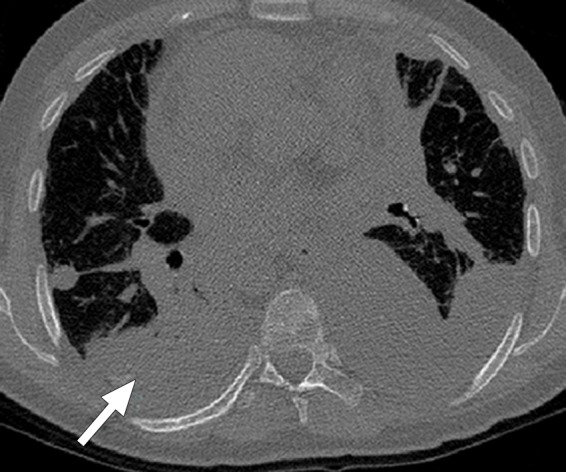
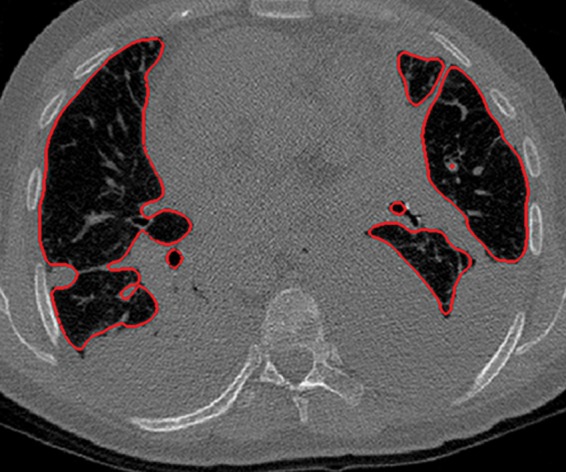
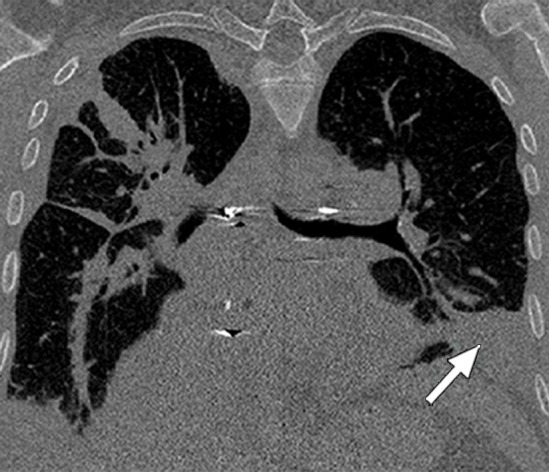
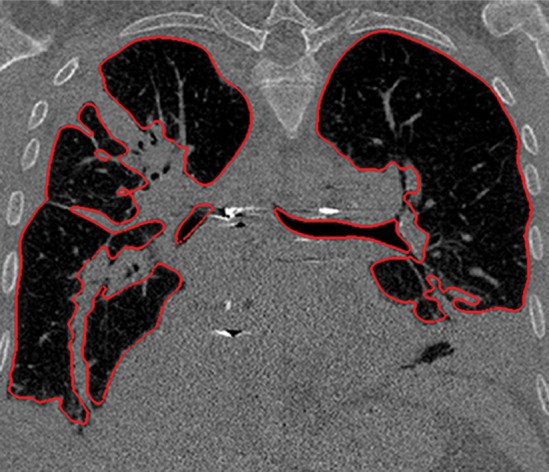
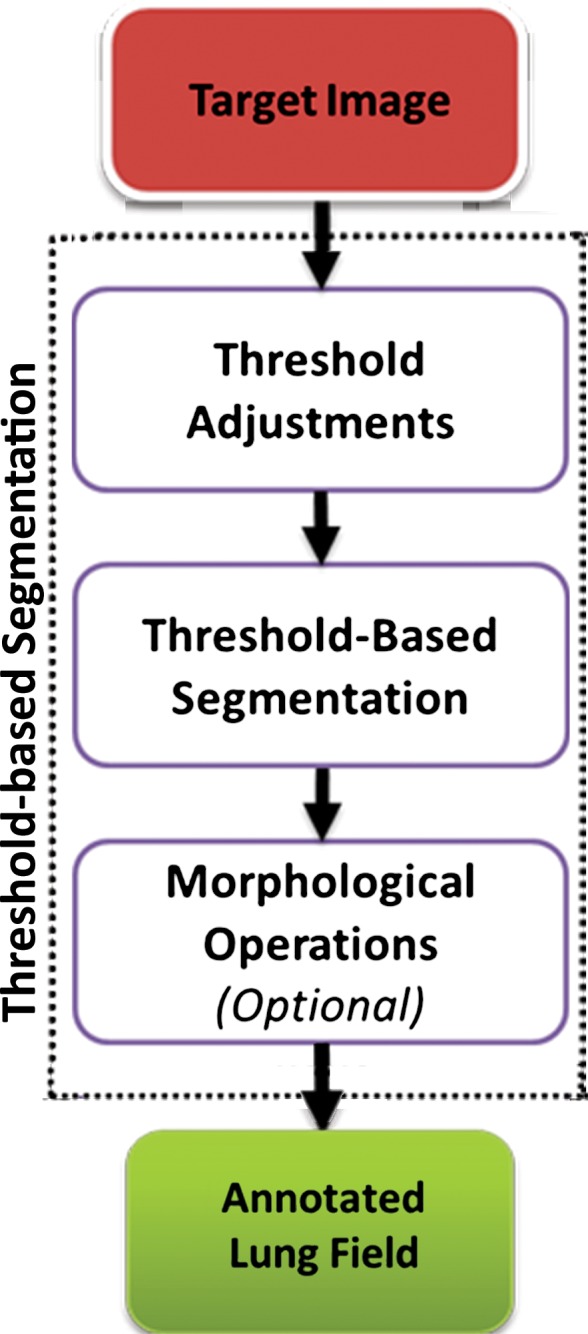
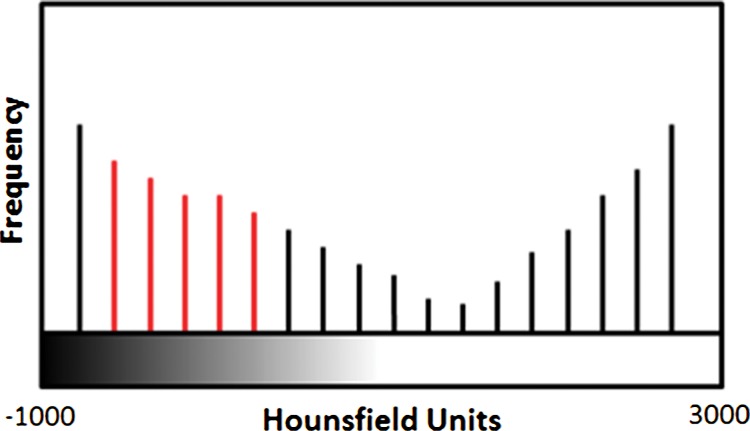
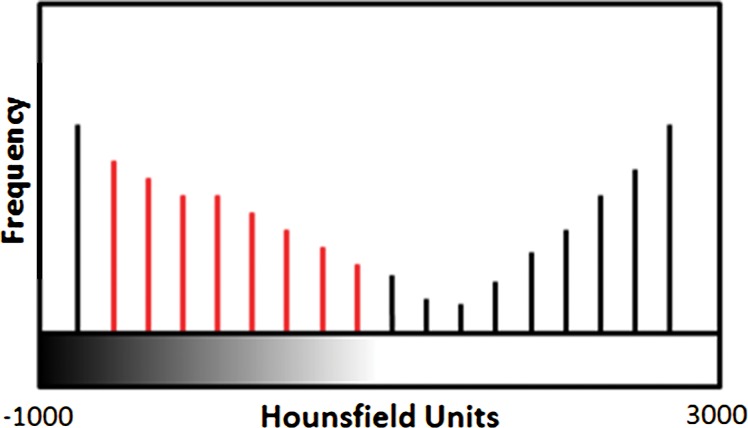
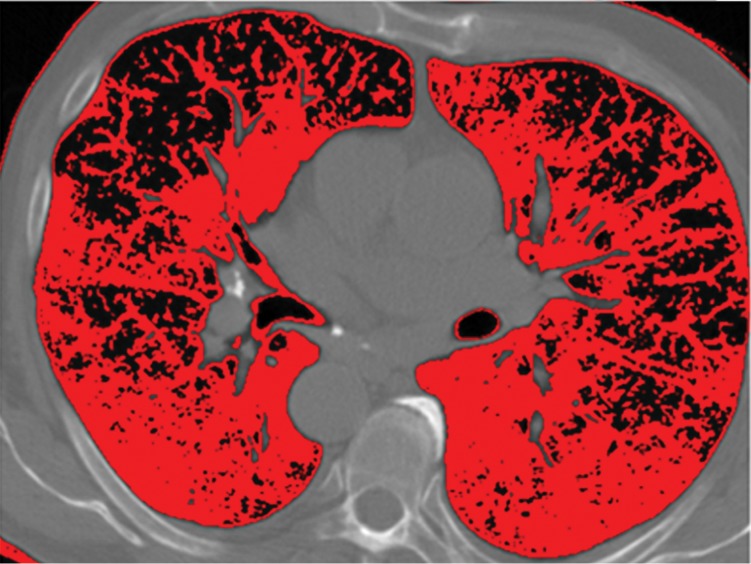
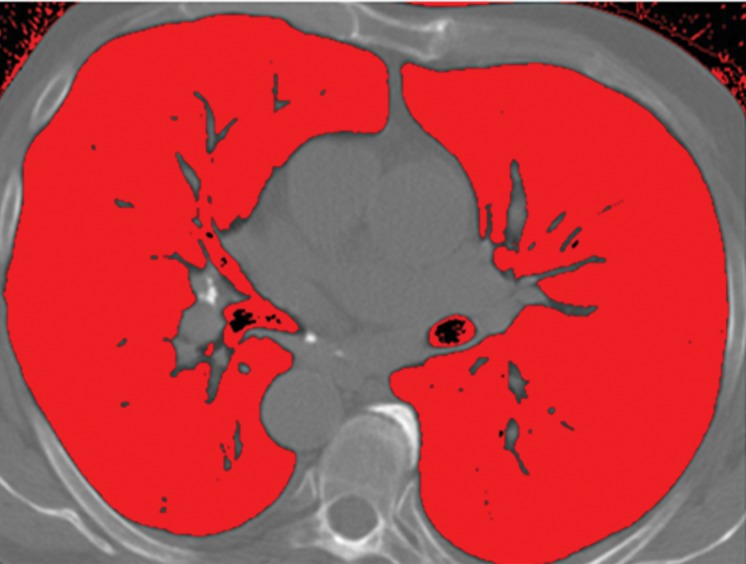
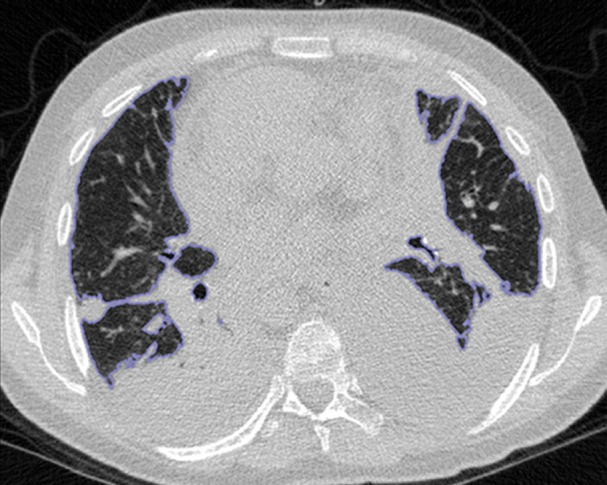
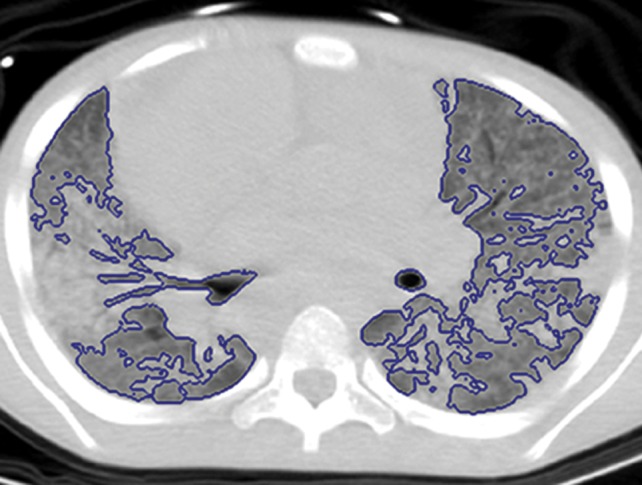
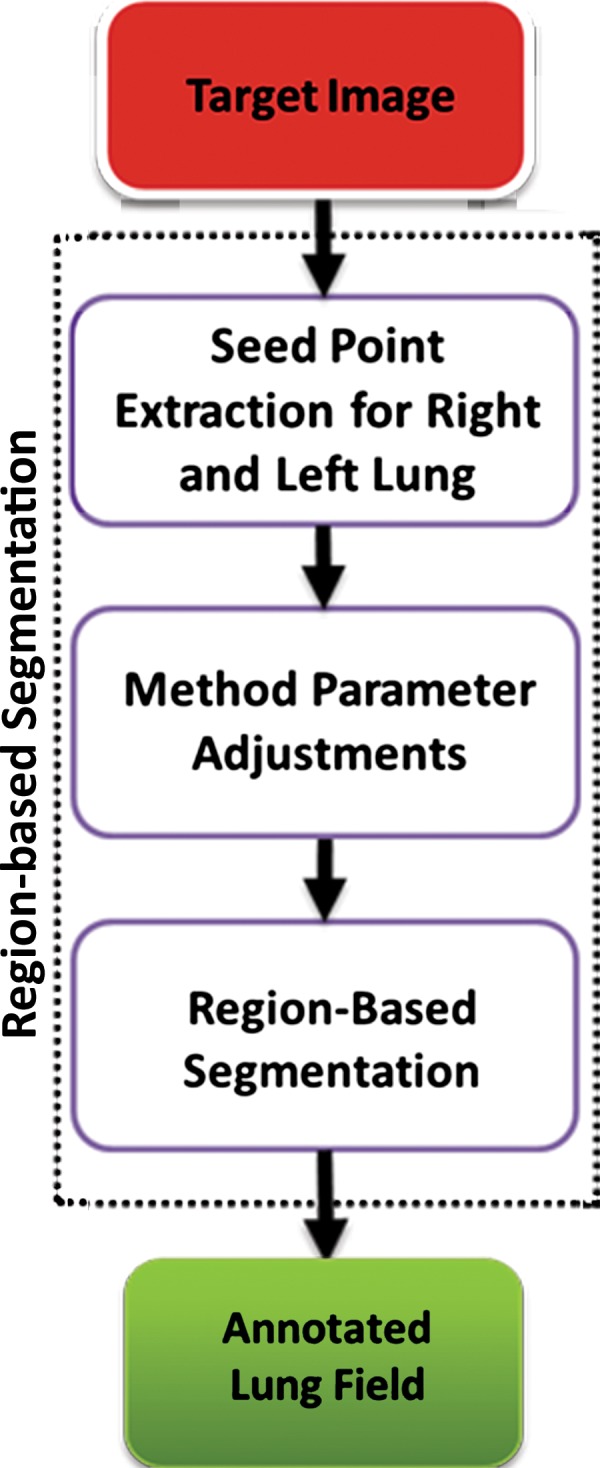
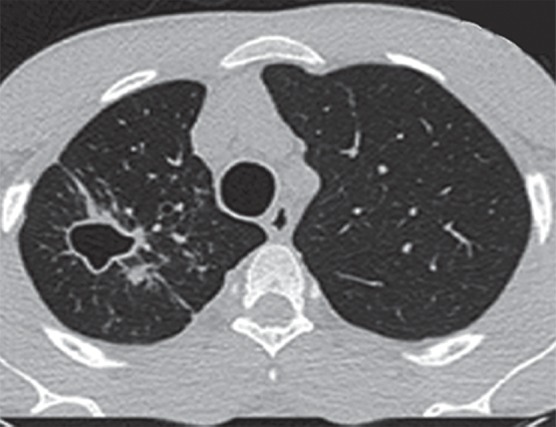
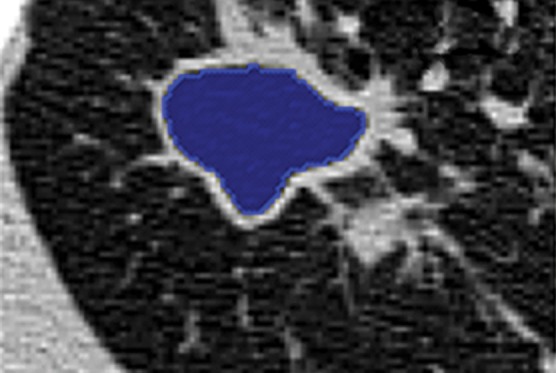
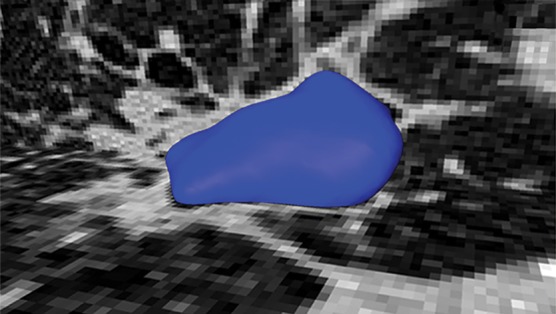
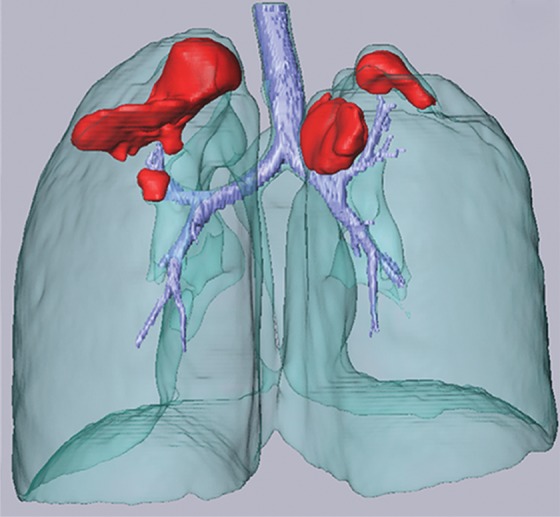
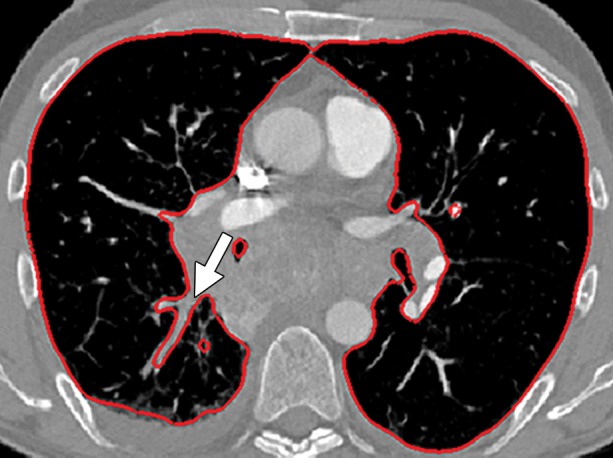
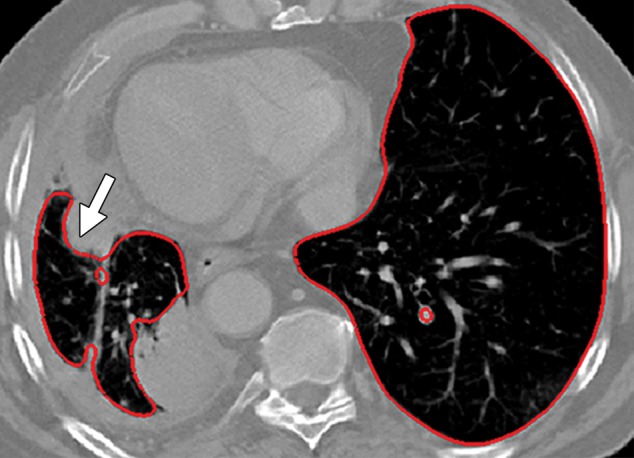
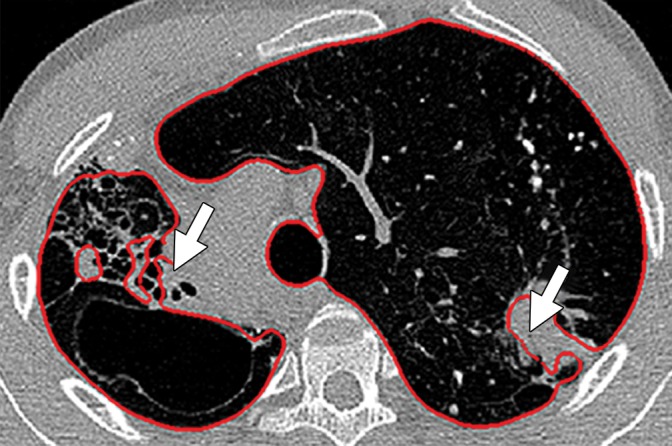
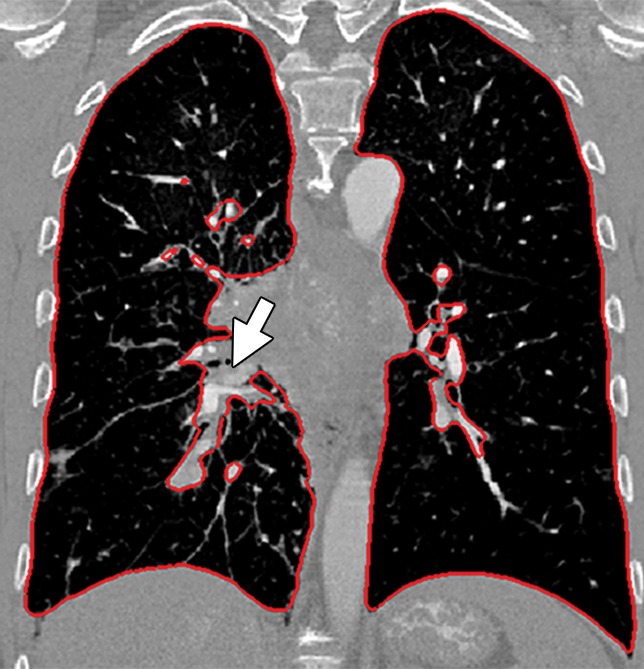
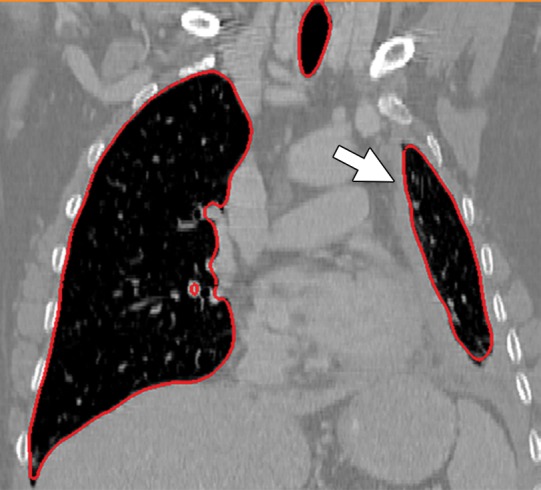
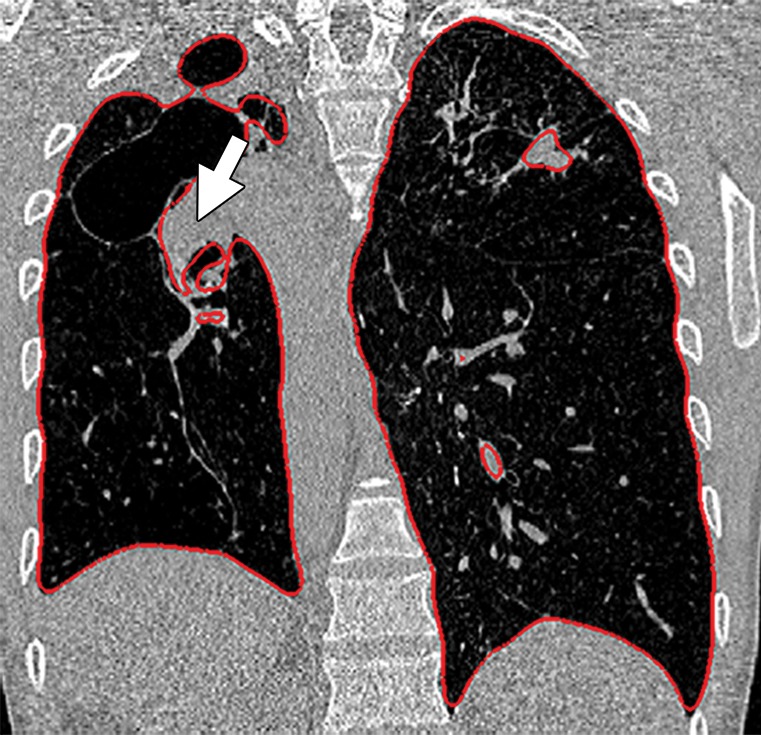
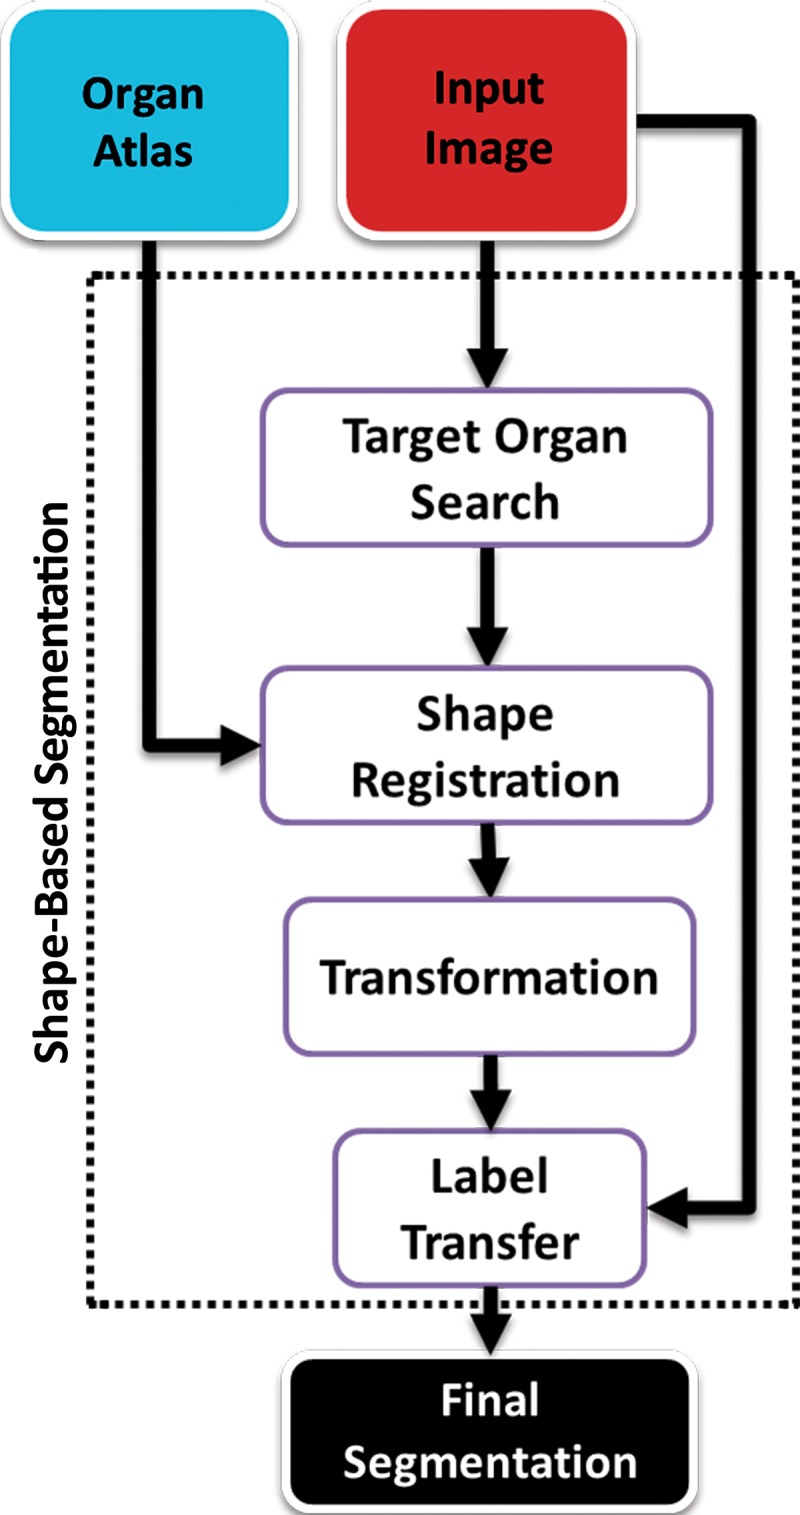
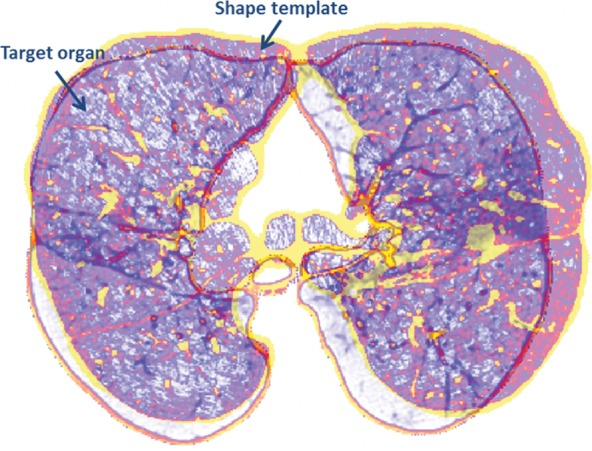
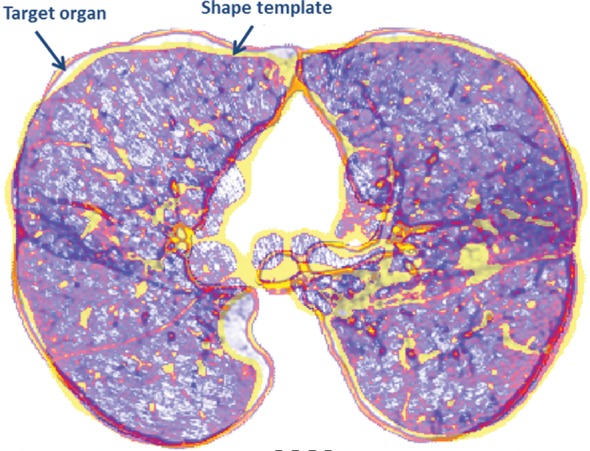
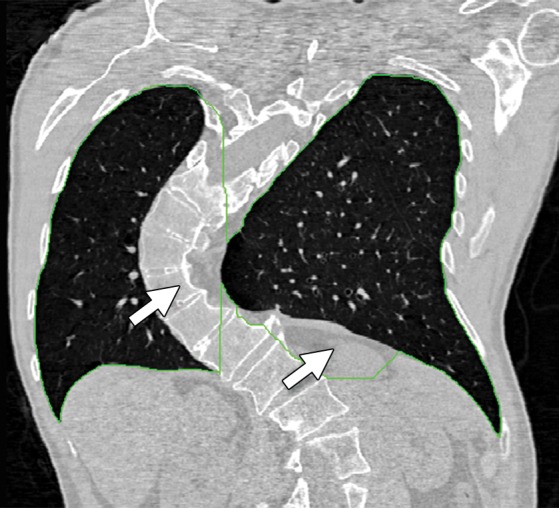
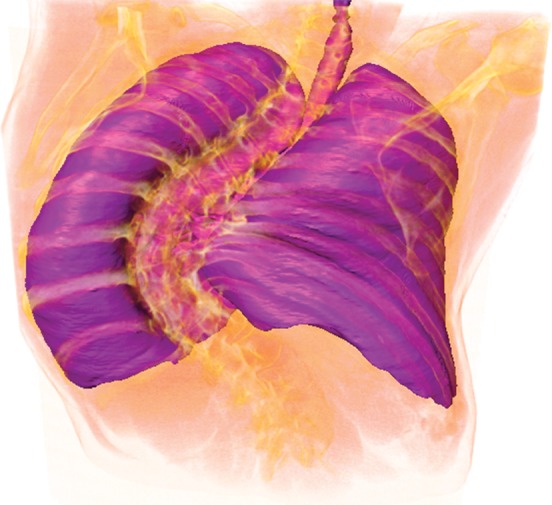
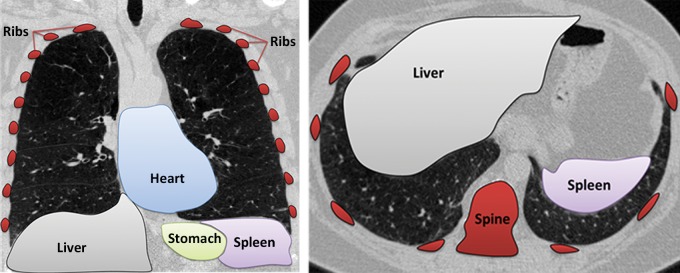
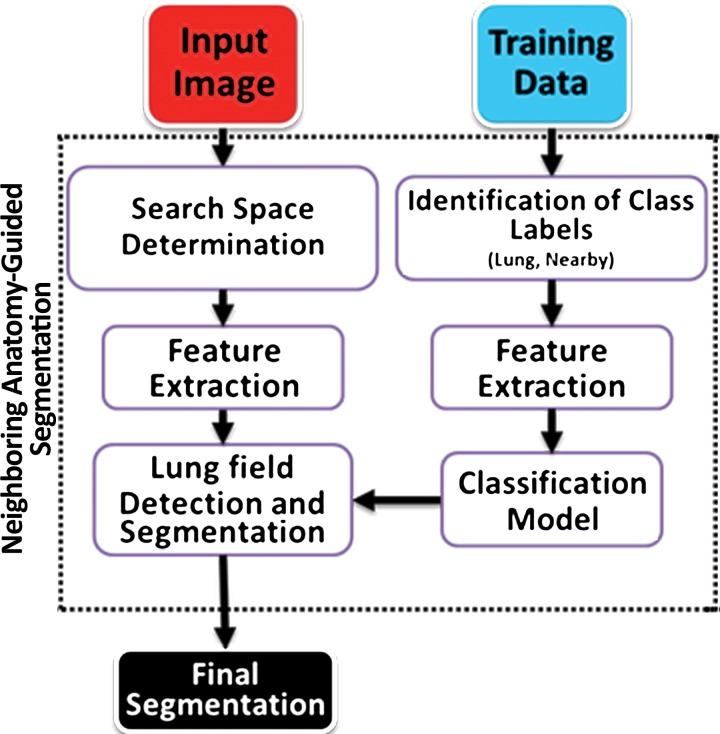
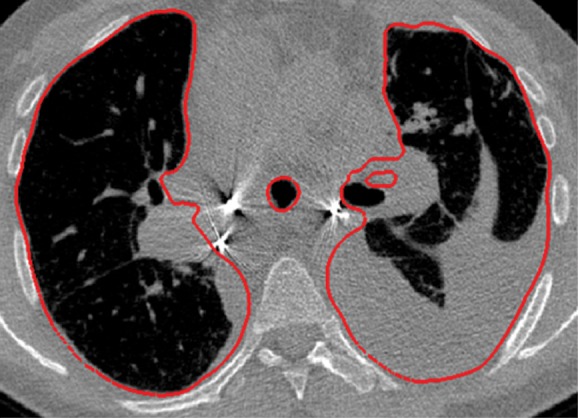
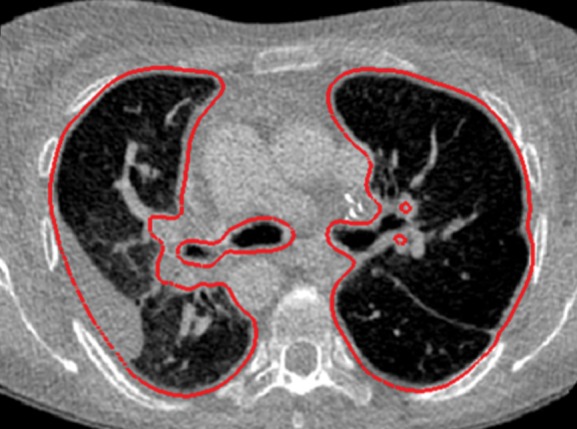
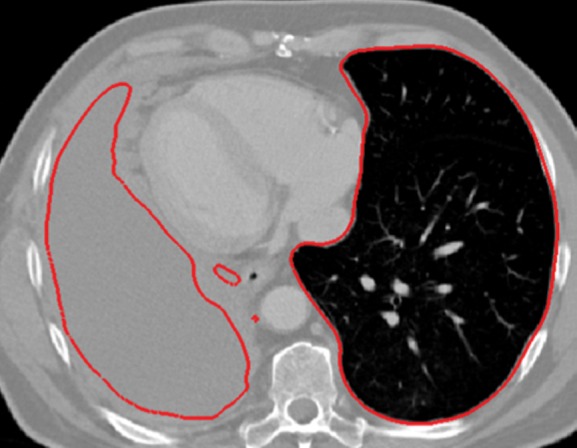
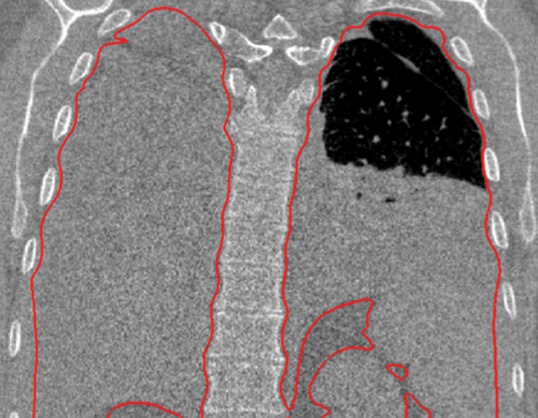
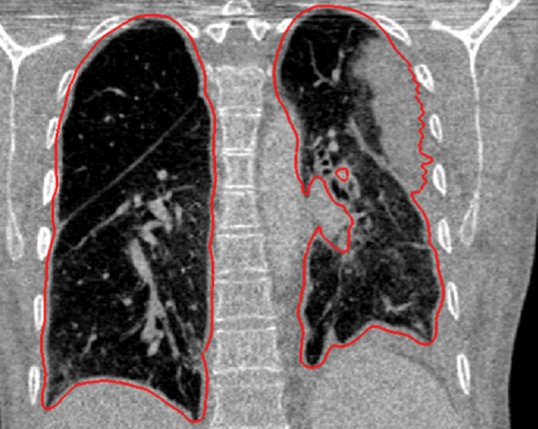
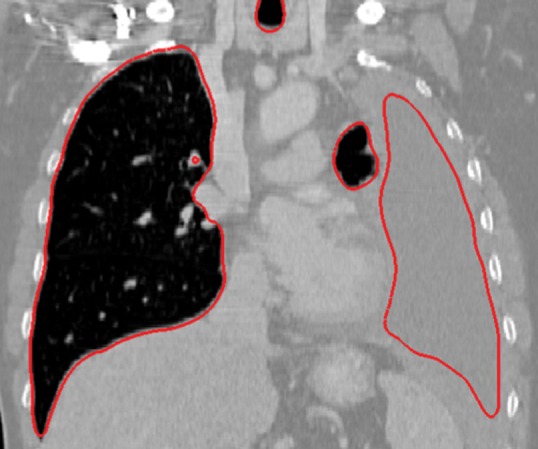
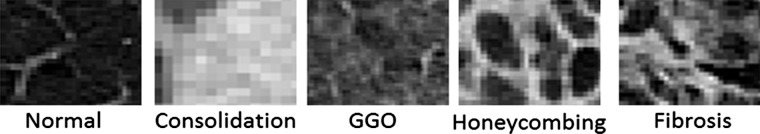
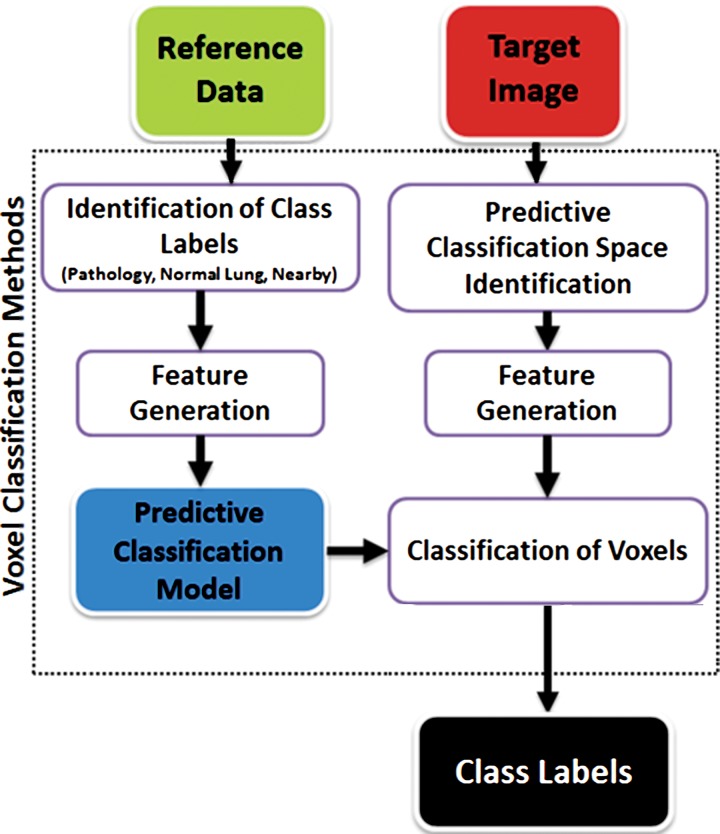
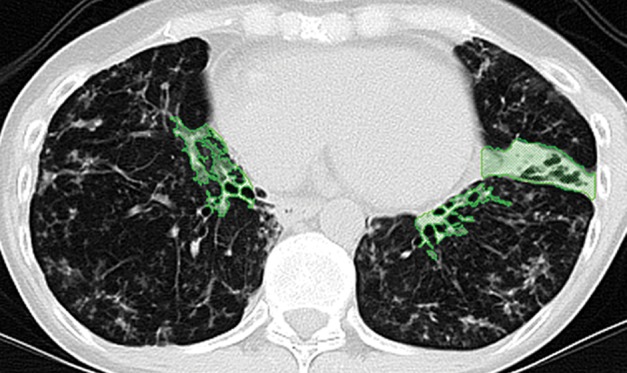
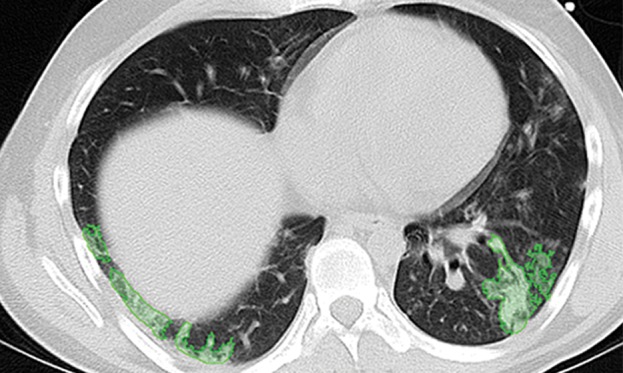
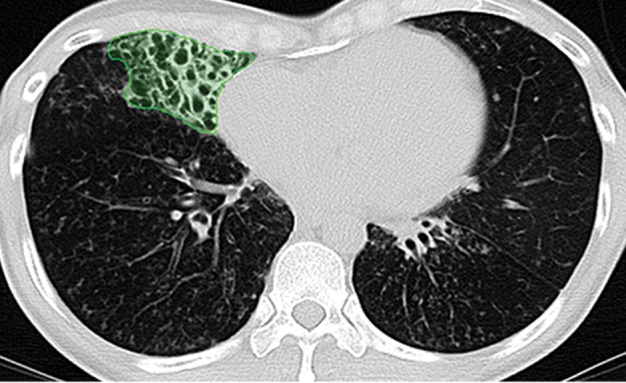
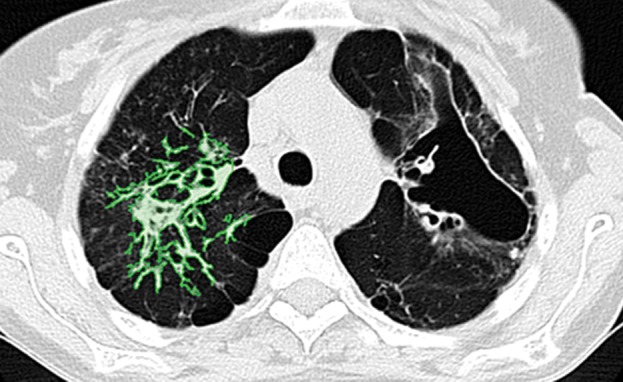
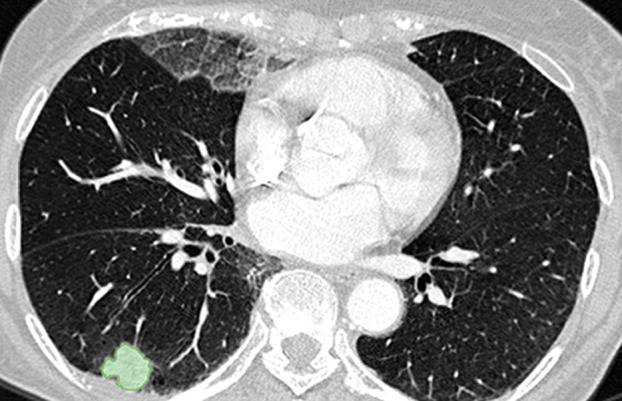
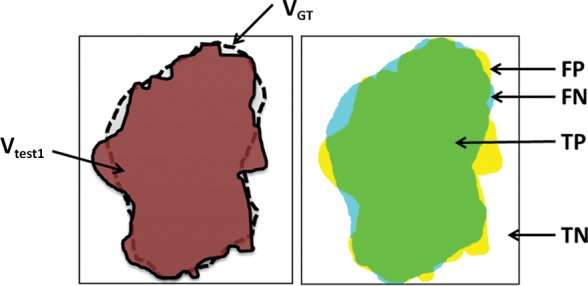
The computer-based process of identifying the boundaries of lung from surrounding thoracic tissue on computed tomographic (CT) images, which is called segmentation, is a vital first step in radiologic pulmonary image analysis. Many algorithms and software platforms provide image segmentation routines for quantification of lung abnormalities; however, nearly all of the current image segmentation approaches apply well only if the lungs exhibit minimal or no pathologic conditions. When moderate to high amounts of disease or abnormalities with a challenging shape or appearance exist in the lungs, computer-aided detection systems may be highly likely to fail to depict those abnormal regions because of inaccurate segmentation methods. In particular, abnormalities such as pleural effusions, consolidations, and masses often cause inaccurate lung segmentation, which greatly limits the use of image processing methods in clinical and research contexts. In this review, a critical summary of the current methods for lung segmentation on CT images is provided, with special emphasis on the accuracy and performance of the methods in cases with abnormalities and cases with exemplary pathologic findings. The currently available segmentation methods can be divided into five major classes: (a) thresholding-based, (b) region-based, (c) shape-based, (d) neighboring anatomy-guided, and (e) machine learning-based methods. The feasibility of each class and its shortcomings are explained and illustrated with the most common lung abnormalities observed on CT images. In an overview, practical applications and evolving technologies combining the presented approaches for the practicing radiologist are detailed.


Figures

Figure 1a
Figure 1a
Example of the tasks of object recognition (a) and object delineation (b) for the left lung (green) and right lung (red) on a coronal CT image.
Figure 1b
Figure 1b
Example of the tasks of object recognition (a) and object delineation (b) for the left lung (green) and right lung (red) on a coronal CT image.
Figure 2a
Figure 2a
Inaccurate boundary identification. Axial (a, b) and coronal (c, d) CT images show that cavities and consolidation (arrow in a, c) can lead to inaccurate segmentation (red contours in b, d).
Figure 2b
Figure 2b
Inaccurate boundary identification. Axial (a, b) and coronal (c, d) CT images show that cavities and consolidation (arrow in a, c) can lead to inaccurate segmentation (red contours in b, d).
Figure 2c
Figure 2c
Inaccurate boundary identification. Axial (a, b) and coronal (c, d) CT images show that cavities and consolidation (arrow in a, c) can lead to inaccurate segmentation (red contours in b, d).
Figure 2d
Figure 2d
Inaccurate boundary identification. Axial (a, b) and coronal (c, d) CT images show that cavities and consolidation (arrow in a, c) can lead to inaccurate segmentation (red contours in b, d).
Figure 3a
Figure 3a
Distorted automated segmentation. Axial (a, b) and coronal (c, d) CT images show that pleural effusions (arrow in a, c) can lead to inaccurate segmentation (red contours in b, d).
Figure 3b
Figure 3b
Distorted automated segmentation. Axial (a, b) and coronal (c, d) CT images show that pleural effusions (arrow in a, c) can lead to inaccurate segmentation (red contours in b, d).
Figure 3c
Figure 3c
Distorted automated segmentation. Axial (a, b) and coronal (c, d) CT images show that pleural effusions (arrow in a, c) can lead to inaccurate segmentation (red contours in b, d).
Figure 3d
Figure 3d
Distorted automated segmentation. Axial (a, b) and coronal (c, d) CT images show that pleural effusions (arrow in a, c) can lead to inaccurate segmentation (red contours in b, d).
Figure 4
Figure 4
Flowchart of a thresholding-based method of lung segmentation. The attenuation numbers (in Hounsfield units) of the pixels are used to segment the lungs. False-positive findings and artifacts may still occur with this approach; therefore, morphologic operations can be conducted afterward.
Figure 5a
Figure 5a
Schematic diagram providing an overview of the thresholding-based approach to lung segmentation. Graphs (a, b) show how the upper and lower threshold values (shown with red vertical lines in a, b) in Hounsfield units are adjusted to annotate the lungs on CT images (c, d). The suboptimal interval of attenuation in a results in excluded lung parenchyma (black regions in c) from the segmented lung regions (red), in comparison with the better attenuation interval in b, which results in better lung segmentation in d.
Figure 5b
Figure 5b
Schematic diagram providing an overview of the thresholding-based approach to lung segmentation. Graphs (a, b) show how the upper and lower threshold values (shown with red vertical lines in a, b) in Hounsfield units are adjusted to annotate the lungs on CT images (c, d). The suboptimal interval of attenuation in a results in excluded lung parenchyma (black regions in c) from the segmented lung regions (red), in comparison with the better attenuation interval in b, which results in better lung segmentation in d.
Figure 5c
Figure 5c
Schematic diagram providing an overview of the thresholding-based approach to lung segmentation. Graphs (a, b) show how the upper and lower threshold values (shown with red vertical lines in a, b) in Hounsfield units are adjusted to annotate the lungs on CT images (c, d). The suboptimal interval of attenuation in a results in excluded lung parenchyma (black regions in c) from the segmented lung regions (red), in comparison with the better attenuation interval in b, which results in better lung segmentation in d.
Figure 5d
Figure 5d
Schematic diagram providing an overview of the thresholding-based approach to lung segmentation. Graphs (a, b) show how the upper and lower threshold values (shown with red vertical lines in a, b) in Hounsfield units are adjusted to annotate the lungs on CT images (c, d). The suboptimal interval of attenuation in a results in excluded lung parenchyma (black regions in c) from the segmented lung regions (red), in comparison with the better attenuation interval in b, which results in better lung segmentation in d.
Figure 6a
Figure 6a
Inaccurate boundary identification. Blue contours are segmentation results for estimated lung boundaries. CT images show two examples of suboptimal results of thresholding-based delineation that are due to pleural effusions (a) and consolidations (b).
Figure 6b
Figure 6b
Inaccurate boundary identification. Blue contours are segmentation results for estimated lung boundaries. CT images show two examples of suboptimal results of thresholding-based delineation that are due to pleural effusions (a) and consolidations (b).
Figure 7a
Figure 7a
Diagrams of the general idea of region-based segmentation: Region-based segmentation approaches start with a seed point and then grow as they add neighboring pixels or voxels to the evolving annotation as long as the neighborhood criterion is satisfied. (a) Start of growing a region shows initial seed point (black circle) and directions of growth (arrows). (b) Growing process after a few iterations shows area grown so far (black area), current voxels being tested (gray circles), and potential directions of further growth (arrows). (c) Final segmentation (black area).
Figure 7b
Figure 7b
Diagrams of the general idea of region-based segmentation: Region-based segmentation approaches start with a seed point and then grow as they add neighboring pixels or voxels to the evolving annotation as long as the neighborhood criterion is satisfied. (a) Start of growing a region shows initial seed point (black circle) and directions of growth (arrows). (b) Growing process after a few iterations shows area grown so far (black area), current voxels being tested (gray circles), and potential directions of further growth (arrows). (c) Final segmentation (black area).
Figure 7c
Figure 7c
Diagrams of the general idea of region-based segmentation: Region-based segmentation approaches start with a seed point and then grow as they add neighboring pixels or voxels to the evolving annotation as long as the neighborhood criterion is satisfied. (a) Start of growing a region shows initial seed point (black circle) and directions of growth (arrows). (b) Growing process after a few iterations shows area grown so far (black area), current voxels being tested (gray circles), and potential directions of further growth (arrows). (c) Final segmentation (black area).
Figure 8
Figure 8
Flowchart of the region-based method of lung segmentation.
Figure 9a
Figure 9a
Example in which a single region-based segmentation approach was used to delineate multiple pulmonary structures. On a given CT image (a), the lung fields (green in d), airways (light blue in d), and cavity regions (blue in b, c) were all segmented by using the same region-based segmentation approach. On the final segmentation image (d), all structures were depicted together, along with multiple cavities (red).
Figure 9b
Figure 9b
Example in which a single region-based segmentation approach was used to delineate multiple pulmonary structures. On a given CT image (a), the lung fields (green in d), airways (light blue in d), and cavity regions (blue in b, c) were all segmented by using the same region-based segmentation approach. On the final segmentation image (d), all structures were depicted together, along with multiple cavities (red).
Figure 9c
Figure 9c
Example in which a single region-based segmentation approach was used to delineate multiple pulmonary structures. On a given CT image (a), the lung fields (green in d), airways (light blue in d), and cavity regions (blue in b, c) were all segmented by using the same region-based segmentation approach. On the final segmentation image (d), all structures were depicted together, along with multiple cavities (red).
Figure 9d
Figure 9d
Example in which a single region-based segmentation approach was used to delineate multiple pulmonary structures. On a given CT image (a), the lung fields (green in d), airways (light blue in d), and cavity regions (blue in b, c) were all segmented by using the same region-based segmentation approach. On the final segmentation image (d), all structures were depicted together, along with multiple cavities (red).
Figure 10a
Figure 10a
Potential failures of region-based segmentation methods. Six examples of potential failures of region-based segmentation methods show lung boundaries (red contours) and areas in which the algorithms fail (arrows). In particular, the structures that are excluded from lung segmentation are vascular structures (a, d), consolidations (b, c, f), and a pleural effusion (e). Compare with Figure 16, which shows optimal segmentation in similar cases with the use of the neighboring anatomy–guided segmentation method.
Figure 10b
Figure 10b
Potential failures of region-based segmentation methods. Six examples of potential failures of region-based segmentation methods show lung boundaries (red contours) and areas in which the algorithms fail (arrows). In particular, the structures that are excluded from lung segmentation are vascular structures (a, d), consolidations (b, c, f), and a pleural effusion (e). Compare with Figure 16, which shows optimal segmentation in similar cases with the use of the neighboring anatomy–guided segmentation method.
Figure 10c
Figure 10c
Potential failures of region-based segmentation methods. Six examples of potential failures of region-based segmentation methods show lung boundaries (red contours) and areas in which the algorithms fail (arrows). In particular, the structures that are excluded from lung segmentation are vascular structures (a, d), consolidations (b, c, f), and a pleural effusion (e). Compare with Figure 16, which shows optimal segmentation in similar cases with the use of the neighboring anatomy–guided segmentation method.
Figure 10d
Figure 10d
Potential failures of region-based segmentation methods. Six examples of potential failures of region-based segmentation methods show lung boundaries (red contours) and areas in which the algorithms fail (arrows). In particular, the structures that are excluded from lung segmentation are vascular structures (a, d), consolidations (b, c, f), and a pleural effusion (e). Compare with Figure 16, which shows optimal segmentation in similar cases with the use of the neighboring anatomy–guided segmentation method.
Figure 10e
Figure 10e
Potential failures of region-based segmentation methods. Six examples of potential failures of region-based segmentation methods show lung boundaries (red contours) and areas in which the algorithms fail (arrows). In particular, the structures that are excluded from lung segmentation are vascular structures (a, d), consolidations (b, c, f), and a pleural effusion (e). Compare with Figure 16, which shows optimal segmentation in similar cases with the use of the neighboring anatomy–guided segmentation method.
Figure 10f
Figure 10f
Potential failures of region-based segmentation methods. Six examples of potential failures of region-based segmentation methods show lung boundaries (red contours) and areas in which the algorithms fail (arrows). In particular, the structures that are excluded from lung segmentation are vascular structures (a, d), consolidations (b, c, f), and a pleural effusion (e). Compare with Figure 16, which shows optimal segmentation in similar cases with the use of the neighboring anatomy–guided segmentation method.
Figure 11
Figure 11
Generic overview flowchart of shape-based approaches to lung segmentation.
Figure 12a
Figure 12a
Atlas-based approach to lung segmentation. Atlas-based approaches often start with a template of the target organ (a). An image registration algorithm is then used to align the template to the target image such that the template can be transformed geometrically into the target image to identify lung tissues (b).
Figure 12b
Figure 12b
Atlas-based approach to lung segmentation. Atlas-based approaches often start with a template of the target organ (a). An image registration algorithm is then used to align the template to the target image such that the template can be transformed geometrically into the target image to identify lung tissues (b).
Figure 13a
Figure 13a
Example of a limitation of shape-based methods of lung segmentation. Because shape-based segmentation approaches assume a certain anatomic structure for the lungs, pathologic lungs with certain shape changes can be mis-segmented. In a severe case of scoliosis, although region- and thresholding-based methods performed well (b), a failure is observed with the shape-based method (a), with the boundary of the right lung (green contour) extending over the spine (arrow at left) and with the left lung boundary (green contour) spanning the medial left upper portion of the abdomen (arrow at right).
Figure 13b
Figure 13b
Example of a limitation of shape-based methods of lung segmentation. Because shape-based segmentation approaches assume a certain anatomic structure for the lungs, pathologic lungs with certain shape changes can be mis-segmented. In a severe case of scoliosis, although region- and thresholding-based methods performed well (b), a failure is observed with the shape-based method (a), with the boundary of the right lung (green contour) extending over the spine (arrow at left) and with the left lung boundary (green contour) spanning the medial left upper portion of the abdomen (arrow at right).
Figure 14
Figure 14
Schematic diagrams provide an overview of the neighboring anatomy–guided method of segmentation. With this approach, individual organs can be identified on the basis of their expected locations.
Figure 15
Figure 15
Flowchart of the neighboring anatomy–guided method of lung segmentation.
Figure 16a
Figure 16a
Examples of cases (large amounts of pleural fluid and extensive atelectasis) in which neighboring anatomy–guided segmentation methods produced successful lung delineations (red contours) on axial (a–c) and coronal (d–f) CT images.
Figure 16b
Figure 16b
Examples of cases (large amounts of pleural fluid and extensive atelectasis) in which neighboring anatomy–guided segmentation methods produced successful lung delineations (red contours) on axial (a–c) and coronal (d–f) CT images.
Figure 16c
Figure 16c
Examples of cases (large amounts of pleural fluid and extensive atelectasis) in which neighboring anatomy–guided segmentation methods produced successful lung delineations (red contours) on axial (a–c) and coronal (d–f) CT images.
Figure 16d
Figure 16d
Examples of cases (large amounts of pleural fluid and extensive atelectasis) in which neighboring anatomy–guided segmentation methods produced successful lung delineations (red contours) on axial (a–c) and coronal (d–f) CT images.
Figure 16e
Figure 16e
Examples of cases (large amounts of pleural fluid and extensive atelectasis) in which neighboring anatomy–guided segmentation methods produced successful lung delineations (red contours) on axial (a–c) and coronal (d–f) CT images.
Figure 16f
Figure 16f
Examples of cases (large amounts of pleural fluid and extensive atelectasis) in which neighboring anatomy–guided segmentation methods produced successful lung delineations (red contours) on axial (a–c) and coronal (d–f) CT images.
Figure 17
Figure 17
Image patches. The five most commonly observed and used normal and abnormal imaging patterns are shown as image patches. Because machine learning–based classification algorithms often require supervised training for abnormalities, image patches (ie, small image blocks) will be extracted and used in the determination of normal and abnormal classes for the classification process during the lung segmentation. GGO = ground-glass opacity.
Figure 18
Figure 18
Flowchart of machine learning–based lung segmentation. First, a model is built by using features extracted from reference image data (see Fig 17). Then, for any given test image, newly extracted features are used to define the pixel classes: pathologic condition or normal.
Figure 19a
Figure 19a
Examples of successful machine learning–based segmentation. Machine learning–based methods can identify various abnormal imaging patterns (green areas), such as consolidation and an atelectatic segment of the lingula (a), areas of ground-glass opacity (b), brochiectatic air bronchograms (c), patchy consolidation and a cavity (d), and consolidation and crazy-paving pattern (e). Because of these successful depictions, the final lung delineations were not erroneous.
Figure 19b
Figure 19b
Examples of successful machine learning–based segmentation. Machine learning–based methods can identify various abnormal imaging patterns (green areas), such as consolidation and an atelectatic segment of the lingula (a), areas of ground-glass opacity (b), brochiectatic air bronchograms (c), patchy consolidation and a cavity (d), and consolidation and crazy-paving pattern (e). Because of these successful depictions, the final lung delineations were not erroneous.
Figure 19c
Figure 19c
Examples of successful machine learning–based segmentation. Machine learning–based methods can identify various abnormal imaging patterns (green areas), such as consolidation and an atelectatic segment of the lingula (a), areas of ground-glass opacity (b), brochiectatic air bronchograms (c), patchy consolidation and a cavity (d), and consolidation and crazy-paving pattern (e). Because of these successful depictions, the final lung delineations were not erroneous.
Figure 19d
Figure 19d
Examples of successful machine learning–based segmentation. Machine learning–based methods can identify various abnormal imaging patterns (green areas), such as consolidation and an atelectatic segment of the lingula (a), areas of ground-glass opacity (b), brochiectatic air bronchograms (c), patchy consolidation and a cavity (d), and consolidation and crazy-paving pattern (e). Because of these successful depictions, the final lung delineations were not erroneous.
Figure 19e
Figure 19e
Examples of successful machine learning–based segmentation. Machine learning–based methods can identify various abnormal imaging patterns (green areas), such as consolidation and an atelectatic segment of the lingula (a), areas of ground-glass opacity (b), brochiectatic air bronchograms (c), patchy consolidation and a cavity (d), and consolidation and crazy-paving pattern (e). Because of these successful depictions, the final lung delineations were not erroneous.
Figure 20a
Figure 20a
Schematic diagrams of sensitivity and specificity metrics with color-coded condition–test outcome pairs: true positive (TP) (green area), true negative (TN) (white area), false positive (FP) (yellow area), and false negative (FN) (blue area). (a) Sensitivity = 94.69%; specificity = 94.19%. (b) Sensitivity = 72.99%; specificity = 78.16%. VGT = reference standard segmentation (ground truth), Vtest = lung segmentation (brown area) obtained by using any of the segmentation methods.
Figure 20b
Figure 20b
Schematic diagrams of sensitivity and specificity metrics with color-coded condition–test outcome pairs: true positive (TP) (green area), true negative (TN) (white area), false positive (FP) (yellow area), and false negative (FN) (blue area). (a) Sensitivity = 94.69%; specificity = 94.19%. (b) Sensitivity = 72.99%; specificity = 78.16%. VGT = reference standard segmentation (ground truth), Vtest = lung segmentation (brown area) obtained by using any of the segmentation methods.

Similar articles

Cited by

References

    1. Twair AA, Torreggiani WC, Mahmud SM, Ramesh N, Hogan B. Significant savings in radiologic report turnaround time after implementation of a complete picture archiving and communication system (PACS). J Digit Imaging 2000;13(4):175–177. - PMC - PubMed
    1. Hu S, Hoffman EA, Reinhardt JM. Automatic lung segmentation for accurate quantitation of volumetric X-ray CT images. IEEE Trans Med Imaging 2001;20(6):490–498. - PubMed
    1. Bagci U, Chen X, Udupa JK. Hierarchical scale-based multiobject recognition of 3-D anatomical structures. IEEE Trans Med Imaging 2012;31(3):777–789. - PubMed
    1. Marr D, Poggio T. A computational theory of human stereo vision. Proc R Soc Lond B Biol Sci 1979;204(1156):301–328. - PubMed
    1. Poggio T, Ullman S. Vision: are models of object recognition catching up with the brain? Ann N Y Acad Sci 2013;1305: 72–82. - PubMed

Publication types

MeSH terms