Review
. 2015 Jul-Aug;35(4):1295-313.
doi: 10.1148/rg.2015140313.

Role of MR Imaging and FDG PET/CT in Selection and Follow-up of Patients Treated with Pelvic Exenteration for Gynecologic Malignancies

Affiliations
Review

Role of MR Imaging and FDG PET/CT in Selection and Follow-up of Patients Treated with Pelvic Exenteration for Gynecologic Malignancies

Yulia Lakhman et al. Radiographics. 2015 Jul-Aug.

Abstract

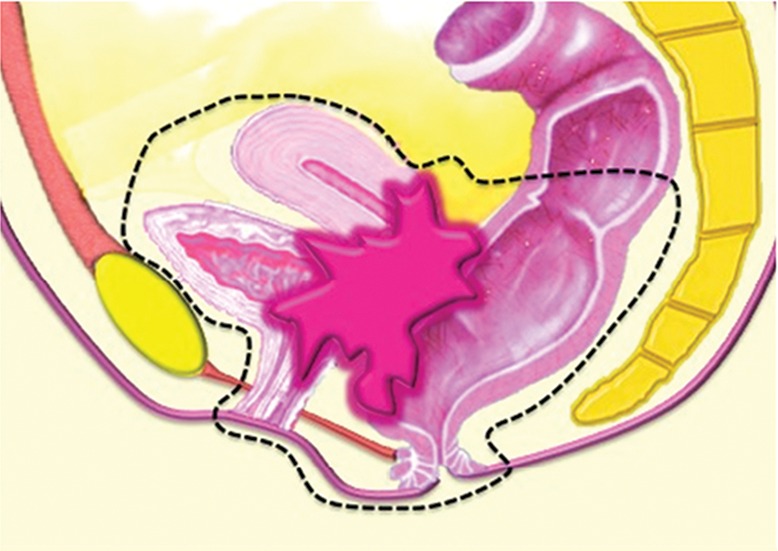
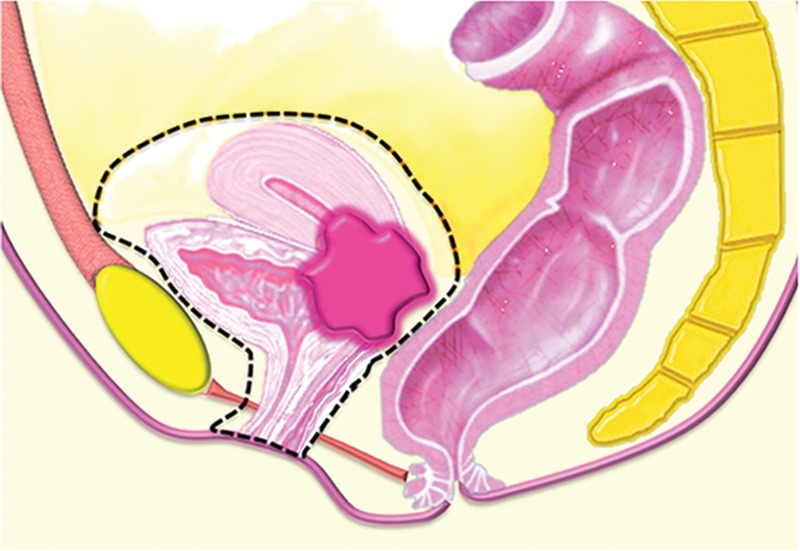
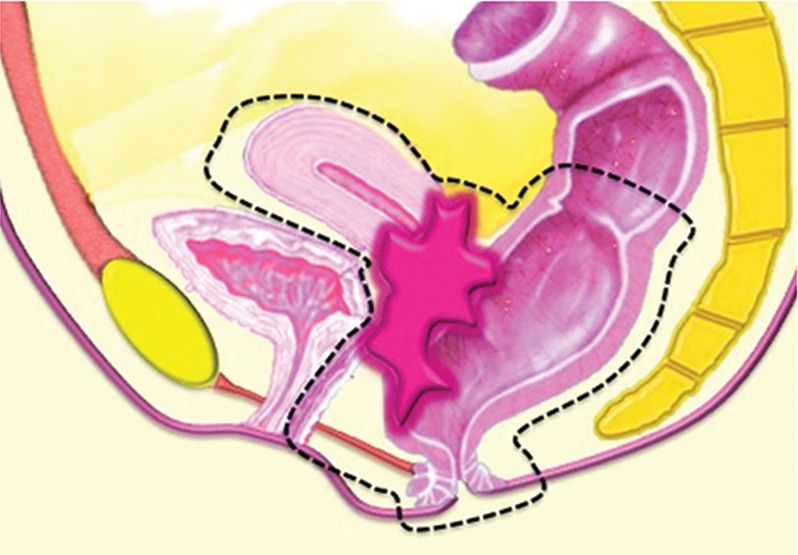
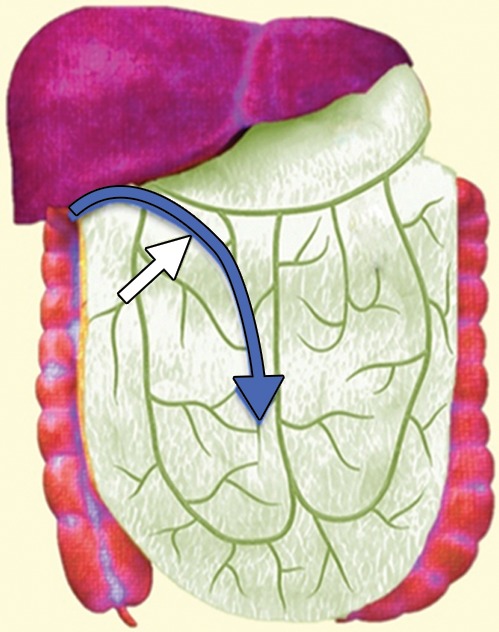
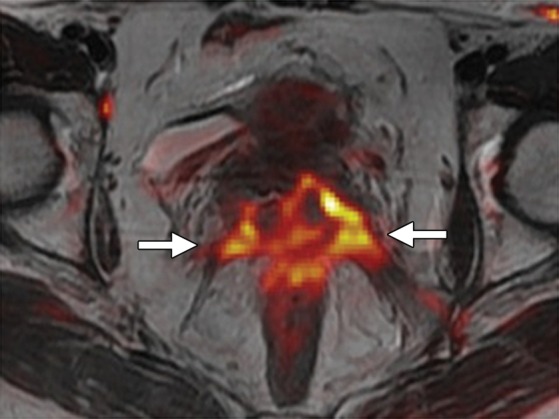
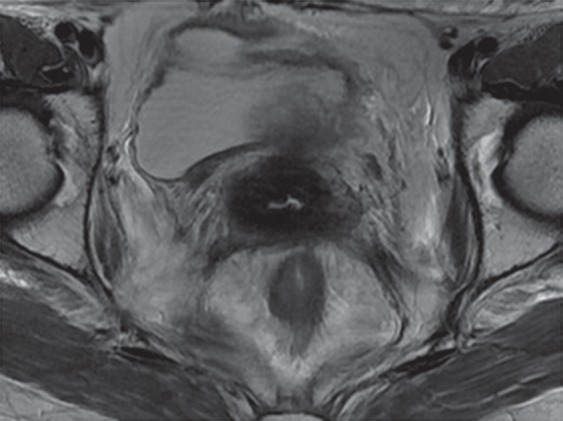
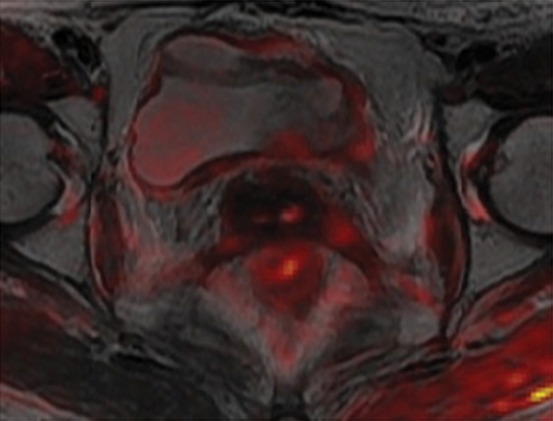
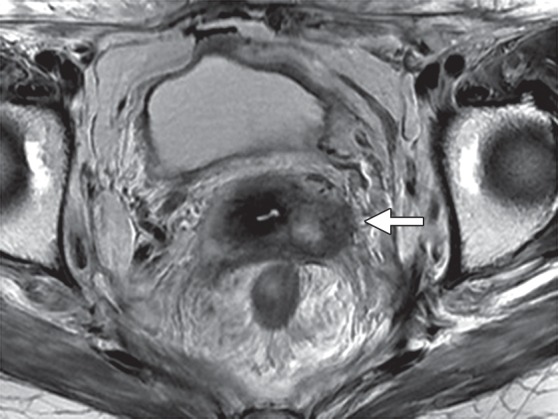
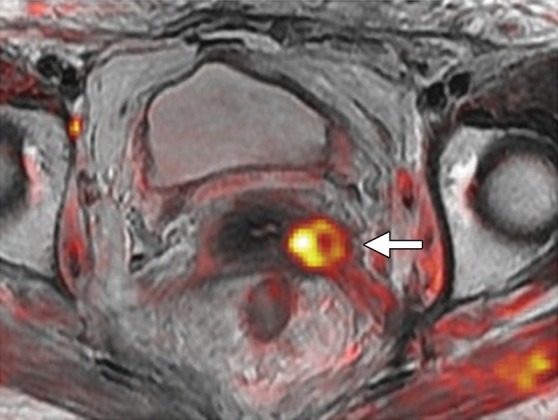
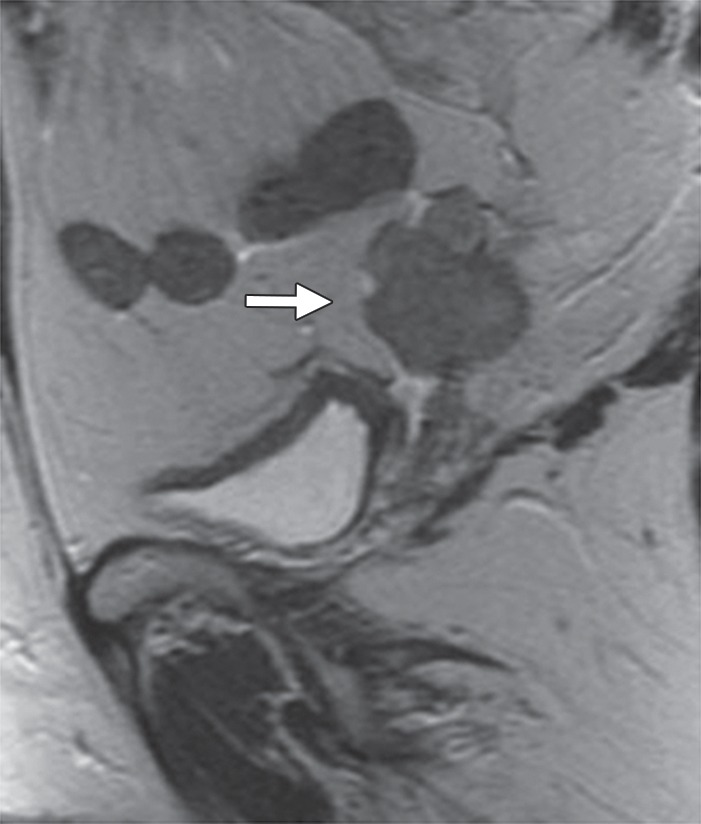
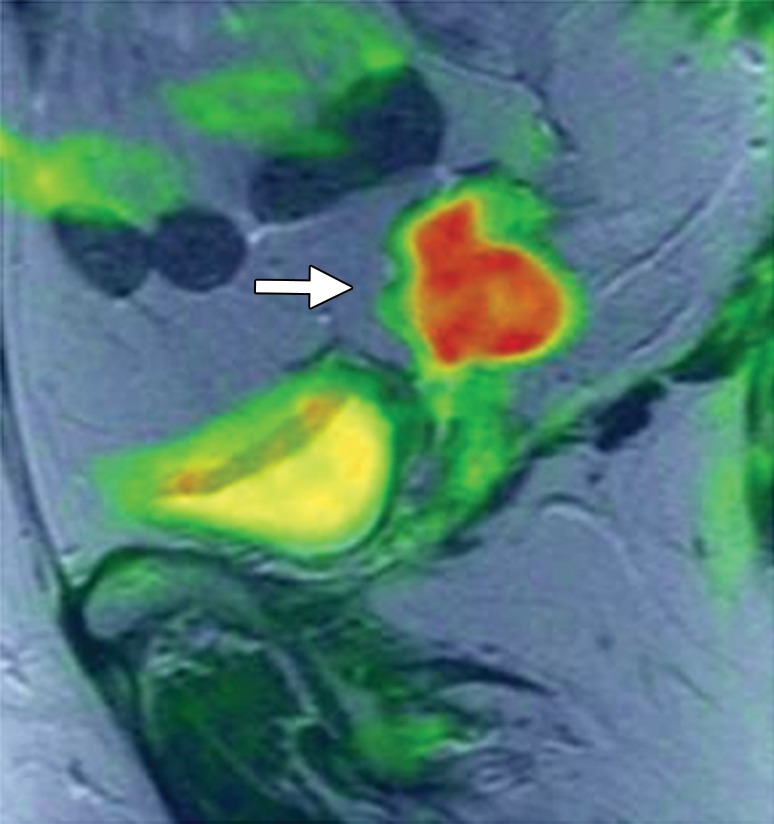
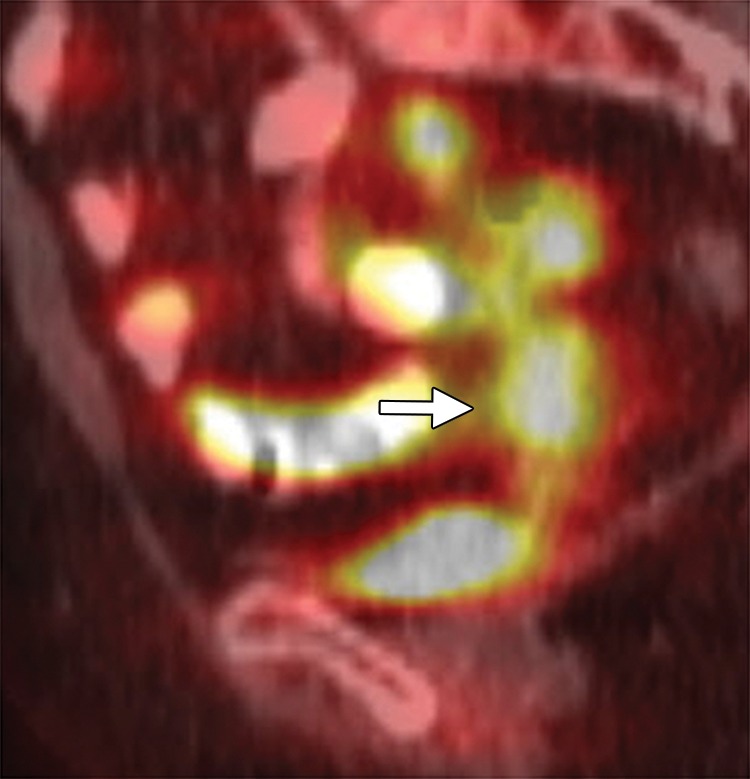
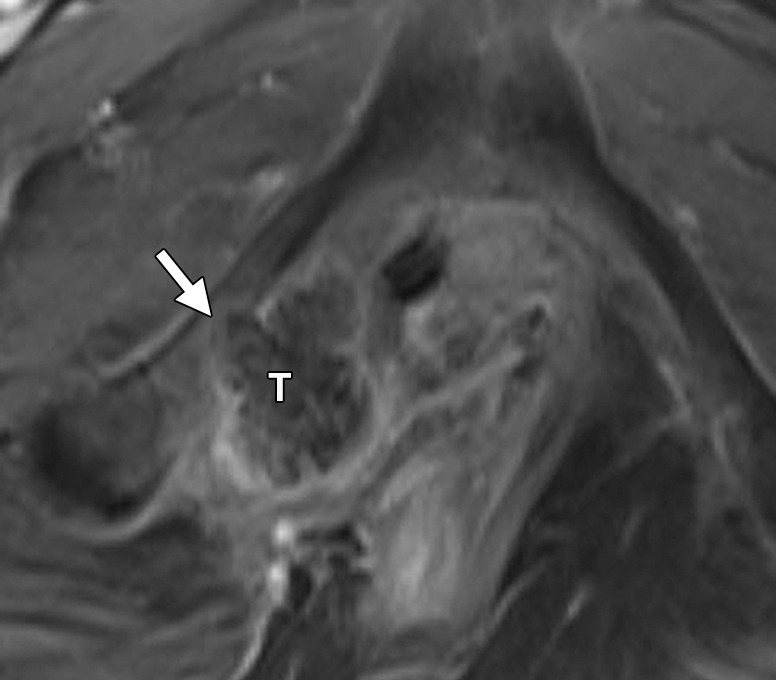
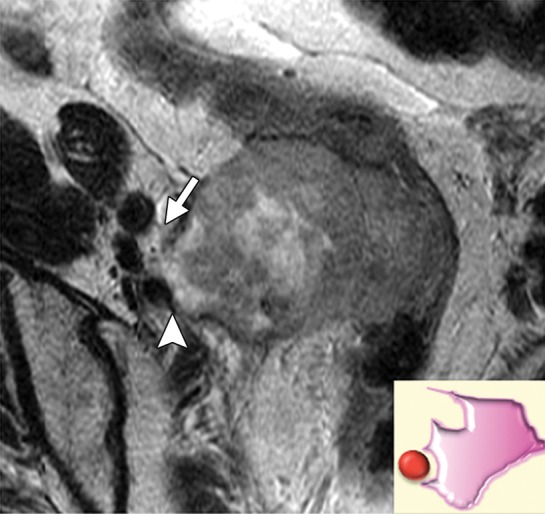
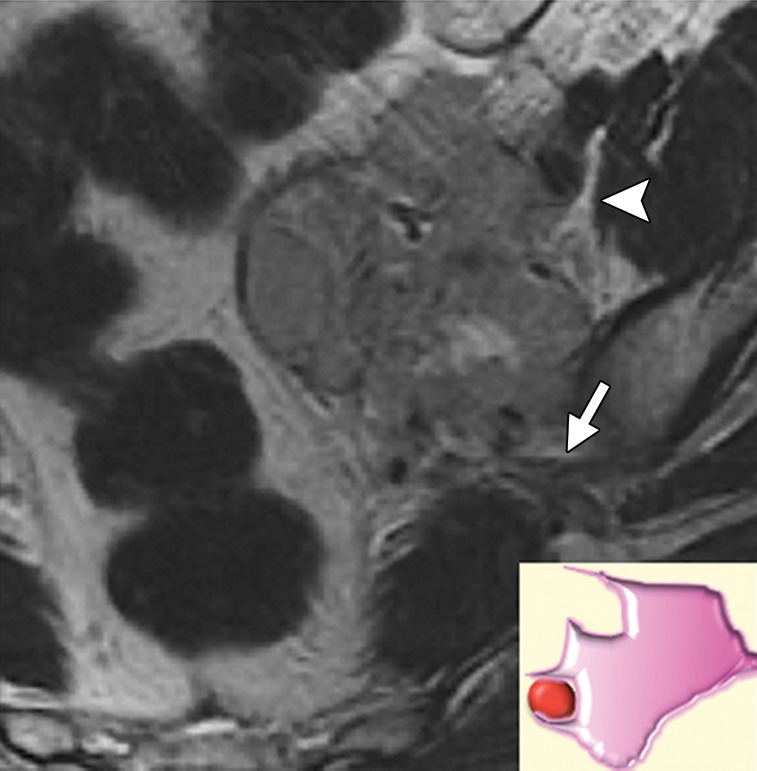
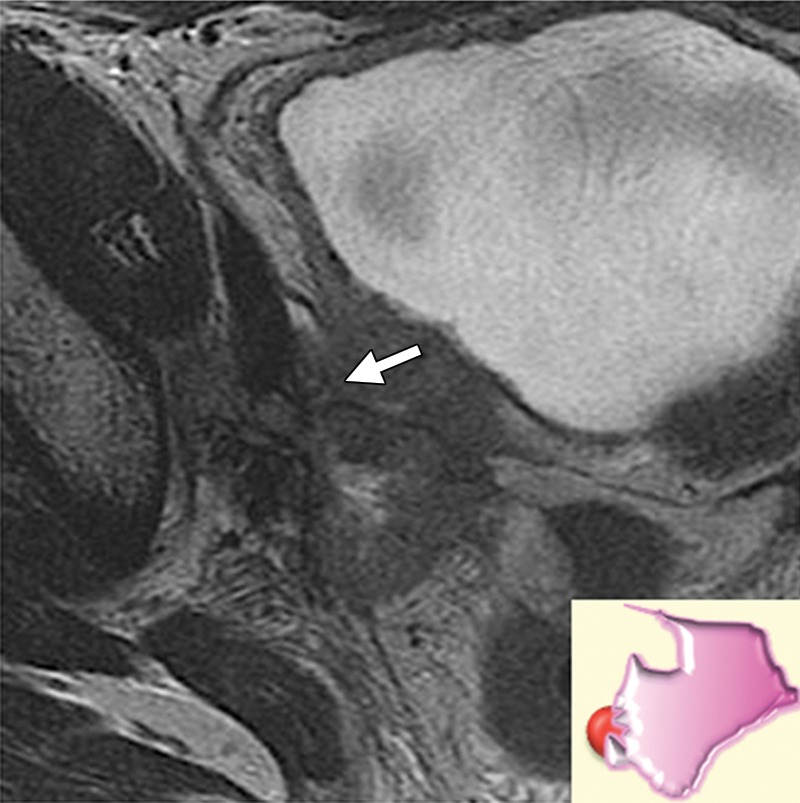
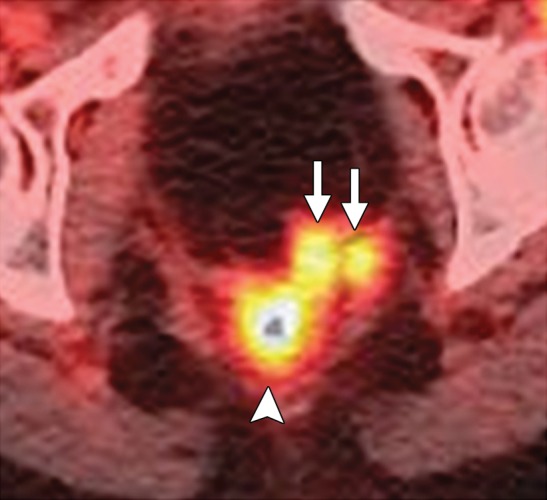
Pelvic exenteration (PE) is a radical surgical procedure used for the past 6 decades to treat locally advanced malignant diseases confined to the pelvis, particularly persistent or recurrent gynecologic cancers in the irradiated pelvis. The traditional surgical technique known as total PE consists of resection of all pelvic viscera followed by reconstruction. Depending on the tumor extent, the procedure can be tailored to remove only anterior or posterior structures, including the bladder (anterior exenteration) or rectum (posterior exenteration). Conversely, more extended pelvic resection can be performed if the pelvic sidewall is invaded by cancer. Preoperative imaging evaluation with magnetic resonance (MR) imaging and fluorine 18 fluorodeoxyglucose (FDG) positron emission tomography/computed tomography (PET/CT) is central to establishing tumor resectability and therefore patient eligibility for the procedure. These imaging modalities complement each other in diagnosis of tumor recurrence and differentiation of persistent disease from posttreatment changes. MR imaging can accurately demonstrate local tumor extent and show adjacent organ invasion. FDG PET/CT is useful in excluding nodal and distant metastases. In addition, FDG PET/CT metrics may serve as predictive biomarkers for overall and disease-free survival. This pictorial review describes different types of exenterative surgical procedures and illustrates the central role of imaging in accurate patient selection, treatment planning, and postsurgical surveillance.


Figures

Figure 1a
Figure 1a
Major types of PE procedures. (a) Total PE involves resection of the female reproductive organs, lower urinary tract (urinary bladder and urethra), rectosigmoid colon, and anus. (b) Anterior PE involves resection of the female reproductive organs and lower urinary tract but spares the rectum and anus. (c) Posterior PE involves resection of the female reproductive organs, rectum, and anus but spares the lower urinary tract.
Figure 1b
Figure 1b
Major types of PE procedures. (a) Total PE involves resection of the female reproductive organs, lower urinary tract (urinary bladder and urethra), rectosigmoid colon, and anus. (b) Anterior PE involves resection of the female reproductive organs and lower urinary tract but spares the rectum and anus. (c) Posterior PE involves resection of the female reproductive organs, rectum, and anus but spares the lower urinary tract.
Figure 1c
Figure 1c
Major types of PE procedures. (a) Total PE involves resection of the female reproductive organs, lower urinary tract (urinary bladder and urethra), rectosigmoid colon, and anus. (b) Anterior PE involves resection of the female reproductive organs and lower urinary tract but spares the rectum and anus. (c) Posterior PE involves resection of the female reproductive organs, rectum, and anus but spares the lower urinary tract.
Figure 2a
Figure 2a
(a) Drawing shows the anatomy of the omental pedicle flap. Greater omentum, composed largely of fat and lymph nodes, is used for omental pedicle flaps. The greater omentum hangs down from the greater curvature of the stomach and is supplied by the right and left gastroepiploic arteries. The vascular supply of the omental flap is based on the arterial arcades arising from the right or left gastroepiploic arteries (blue and white arrows = dissection plane from the right gastroepiploic artery). The flap is dissected from the greater curvature of the stomach and the transverse colon, tunneled via one of the paracolic gutters, and placed into the pelvis (blue arrow). (b) Drawing shows an omental pedicle flap (blue arrow) filling pelvic dead space created by the surgical resection. (c) Unenhanced axial CT image, obtained in a 63-year-old patient with recurrent cervical carcinoma who underwent total PE and pelvic reconstruction, shows an omental pedicle flap, evident as prominent fatty tissue in the pelvis (arrow). (d) Drawing shows the anatomy of the gracilis myocutaneous flap. The vascular supply of the gracilis flap is derived from the medial femoral circumflex artery. First, the skin is incised and the gracilis muscle is exposed, then the main vascular pedicle is identified and preserved. After the proximal and distal muscle attachments are divided, the flap is tunneled through the subcutaneous skin into the vaginal defect and brought out through the introitus. The bilateral flaps are sutured to each other in the midline. The neovagina is shaped into a pouch and then inserted into the pelvic space that is left after the exenteration. The proximal end of the neovagina is sutured to the introitus. (e) Contrast-enhanced axial CT image obtained in a 60-year-old patient with recurrent cervical carcinoma who underwent anterior PE shows vaginal reconstruction with bilateral gracilis myocutaneous flaps (white arrows). The small amount of air in the neovagina (black arrow) is a normal imaging finding.
Figure 2b
Figure 2b
(a) Drawing shows the anatomy of the omental pedicle flap. Greater omentum, composed largely of fat and lymph nodes, is used for omental pedicle flaps. The greater omentum hangs down from the greater curvature of the stomach and is supplied by the right and left gastroepiploic arteries. The vascular supply of the omental flap is based on the arterial arcades arising from the right or left gastroepiploic arteries (blue and white arrows = dissection plane from the right gastroepiploic artery). The flap is dissected from the greater curvature of the stomach and the transverse colon, tunneled via one of the paracolic gutters, and placed into the pelvis (blue arrow). (b) Drawing shows an omental pedicle flap (blue arrow) filling pelvic dead space created by the surgical resection. (c) Unenhanced axial CT image, obtained in a 63-year-old patient with recurrent cervical carcinoma who underwent total PE and pelvic reconstruction, shows an omental pedicle flap, evident as prominent fatty tissue in the pelvis (arrow). (d) Drawing shows the anatomy of the gracilis myocutaneous flap. The vascular supply of the gracilis flap is derived from the medial femoral circumflex artery. First, the skin is incised and the gracilis muscle is exposed, then the main vascular pedicle is identified and preserved. After the proximal and distal muscle attachments are divided, the flap is tunneled through the subcutaneous skin into the vaginal defect and brought out through the introitus. The bilateral flaps are sutured to each other in the midline. The neovagina is shaped into a pouch and then inserted into the pelvic space that is left after the exenteration. The proximal end of the neovagina is sutured to the introitus. (e) Contrast-enhanced axial CT image obtained in a 60-year-old patient with recurrent cervical carcinoma who underwent anterior PE shows vaginal reconstruction with bilateral gracilis myocutaneous flaps (white arrows). The small amount of air in the neovagina (black arrow) is a normal imaging finding.
Figure 2c
Figure 2c
(a) Drawing shows the anatomy of the omental pedicle flap. Greater omentum, composed largely of fat and lymph nodes, is used for omental pedicle flaps. The greater omentum hangs down from the greater curvature of the stomach and is supplied by the right and left gastroepiploic arteries. The vascular supply of the omental flap is based on the arterial arcades arising from the right or left gastroepiploic arteries (blue and white arrows = dissection plane from the right gastroepiploic artery). The flap is dissected from the greater curvature of the stomach and the transverse colon, tunneled via one of the paracolic gutters, and placed into the pelvis (blue arrow). (b) Drawing shows an omental pedicle flap (blue arrow) filling pelvic dead space created by the surgical resection. (c) Unenhanced axial CT image, obtained in a 63-year-old patient with recurrent cervical carcinoma who underwent total PE and pelvic reconstruction, shows an omental pedicle flap, evident as prominent fatty tissue in the pelvis (arrow). (d) Drawing shows the anatomy of the gracilis myocutaneous flap. The vascular supply of the gracilis flap is derived from the medial femoral circumflex artery. First, the skin is incised and the gracilis muscle is exposed, then the main vascular pedicle is identified and preserved. After the proximal and distal muscle attachments are divided, the flap is tunneled through the subcutaneous skin into the vaginal defect and brought out through the introitus. The bilateral flaps are sutured to each other in the midline. The neovagina is shaped into a pouch and then inserted into the pelvic space that is left after the exenteration. The proximal end of the neovagina is sutured to the introitus. (e) Contrast-enhanced axial CT image obtained in a 60-year-old patient with recurrent cervical carcinoma who underwent anterior PE shows vaginal reconstruction with bilateral gracilis myocutaneous flaps (white arrows). The small amount of air in the neovagina (black arrow) is a normal imaging finding.
Figure 2d
Figure 2d
(a) Drawing shows the anatomy of the omental pedicle flap. Greater omentum, composed largely of fat and lymph nodes, is used for omental pedicle flaps. The greater omentum hangs down from the greater curvature of the stomach and is supplied by the right and left gastroepiploic arteries. The vascular supply of the omental flap is based on the arterial arcades arising from the right or left gastroepiploic arteries (blue and white arrows = dissection plane from the right gastroepiploic artery). The flap is dissected from the greater curvature of the stomach and the transverse colon, tunneled via one of the paracolic gutters, and placed into the pelvis (blue arrow). (b) Drawing shows an omental pedicle flap (blue arrow) filling pelvic dead space created by the surgical resection. (c) Unenhanced axial CT image, obtained in a 63-year-old patient with recurrent cervical carcinoma who underwent total PE and pelvic reconstruction, shows an omental pedicle flap, evident as prominent fatty tissue in the pelvis (arrow). (d) Drawing shows the anatomy of the gracilis myocutaneous flap. The vascular supply of the gracilis flap is derived from the medial femoral circumflex artery. First, the skin is incised and the gracilis muscle is exposed, then the main vascular pedicle is identified and preserved. After the proximal and distal muscle attachments are divided, the flap is tunneled through the subcutaneous skin into the vaginal defect and brought out through the introitus. The bilateral flaps are sutured to each other in the midline. The neovagina is shaped into a pouch and then inserted into the pelvic space that is left after the exenteration. The proximal end of the neovagina is sutured to the introitus. (e) Contrast-enhanced axial CT image obtained in a 60-year-old patient with recurrent cervical carcinoma who underwent anterior PE shows vaginal reconstruction with bilateral gracilis myocutaneous flaps (white arrows). The small amount of air in the neovagina (black arrow) is a normal imaging finding.
Figure 2e
Figure 2e
(a) Drawing shows the anatomy of the omental pedicle flap. Greater omentum, composed largely of fat and lymph nodes, is used for omental pedicle flaps. The greater omentum hangs down from the greater curvature of the stomach and is supplied by the right and left gastroepiploic arteries. The vascular supply of the omental flap is based on the arterial arcades arising from the right or left gastroepiploic arteries (blue and white arrows = dissection plane from the right gastroepiploic artery). The flap is dissected from the greater curvature of the stomach and the transverse colon, tunneled via one of the paracolic gutters, and placed into the pelvis (blue arrow). (b) Drawing shows an omental pedicle flap (blue arrow) filling pelvic dead space created by the surgical resection. (c) Unenhanced axial CT image, obtained in a 63-year-old patient with recurrent cervical carcinoma who underwent total PE and pelvic reconstruction, shows an omental pedicle flap, evident as prominent fatty tissue in the pelvis (arrow). (d) Drawing shows the anatomy of the gracilis myocutaneous flap. The vascular supply of the gracilis flap is derived from the medial femoral circumflex artery. First, the skin is incised and the gracilis muscle is exposed, then the main vascular pedicle is identified and preserved. After the proximal and distal muscle attachments are divided, the flap is tunneled through the subcutaneous skin into the vaginal defect and brought out through the introitus. The bilateral flaps are sutured to each other in the midline. The neovagina is shaped into a pouch and then inserted into the pelvic space that is left after the exenteration. The proximal end of the neovagina is sutured to the introitus. (e) Contrast-enhanced axial CT image obtained in a 60-year-old patient with recurrent cervical carcinoma who underwent anterior PE shows vaginal reconstruction with bilateral gracilis myocutaneous flaps (white arrows). The small amount of air in the neovagina (black arrow) is a normal imaging finding.
Figure 3
Figure 3
Key points that should be part of the MR imaging report. A comprehensive report should describe the presence, location, and size of the tumor. It should inform regarding the probability of urinary bladder, urethral, rectal, anal, and pelvic sidewall invasion (illustrated by tumor A). It should state the likelihood of vascular (common and external iliac) and neural (lumbosacral plexus and sciatic nerve) involvement (illustrated by tumor B). Potential contraindications to the surgery such as vascular or neural encasement and bone invasion (illustrated by tumor B) should be stated. In addition, the presence of lymphadenopathy, peritoneal implants, and distant metastases should be described in the imaging report.
Figure 4a
Figure 4a
Overcorrection artifact in a 40-year-old patient with cervical carcinoma treated with CRT. (a) Axial FDG PET/CT image shows a hypermetabolic focus in the vaginal vault (arrow). (b) Coronal CT image shows a cluster of brachytherapy seeds (arrow) corresponding to the hypermetabolic region in a.
Figure 4b
Figure 4b
Overcorrection artifact in a 40-year-old patient with cervical carcinoma treated with CRT. (a) Axial FDG PET/CT image shows a hypermetabolic focus in the vaginal vault (arrow). (b) Coronal CT image shows a cluster of brachytherapy seeds (arrow) corresponding to the hypermetabolic region in a.
Figure 5a
Figure 5a
MR imaging evaluation of treatment response in a 55-year-old patient with squamous cell carcinoma of the cervix treated with CRT. (a, b) Pretreatment axial FSE T2-weighted (a) and fused T2-weighted and DW (b) images show a large mildly T2-hyperintense cervical tumor (arrows) with parametrial extension and restricted diffusion. (c, d) Axial FSE T2-weighted (c) and fused T2-weighted and DW (d) images obtained shortly after completion of CRT show reconstitution of the low-signal-intensity cervical stroma and resolution of the restricted diffusion. (e, f) Axial FSE T2-weighted (e) and fused T2-weighted and DW (f) images obtained 7 months after CRT show mildly T2-hyperintense recurrent tumor with restricted diffusion (arrow). (Case courtesy of Shinya Fujii, MD, PhD, Tottori University, Tottori, Japan.)
Figure 5b
Figure 5b
MR imaging evaluation of treatment response in a 55-year-old patient with squamous cell carcinoma of the cervix treated with CRT. (a, b) Pretreatment axial FSE T2-weighted (a) and fused T2-weighted and DW (b) images show a large mildly T2-hyperintense cervical tumor (arrows) with parametrial extension and restricted diffusion. (c, d) Axial FSE T2-weighted (c) and fused T2-weighted and DW (d) images obtained shortly after completion of CRT show reconstitution of the low-signal-intensity cervical stroma and resolution of the restricted diffusion. (e, f) Axial FSE T2-weighted (e) and fused T2-weighted and DW (f) images obtained 7 months after CRT show mildly T2-hyperintense recurrent tumor with restricted diffusion (arrow). (Case courtesy of Shinya Fujii, MD, PhD, Tottori University, Tottori, Japan.)
Figure 5c
Figure 5c
MR imaging evaluation of treatment response in a 55-year-old patient with squamous cell carcinoma of the cervix treated with CRT. (a, b) Pretreatment axial FSE T2-weighted (a) and fused T2-weighted and DW (b) images show a large mildly T2-hyperintense cervical tumor (arrows) with parametrial extension and restricted diffusion. (c, d) Axial FSE T2-weighted (c) and fused T2-weighted and DW (d) images obtained shortly after completion of CRT show reconstitution of the low-signal-intensity cervical stroma and resolution of the restricted diffusion. (e, f) Axial FSE T2-weighted (e) and fused T2-weighted and DW (f) images obtained 7 months after CRT show mildly T2-hyperintense recurrent tumor with restricted diffusion (arrow). (Case courtesy of Shinya Fujii, MD, PhD, Tottori University, Tottori, Japan.)
Figure 5d
Figure 5d
MR imaging evaluation of treatment response in a 55-year-old patient with squamous cell carcinoma of the cervix treated with CRT. (a, b) Pretreatment axial FSE T2-weighted (a) and fused T2-weighted and DW (b) images show a large mildly T2-hyperintense cervical tumor (arrows) with parametrial extension and restricted diffusion. (c, d) Axial FSE T2-weighted (c) and fused T2-weighted and DW (d) images obtained shortly after completion of CRT show reconstitution of the low-signal-intensity cervical stroma and resolution of the restricted diffusion. (e, f) Axial FSE T2-weighted (e) and fused T2-weighted and DW (f) images obtained 7 months after CRT show mildly T2-hyperintense recurrent tumor with restricted diffusion (arrow). (Case courtesy of Shinya Fujii, MD, PhD, Tottori University, Tottori, Japan.)
Figure 5e
Figure 5e
MR imaging evaluation of treatment response in a 55-year-old patient with squamous cell carcinoma of the cervix treated with CRT. (a, b) Pretreatment axial FSE T2-weighted (a) and fused T2-weighted and DW (b) images show a large mildly T2-hyperintense cervical tumor (arrows) with parametrial extension and restricted diffusion. (c, d) Axial FSE T2-weighted (c) and fused T2-weighted and DW (d) images obtained shortly after completion of CRT show reconstitution of the low-signal-intensity cervical stroma and resolution of the restricted diffusion. (e, f) Axial FSE T2-weighted (e) and fused T2-weighted and DW (f) images obtained 7 months after CRT show mildly T2-hyperintense recurrent tumor with restricted diffusion (arrow). (Case courtesy of Shinya Fujii, MD, PhD, Tottori University, Tottori, Japan.)
Figure 5f
Figure 5f
MR imaging evaluation of treatment response in a 55-year-old patient with squamous cell carcinoma of the cervix treated with CRT. (a, b) Pretreatment axial FSE T2-weighted (a) and fused T2-weighted and DW (b) images show a large mildly T2-hyperintense cervical tumor (arrows) with parametrial extension and restricted diffusion. (c, d) Axial FSE T2-weighted (c) and fused T2-weighted and DW (d) images obtained shortly after completion of CRT show reconstitution of the low-signal-intensity cervical stroma and resolution of the restricted diffusion. (e, f) Axial FSE T2-weighted (e) and fused T2-weighted and DW (f) images obtained 7 months after CRT show mildly T2-hyperintense recurrent tumor with restricted diffusion (arrow). (Case courtesy of Shinya Fujii, MD, PhD, Tottori University, Tottori, Japan.)
Figure 6a
Figure 6a
Recurrent cervical carcinoma after radical hysterectomy in a 60-year-old patient. (a, b) Sagittal FSE T2-weighted (a) and fused T2-weighted and DW (b) images show a mildly T2-hyperintense mass with restricted diffusion (arrow) immediately superior to the vaginal cuff. (c) Sagittal FDG PET/CT image shows hypermetabolic recurrent tumor (arrow).
Figure 6b
Figure 6b
Recurrent cervical carcinoma after radical hysterectomy in a 60-year-old patient. (a, b) Sagittal FSE T2-weighted (a) and fused T2-weighted and DW (b) images show a mildly T2-hyperintense mass with restricted diffusion (arrow) immediately superior to the vaginal cuff. (c) Sagittal FDG PET/CT image shows hypermetabolic recurrent tumor (arrow).
Figure 6c
Figure 6c
Recurrent cervical carcinoma after radical hysterectomy in a 60-year-old patient. (a, b) Sagittal FSE T2-weighted (a) and fused T2-weighted and DW (b) images show a mildly T2-hyperintense mass with restricted diffusion (arrow) immediately superior to the vaginal cuff. (c) Sagittal FDG PET/CT image shows hypermetabolic recurrent tumor (arrow).
Figure 7a
Figure 7a
Assessment of urinary bladder invasion by tumor. (a) Preserved fat plane next to the urinary bladder, excluding bladder invasion. (b) Recurrent tumor abutting the bladder wall, possibly representing serosal involvement. (c) Interruption of the muscular layer of the bladder by tumor, consistent with muscle invasion. (d) Recurrent tumor invading through the bladder wall with tumor nodules in the mucosal layer, consistent with mucosal involvement. (e) Submucosal bullous edema due to acute radiation-induced cystitis. (f) Spiculated tumor with frank posterior bladder wall invasion and vesicovaginal fistula.
Figure 7b
Figure 7b
Assessment of urinary bladder invasion by tumor. (a) Preserved fat plane next to the urinary bladder, excluding bladder invasion. (b) Recurrent tumor abutting the bladder wall, possibly representing serosal involvement. (c) Interruption of the muscular layer of the bladder by tumor, consistent with muscle invasion. (d) Recurrent tumor invading through the bladder wall with tumor nodules in the mucosal layer, consistent with mucosal involvement. (e) Submucosal bullous edema due to acute radiation-induced cystitis. (f) Spiculated tumor with frank posterior bladder wall invasion and vesicovaginal fistula.
Figure 7c
Figure 7c
Assessment of urinary bladder invasion by tumor. (a) Preserved fat plane next to the urinary bladder, excluding bladder invasion. (b) Recurrent tumor abutting the bladder wall, possibly representing serosal involvement. (c) Interruption of the muscular layer of the bladder by tumor, consistent with muscle invasion. (d) Recurrent tumor invading through the bladder wall with tumor nodules in the mucosal layer, consistent with mucosal involvement. (e) Submucosal bullous edema due to acute radiation-induced cystitis. (f) Spiculated tumor with frank posterior bladder wall invasion and vesicovaginal fistula.
Figure 7d
Figure 7d
Assessment of urinary bladder invasion by tumor. (a) Preserved fat plane next to the urinary bladder, excluding bladder invasion. (b) Recurrent tumor abutting the bladder wall, possibly representing serosal involvement. (c) Interruption of the muscular layer of the bladder by tumor, consistent with muscle invasion. (d) Recurrent tumor invading through the bladder wall with tumor nodules in the mucosal layer, consistent with mucosal involvement. (e) Submucosal bullous edema due to acute radiation-induced cystitis. (f) Spiculated tumor with frank posterior bladder wall invasion and vesicovaginal fistula.
Figure 7e
Figure 7e
Assessment of urinary bladder invasion by tumor. (a) Preserved fat plane next to the urinary bladder, excluding bladder invasion. (b) Recurrent tumor abutting the bladder wall, possibly representing serosal involvement. (c) Interruption of the muscular layer of the bladder by tumor, consistent with muscle invasion. (d) Recurrent tumor invading through the bladder wall with tumor nodules in the mucosal layer, consistent with mucosal involvement. (e) Submucosal bullous edema due to acute radiation-induced cystitis. (f) Spiculated tumor with frank posterior bladder wall invasion and vesicovaginal fistula.
Figure 7f
Figure 7f
Assessment of urinary bladder invasion by tumor. (a) Preserved fat plane next to the urinary bladder, excluding bladder invasion. (b) Recurrent tumor abutting the bladder wall, possibly representing serosal involvement. (c) Interruption of the muscular layer of the bladder by tumor, consistent with muscle invasion. (d) Recurrent tumor invading through the bladder wall with tumor nodules in the mucosal layer, consistent with mucosal involvement. (e) Submucosal bullous edema due to acute radiation-induced cystitis. (f) Spiculated tumor with frank posterior bladder wall invasion and vesicovaginal fistula.
Figure 8
Figure 8
Recurrent cervical carcinoma in a 65-year-old patient. Axial FSE T2-weighted image shows recurrent tumor in the right vaginal cuff (arrowhead) that extends to the rectal serosa (arrow).
Figure 9
Figure 9
Recurrent cervical carcinoma in a 57-year-old patient. Axial FSE T2-weighted image shows a large recurrent tumor invading through the urinary bladder muscle wall into the mucosa (white arrow), consistent with mucosal involvement. Note the encasement and distortion of the right sciatic nerve (arrowhead) by tumor (black arrow).
Figure 10
Figure 10
Bullous edema in a 56-year-old patient with cervical carcinoma treated with radical hysterectomy and radiation therapy. Sagittal FSE T2-weighted image shows prominent high-signal-intensity mucosa (arrow), consistent with bullous edema in the setting of acute radiation-induced cystitis.
Figure 11a
Figure 11a
Recurrent cervical carcinoma. (a) Axial FSE T2-weighted image obtained in a 50-year-old patient shows infiltrative recurrent tumor (arrowheads) encasing the urethra and disrupting its concentric ringed appearance (arrow). (b) Sagittal FSE T2-weighted image obtained in a 54-year-old patient shows bulky tumor (T) encompassing the vagina, vulva, and perineum and invading the lower urethra (arrow). Note the normal tubular appearance of the upper mid urethra (arrowhead).
Figure 11b
Figure 11b
Recurrent cervical carcinoma. (a) Axial FSE T2-weighted image obtained in a 50-year-old patient shows infiltrative recurrent tumor (arrowheads) encasing the urethra and disrupting its concentric ringed appearance (arrow). (b) Sagittal FSE T2-weighted image obtained in a 54-year-old patient shows bulky tumor (T) encompassing the vagina, vulva, and perineum and invading the lower urethra (arrow). Note the normal tubular appearance of the upper mid urethra (arrowhead).
Figure 12
Figure 12
Anatomy of the low rectal region. The internal sphincter (IS) is a continuation of the circular muscle layer of the rectum, which thickens at the anorectal junction. The external sphincter (ES) complex is an extension of the inferior portions of the levator ani and puborectalis (PBR) muscles. If the tumor spreads below the superior border of the puborectal sling, sphincter-sparing resection is not an option. Note that the intersphincteric space (*) is only a few millimeters in width.
Figure 13
Figure 13
Recurrent endometrial carcinoma in a 69-year-old patient. Coronal FSE T2-weighted image shows a large right pelvic tumor closely abutting the right obturator internus muscle (arrow), invading the urinary bladder (black arrowhead), and abutting the right internal iliac vein (white arrowhead). Note the radiation-related T2 hyperintensity in the right obturator internus muscle.
Figure 14a
Figure 14a
Recurrent pelvic sarcoma in a 55-year-old patient. Axial FSE T1-weighted (a) and contrast-enhanced fat-saturated T1-weighted (b) images show recurrent tumor (T) invading the right inferior pubic ramus (arrow). Bone involvement is evident as loss of the low-signal-intensity cortex and replacement of the normal bone marrow signal by the T1-hypointense tumor, which enhances after intravenous contrast material administration.
Figure 14b
Figure 14b
Recurrent pelvic sarcoma in a 55-year-old patient. Axial FSE T1-weighted (a) and contrast-enhanced fat-saturated T1-weighted (b) images show recurrent tumor (T) invading the right inferior pubic ramus (arrow). Bone involvement is evident as loss of the low-signal-intensity cortex and replacement of the normal bone marrow signal by the T1-hypointense tumor, which enhances after intravenous contrast material administration.
Figure 15a
Figure 15a
Levels of vascular involvement by tumor. (a) Axial FSE T2-weighted image obtained in a 65-year-old patient with recurrent cervical cancer shows a large right pelvic tumor. A fat plane between the tumor and external iliac vessels is preserved (arrow) (inset diagram). Note loss of the fat plane between the tumor and right internal iliac vein (arrowhead). (b) Axial FSE T2-weighted image obtained in a 65-year-old woman with recurrent cervical carcinoma shows left pelvic tumor encasing the left external iliac vein (arrowhead) (inset diagram) and approaching the left sciatic nerve (arrow). (c) Axial FSE T2-weighted image obtained in a 55-year-old woman with recurrent cervical cancer shows bulky tumor encasing and distorting the external iliac vessels (arrow) (inset diagram).
Figure 15b
Figure 15b
Levels of vascular involvement by tumor. (a) Axial FSE T2-weighted image obtained in a 65-year-old patient with recurrent cervical cancer shows a large right pelvic tumor. A fat plane between the tumor and external iliac vessels is preserved (arrow) (inset diagram). Note loss of the fat plane between the tumor and right internal iliac vein (arrowhead). (b) Axial FSE T2-weighted image obtained in a 65-year-old woman with recurrent cervical carcinoma shows left pelvic tumor encasing the left external iliac vein (arrowhead) (inset diagram) and approaching the left sciatic nerve (arrow). (c) Axial FSE T2-weighted image obtained in a 55-year-old woman with recurrent cervical cancer shows bulky tumor encasing and distorting the external iliac vessels (arrow) (inset diagram).
Figure 15c
Figure 15c
Levels of vascular involvement by tumor. (a) Axial FSE T2-weighted image obtained in a 65-year-old patient with recurrent cervical cancer shows a large right pelvic tumor. A fat plane between the tumor and external iliac vessels is preserved (arrow) (inset diagram). Note loss of the fat plane between the tumor and right internal iliac vein (arrowhead). (b) Axial FSE T2-weighted image obtained in a 65-year-old woman with recurrent cervical carcinoma shows left pelvic tumor encasing the left external iliac vein (arrowhead) (inset diagram) and approaching the left sciatic nerve (arrow). (c) Axial FSE T2-weighted image obtained in a 55-year-old woman with recurrent cervical cancer shows bulky tumor encasing and distorting the external iliac vessels (arrow) (inset diagram).
Figure 16a
Figure 16a
Recurrent cervical carcinoma in a 34-year-old patient. Coronal fat-saturated FSE T2-weighted (a) and contrast-enhanced fat-saturated T1-weighted (b) images show sciatic nerve invasion by the tumor, as evidenced by nerve enlargement, increased T2 signal (arrow in a), and presence of contrast enhancement (arrow in b). Note the involvement of the adjacent left iliac bone (arrowhead).
Figure 16b
Figure 16b
Recurrent cervical carcinoma in a 34-year-old patient. Coronal fat-saturated FSE T2-weighted (a) and contrast-enhanced fat-saturated T1-weighted (b) images show sciatic nerve invasion by the tumor, as evidenced by nerve enlargement, increased T2 signal (arrow in a), and presence of contrast enhancement (arrow in b). Note the involvement of the adjacent left iliac bone (arrowhead).
Figure 17a
Figure 17a
Recurrent cervical cancer in a 48-year-old patient. Axial FDG PET/CT images show hypermetabolic thoracic lymphadenopathy (arrow in a) and left lung metastasis (arrow in b), making this patient ineligible for PE.
Figure 17b
Figure 17b
Recurrent cervical cancer in a 48-year-old patient. Axial FDG PET/CT images show hypermetabolic thoracic lymphadenopathy (arrow in a) and left lung metastasis (arrow in b), making this patient ineligible for PE.
Figure 18
Figure 18
Radiation injury in a 50-year-old patient with cervical carcinoma treated with CRT. Sagittal FSE T2-weighted image shows marked diffuse rectal wall thickening and edema (arrow), consistent with acute radiation-induced proctitis.
Figure 19a
Figure 19a
Recurrent cervical carcinoma in a 54-year-old patient. Sagittal FSE T2-weighted (a) and contrast-enhanced fat-saturated T1-weighted (b) images show a recurrent tumor (arrow) with frank posterior bladder wall invasion and secondary vesicovaginal fistula (arrowhead).
Figure 19b
Figure 19b
Recurrent cervical carcinoma in a 54-year-old patient. Sagittal FSE T2-weighted (a) and contrast-enhanced fat-saturated T1-weighted (b) images show a recurrent tumor (arrow) with frank posterior bladder wall invasion and secondary vesicovaginal fistula (arrowhead).
Figure 20a
Figure 20a
Radiation effects in a 62-year-old patient with cervical carcinoma treated with radiation therapy. (a, b) Axial FSE T1-weighted images obtained before (a) and after (b) radiation therapy show development of diffusely high T1 signal intensity due to radiation-related increased fat content of the bone marrow. One month after completion of radiation therapy, the patient presented to the emergency department with acute-o-nset right hip pain. (c, d) Coronal FSE T1-weighted (c) and fat-saturated FSE T2-weighted (d) images show a T1 hypointense, T2 hyperintense fracture line (arrow), in keeping with an insufficiency fracture. Note the associated edema (arrowhead).
Figure 20b
Figure 20b
Radiation effects in a 62-year-old patient with cervical carcinoma treated with radiation therapy. (a, b) Axial FSE T1-weighted images obtained before (a) and after (b) radiation therapy show development of diffusely high T1 signal intensity due to radiation-related increased fat content of the bone marrow. One month after completion of radiation therapy, the patient presented to the emergency department with acute-o-nset right hip pain. (c, d) Coronal FSE T1-weighted (c) and fat-saturated FSE T2-weighted (d) images show a T1 hypointense, T2 hyperintense fracture line (arrow), in keeping with an insufficiency fracture. Note the associated edema (arrowhead).
Figure 20c
Figure 20c
Radiation effects in a 62-year-old patient with cervical carcinoma treated with radiation therapy. (a, b) Axial FSE T1-weighted images obtained before (a) and after (b) radiation therapy show development of diffusely high T1 signal intensity due to radiation-related increased fat content of the bone marrow. One month after completion of radiation therapy, the patient presented to the emergency department with acute-o-nset right hip pain. (c, d) Coronal FSE T1-weighted (c) and fat-saturated FSE T2-weighted (d) images show a T1 hypointense, T2 hyperintense fracture line (arrow), in keeping with an insufficiency fracture. Note the associated edema (arrowhead).
Figure 20d
Figure 20d
Radiation effects in a 62-year-old patient with cervical carcinoma treated with radiation therapy. (a, b) Axial FSE T1-weighted images obtained before (a) and after (b) radiation therapy show development of diffusely high T1 signal intensity due to radiation-related increased fat content of the bone marrow. One month after completion of radiation therapy, the patient presented to the emergency department with acute-o-nset right hip pain. (c, d) Coronal FSE T1-weighted (c) and fat-saturated FSE T2-weighted (d) images show a T1 hypointense, T2 hyperintense fracture line (arrow), in keeping with an insufficiency fracture. Note the associated edema (arrowhead).
Figure 21a
Figure 21a
Tumor recurrence in a 62-year-old patient after anterior PE for cervical carcinoma recurrence. Axial contrast-enhanced CT (a) and FDG PET/CT (b) images show two FDG-avid soft tissue nodules (arrows) along the posterior aspect of the omental flap and anterior to the rectum (arrowhead), consistent with recurrent disease.
Figure 21b
Figure 21b
Tumor recurrence in a 62-year-old patient after anterior PE for cervical carcinoma recurrence. Axial contrast-enhanced CT (a) and FDG PET/CT (b) images show two FDG-avid soft tissue nodules (arrows) along the posterior aspect of the omental flap and anterior to the rectum (arrowhead), consistent with recurrent disease.

Similar articles

Cited by

References

    1. Höckel M, Dornhöfer N. Pelvic exenteration for gynaecological tumours: achievements and unanswered questions. Lancet Oncol 2006;7(10):837–847. - PubMed
    1. Brunschwig A. Complete excision of pelvic viscera for advanced carcinoma. Cancer 1948;1:177–183. - PubMed
    1. Berek JS, Howe C, Lagasse LD, Hacker NF. Pelvic exenteration for recurrent gynecologic malignancy: survival and morbidity analysis of the 45-year experience at UCLA. Gynecol Oncol 2005;99(1):153–159. - PubMed
    1. Baiocchi G, Guimaraes GC, Rosa Oliveira RA, et al. . Prognostic factors in pelvic exenteration for gynecological malignancies. Eur J Surg Oncol 2012;38(10):948–954. - PubMed
    1. Diver EJ, Rauh-Hain JA, Del Carmen MG. Total pelvic exenteration for gynecologic malignancies. Int J Surg Oncol 2012;2012:693535. - PMC - PubMed

Substances

LinkOut - more resources