. 2015 Jul 14;11(7):e1005024.
doi: 10.1371/journal.ppat.1005024. eCollection 2015 Jul.

Vpu Exploits the Cross-Talk between BST2 and the ILT7 Receptor to Suppress Anti-HIV-1 Responses by Plasmacytoid Dendritic Cells

Affiliations

Vpu Exploits the Cross-Talk between BST2 and the ILT7 Receptor to Suppress Anti-HIV-1 Responses by Plasmacytoid Dendritic Cells

Mariana G Bego et al. PLoS Pathog. .

Abstract

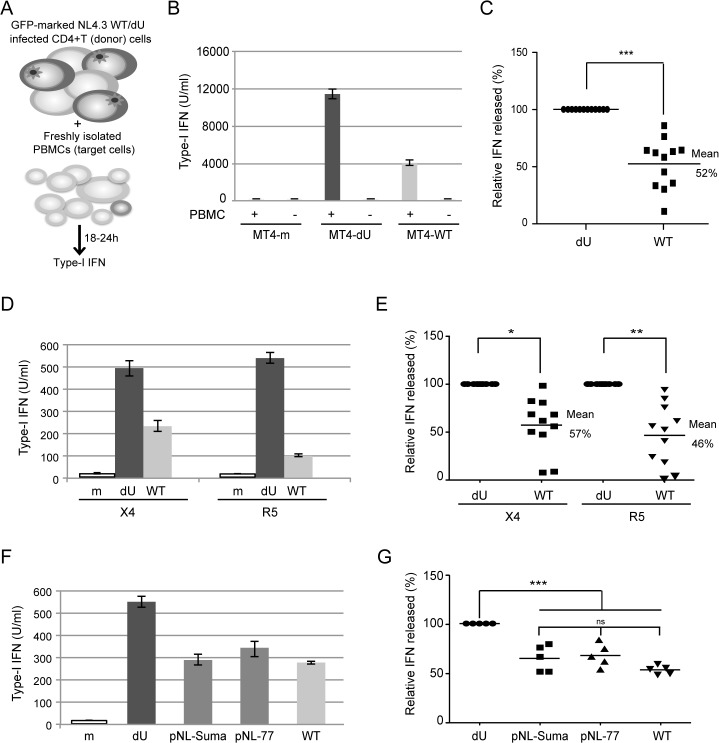
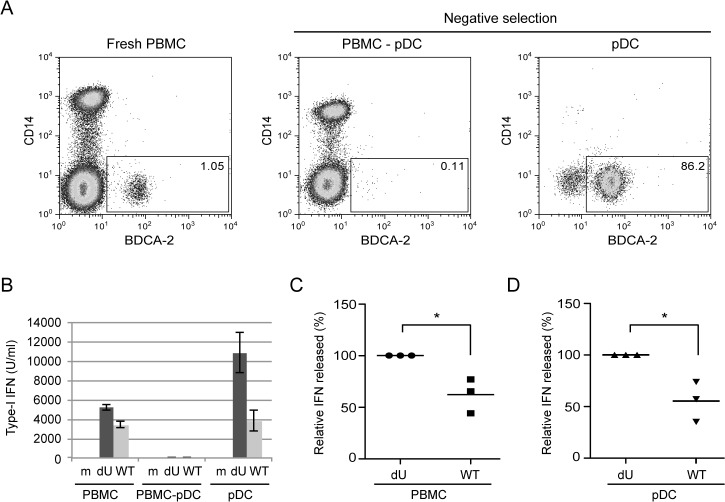
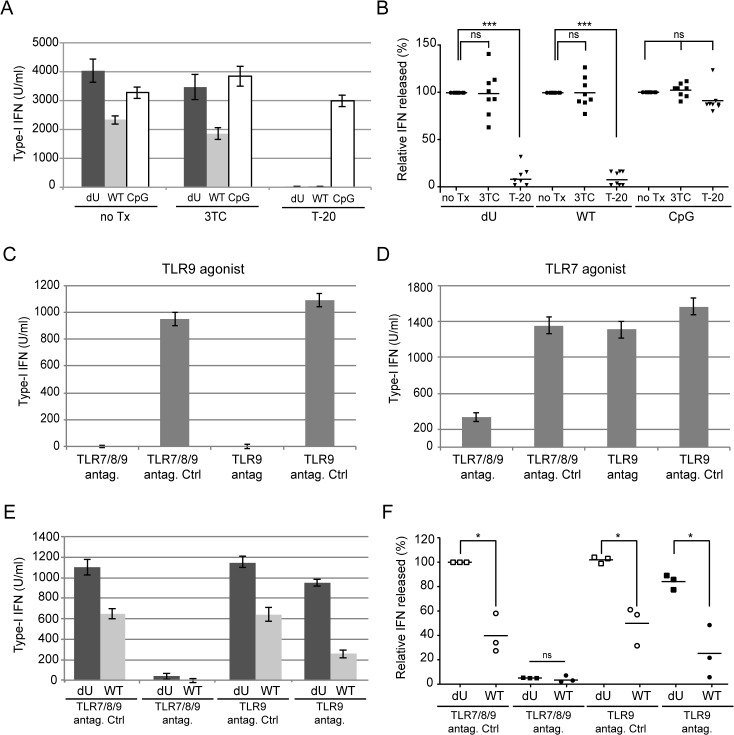
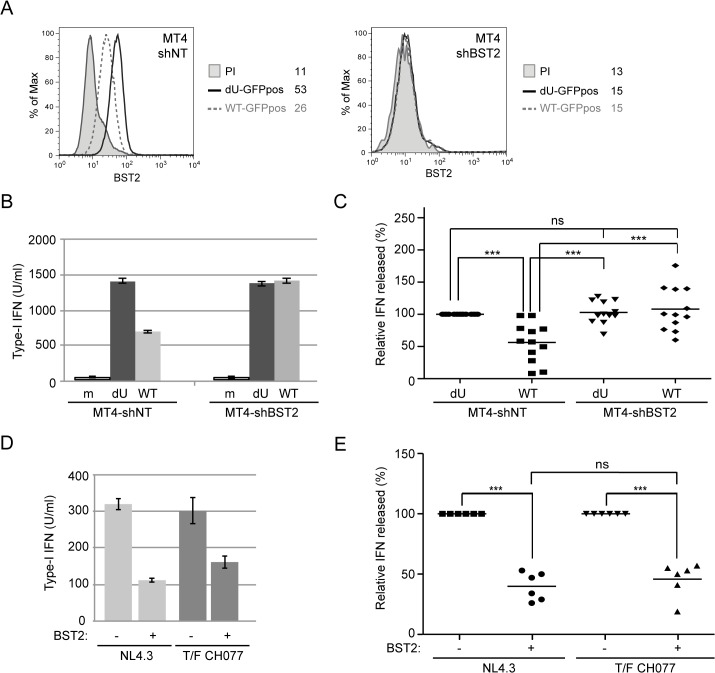
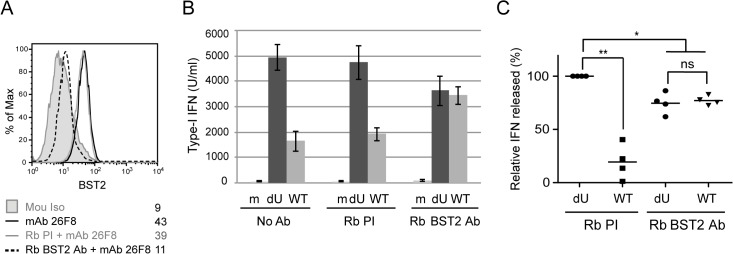
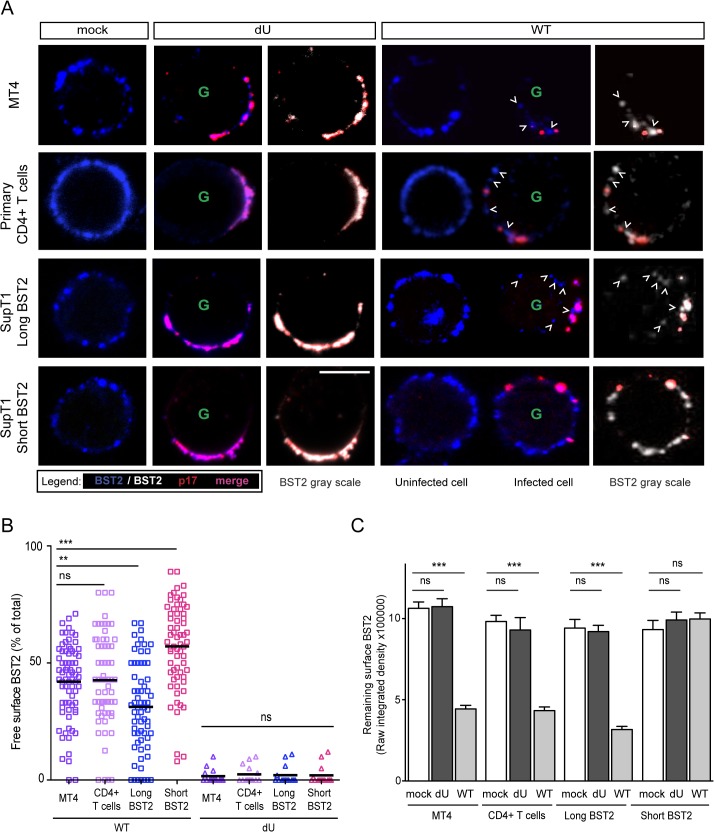
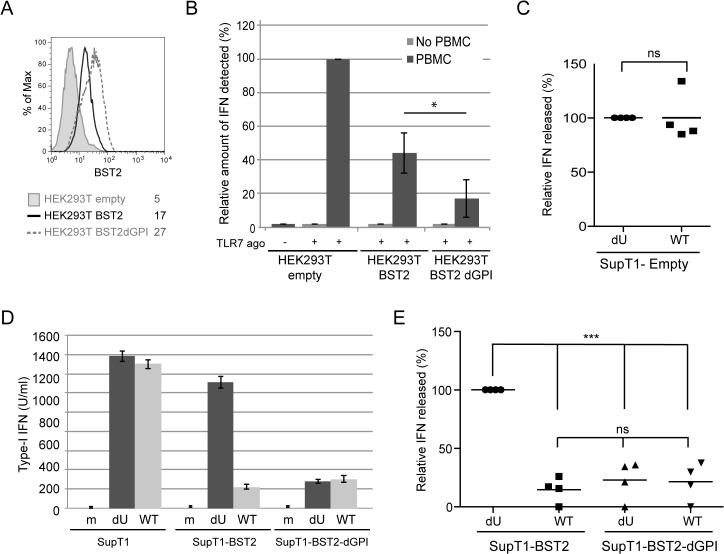
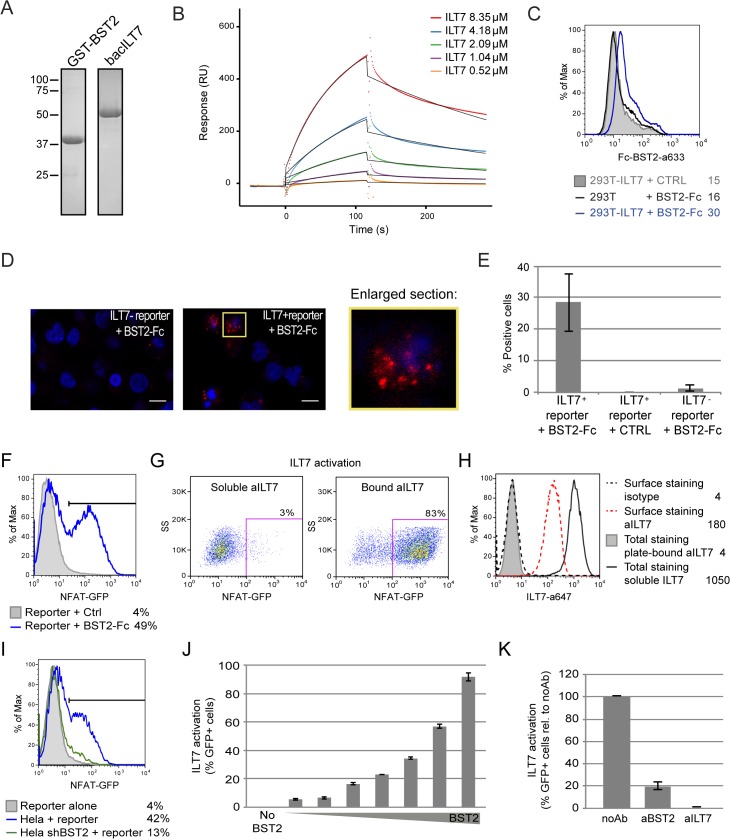
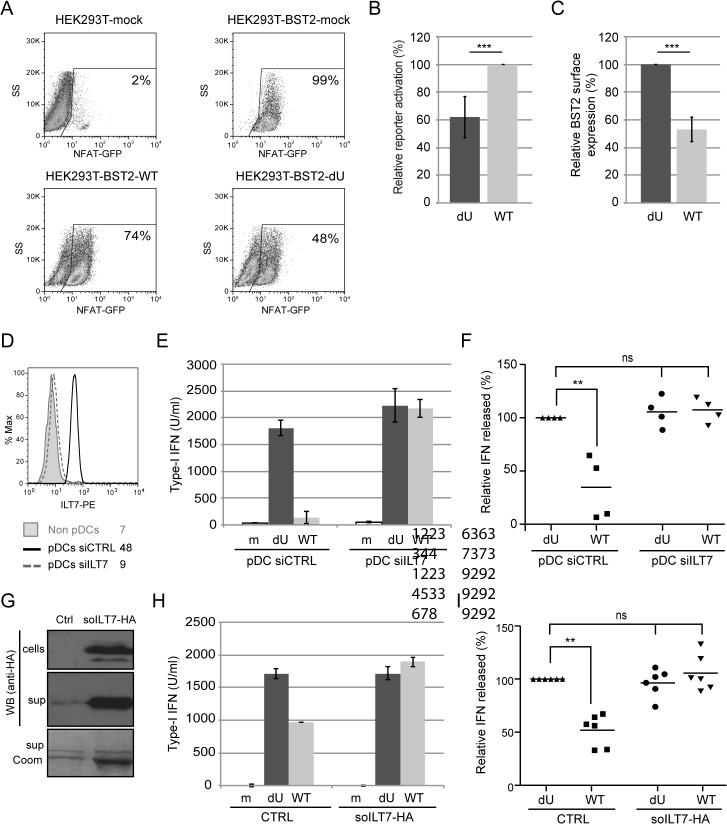
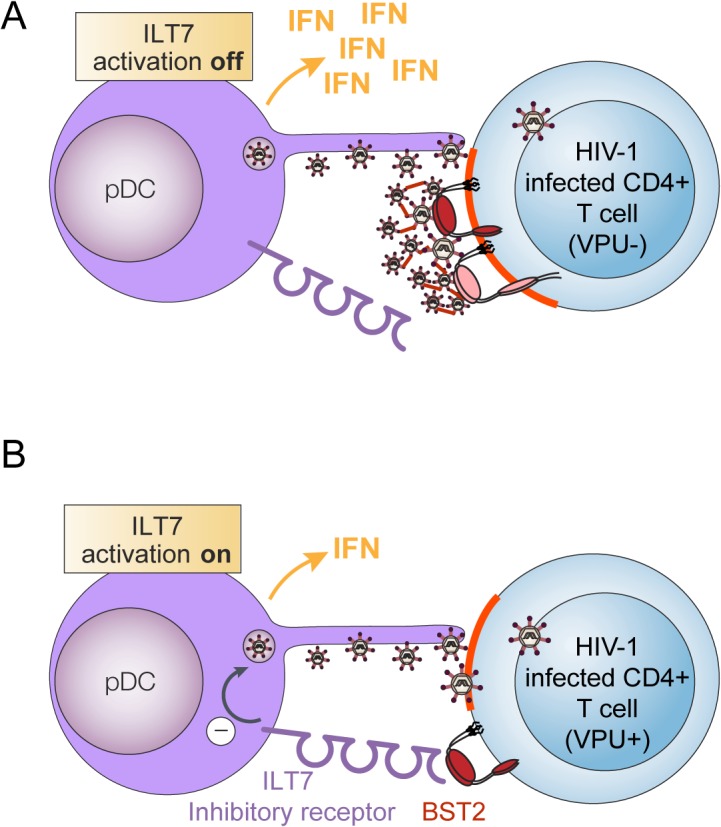
Plasmacytoid dendritic cells (pDCs) constitute a major source of type-I interferon (IFN-I) production during acute HIV infection. Their activation results primarily from TLR7-mediated sensing of HIV-infected cells. However, the interactions between HIV-infected T cells and pDCs that modulate this sensing process remain poorly understood. BST2/Tetherin is a restriction factor that inhibits HIV release by cross-linking virions onto infected cell surface. BST2 was also shown to engage the ILT7 pDC-specific inhibitory receptor and repress TLR7/9-mediated IFN-I production by activated pDCs. Here, we show that Vpu, the HIV-1 antagonist of BST2, suppresses TLR7-mediated IFN-I production by pDC through a mechanism that relies on the interaction of BST2 on HIV-producing cells with ILT7. Even though Vpu downregulates surface BST2 as a mean to counteract the restriction on HIV-1 release, we also find that the viral protein re-locates remaining BST2 molecules outside viral assembly sites where they are free to bind and activate ILT7 upon cell-to-cell contact. This study shows that through a targeted regulation of surface BST2, Vpu promotes HIV-1 release and limits pDC antiviral responses upon sensing of infected cells. This mechanism of innate immune evasion is likely to be important for an efficient early viral dissemination during acute infection.


Conflict of interest statement

The authors have declared that no competing interests exist.

Figures

Fig 1
Fig 1. Vpu controls IFN-I production by PBMCs following contact with HIV-infected CD4+ T cells.
(A) Schematic representation of the experimental system. WT or dU HIV-infected T cells are co-cultured with freshly isolated PBMCs and levels of bioactive IFN-I released in supernatants are measured 18–24h later. (B-C) MT4 cells were mock-infected, or infected with GFP-marked NL4.3 WT or dU viruses for 48 h, and co-cultured with PBMCs. After 24 h of co-culture, levels of IFN-I released in supernatants were measured. A representative example of absolute levels (B) or relative percentage (C) of IFN-I detected after co-culture of WT or dU HIV-1-infected MT4 donor cells with PBMCs (n = 12) are shown. (D-E) Primary CD4+ T cells were mock-infected, or infected with GFP-marked NL4.3 (X4) or NL4.3-Ada (R5) viruses WT or dU for 48 h, and co-cultured with PBMCs. After 24 h of co-culture, levels of IFN-I released in supernatants were measured. A representative example of absolute levels (D) or relative percentages (E) of IFN-I detected after co-culture of the indicated infected primary CD4+ T cells with PBMCs (n = 11) are shown. (F-G) MT4 cells were mock-infected or infected with GFP-marked NL4.3 virus lacking Vpu (dU) or encoding either NL4.3 Vpu (WT), T/F Suma Vpu (pNL-Suma) or T/F CH077 Vpu (pNL-77). Infected cells were co-cultured with PBMCs 48 h post infection. After 24 h of co-culture, levels of IFN-I released in supernatants were measured. A representative example of absolute levels (F) or relative percentages (G) of IFN-I detected after co-culture of the indicated infected MT4 donor cells with PBMCs (n = 5) are shown. In all analyses, the amount of IFN-I released by PBMCs in contact with dU HIV-infected cells was set at 100%. Two-tailed paired t-test was used in C and E and repeated measures ANOVA with Bonferroni’s multiple comparison test in G (*** p<0.001, ** p<0.01, * p<0.05, ns not significant (p>0.05)). Error bars represent standard deviations (SD).
Fig 2
Fig 2. Vpu attenuates IFN-I production upon sensing of HIV-infected cells by pDCs.
(A) PBMCs, pDC-depleted PBMCs (PBMC-pDC) and enriched pDC populations were stained using anti-CD14 and anti-BDCA-2 Abs and analyzed by flow cytometry. The percentage of pDC cells (BDCA-2+/CD14-) is indicated for each condition. (B) A representative example of the absolute levels of IFN-I released in the supernatants of co-cultures of the indicated infected MT4 cells with whole PBMCs, PBMC-pDC, or enriched pDC is shown. (C-D) Relative percentages of IFN-I released in supernatants after co-culture of the indicated infected MT4 cells with PBMCs (C) or enriched-pDCs (D) are shown. The amount of IFN-I released in co-cultures with dU-infected cells was set at 100% (n = 3). Two-tailed paired t-test was used (* p<0.05). Error bars represent SD.
Fig 3
Fig 3. Innate sensing of WT or Vpu-defective HIV-infected T cells requires Env-dependent viral fusion and is largely dependent on TLR7.
MT4 cells were mock-infected (m) or infected with GFP-encoding NL4.3 variants (WT or dU) as indicated. (A-B) Cells were left un-treated (no Tx) or were treated with T-20 prior to co-culture with PBMCs. To assess the effect of inhibiting reverse transcription, PBMCs were treated with 3TC prior to co-culture with infected MT4 cells. As a positive control, CpG was added to inhibitor-treated or untreated mock-infected cells. A representative example of absolute levels (A) or relative percentages (B) of IFN-I detected after co-culture of WT or dU HIV-infected MT4 cells with PBMCs in the presence or absence of inhibitors are shown. Results are expressed relative to values obtained in the no-Tx samples (n = 8). (C-F) PBMCs were pre-treated with either TLR9 or TLR7/8/9 antagonists (antag.) or their respective controls (antag. Ctrl) prior to TLR agonist treatment (C-D) or to co-culture with the indicated infected cells (E-F). A representative example of absolute levels of IFN-I detected after treatment with either TLR9 agonist (CpG-A) (C) or TLR7 agonist (R848) (D) is shown. A representative example of absolute levels (E) or relative percentages (F) of IFN-I produced in the indicated co-cultures in the presence of TLR antagonists or controls are shown. The amount of IFN-I released by PBMCs in contact with dU HIV-infected cells in the presence of the TLR7/8/9 antagonist control was set at 100% (n = 3). Two-tailed paired t-test was used. (*** p<0.001, * p<0.05, ns not significant (p>0.05)). Error bars represent SD.
Fig 4
Fig 4. Vpu-mediated control of IFN-I production by pDCs requires the presence of BST2 on infected donor cells.
(A-C) Control (MT4-shNT) or BST2-depleted (MT4-shBST2) MT4 cells were mock-infected, or infected with GFP-marked NL4.3 WT or dU viruses for 48 h. (A) Surface expression of BST2 on GFP-positive MT4 cells infected with WT (dashed grey histogram) or dU (solid black histogram) was evaluated by flow cytometry. Mean fluorescence intensity (MFI) values are indicated for each sample (staining using pre-immune rabbit serum, PI, shaded grey histograms). (B-C) The indicated MT4 donor cells were co-cultured with PBMCs. After 24 h, levels of bioactive IFN-I were measured in supernatants. A representative example of absolute levels (B) or relative percentages (C) of IFN-I produced after co-culture of the indicated infected MT4 cells with PBMCs are shown. The amount of IFN-I released by PBMCs in contact with dU HIV-infected MT4-shNT cells was set at 100% (n = 12). (D-E) MT4-shNT (BST2 +) or MT4-shBST2 (BST2 -) cells were infected with GFP-marked NL4.3 WT or T/F CH077 viruses for 48 h. Similar number of p24+ infected cells were then co-cultured with PBMCs. After 24 h, levels of bioactive IFN-I were measured in supernatants. A representative example of absolute levels (D) or relative percentages (E) of IFN-I produced after co-culture of the indicated infected MT4 cells with PBMCs are shown. The amount of IFN-I released by PBMCs in contact with infected MT4-shBST2 cells was set at 100% (n = 6). Repeated measures ANOVA with Bonferroni’s multiple comparison test was used. (*** p<0.001, ns not significant (p>0.05)). Error bars represent SD.
Fig 5
Fig 5. BST2 at the surface of infected cells is required for Vpu-mediated control of IFN-I production.
MT4 cells were mock-infected or infected with GFP-marked NL4.3 WT or dU viruses and pre-incubated with anti-BST2 rabbit polyclonal (Rb BST2 Ab) or pre-immune (Rb PI) Abs or left untreated (No Ab). (A) Mock cells were subsequently stained for surface BST2 using mAb 26F8 and analyzed by flow cytometry. As a positive control, cells were directly stained with mAb 26F8. (B-C) The indicated MT4 cells were co-cultured with PBMCs. After 24 h, levels of IFN-I released in supernatants were measured. A representative example of absolute levels (B) or relative percentages (C) of IFN-I produced after co-culture of PBMCs with infected MT4 cells pre-treated with the indicated Abs are shown. The amount of IFN-I released by PBMCs in contact with dU HIV-infected cells in presence of Rb PI was set at 100% (n = 4). Two-tailed paired t-test was used (** p<0.01, * p<0.05, ns not significant (p>0.05)). Error bars represent SD.
Fig 6
Fig 6. Residual BST2 clusters are detected outside virus assembly sites in the presence of Vpu.
MT4, primary CD4+ T cells, SupT1-shortBST2 and SupT1-longBST2 cells were mock-infected (mock) or infected with VSV-G-pseudotyped NL4.3-Ada-GFP WT or dU viruses. (A) Cells were stained with anti-BST2 Abs (blue), fixed, permeabilized and then sequentially stained with anti-p17 Abs (red). Infected cells (GFP+) are marked with a green letter G. An uninfected cell is shown next to WT-infected cells as indicated. Clusters of free BST2 are marked with white open arrows. White bar = 10 μm. (B) The number of residual BST2 clusters not co-localizing with p17 (designated as free BST2) per cell was calculated and expressed as the percentage of the total number of surface BST2 clusters. (C) Quantitative analysis of surface BST2 was determined as described in Materials and Methods. One way ANOVA with Bonferroni’s multiple comparison test was used (*** p<0.001, ** p<0.01, ns not significant (p>0.05)). Error bars indicate the standard error of the mean after analysis of at least 50 distinct cells.
Fig 7
Fig 7. Effect of a BST2 GPI anchor mutant on Vpu-mediated control of IFN-I production by pDCs.
(A-B) HEK293T cells were transfected with either an empty plasmid or plasmids expressing BST2 or BST2-dGPI 48 h prior to co-culture with PBMCs. (A) Surface expression of BST2 was evaluated 48 h post transfection by flow cytometry in controls cells (shaded grey histogram), as well as in cell expressing BST2 (solid black histogram), or BST2-dGPI (dashed grey histogram). Mean fluorescence intensity (MFI) values are indicated for each sample (B) After 6 h of co-culture, samples were untreated or treated with Imiquimod (TLR7 agonist) and levels of bioactive IFN-I in supernatants were measured 18 h later. The amount of IFN-I released by PBMCs in contact with HEK293T cells transfected with the empty plasmid in presence of the TLR 7 agonist was set at 100% (n = 4). As a control, transfected HEK293T cells were treated with TLR7 agonist without PBMCs. (C) Percentage of IFN-I released after co-culture of infected SupT1-Empty with PBMCs normalized to the value obtained with dU HIV-infected SuptT1 cells (100%) (n = 4). (D) A representative example of absolute levels of IFN-I produced after co-culture of mock or infected-SupT1,-SupT1-BST2 or-SupT1-BST2-dGPI cells with PBMCs is shown. (E) Relative percentages of IFN-I produced after co-culture of infected-SupT1-BST2 or SupT1-BST2-dGPI cells with PBMCs are shown. The amount of IFN-I released by PBMCs in contact with dU HIV-infected SupT1-BST2 cells was set at 100% (n = 4). Two-tailed paired t-test was used in B and C (* p<0.05, ns not significant (p>0.05)). Repeated measures ANOVA with Bonferroni’s multiple comparison test was used in E (*** p<0.001, ns not significant (p>0.05)). Error bars represent SD.
Fig 8
Fig 8. BST2 binds and effectively activates ILT7.
(A-E) BST2 binds ILT7. (A) Purified GST-BST2 and bacILT7 were analyzed by SDS-PAGE and visualized by Coomassie brilliant blue staining. (B) Recombinant GST-BST2 pre-coated on the surface of Biacore sensor chips, was mixed with the indicated concentrations of bacILT7. The kinetic response data after subtracting the value from a reference cell coated with GST alone are shown. Kinetic constants (KD = 2.33 μM, kon = 1.25×10³ M-1s-1, koff = 3.08×10⁻³ s-1) were derived by fitting the data (dotted lines) to a 1:1 Langmuir model (black lines) using local Rmax parameters (chi2 = 14). (C) Control (293T) or ILT7-expressing HEK 293T cells (293T-ILT7) were incubated with control supernatant (CTRL) or with BST2-Fc-containing supernatant (BST2-Fc) prior to crosslinking with DTSSP. Cells were then stained for surface BST2-Fc and analyzed by flow cytometry. (D-E) ILT7+ or ILT7- NFAT-GFP reporter cells were incubated with control supernatant (CTRL) or with BST2-Fc-containing supernatant (BST2-Fc). Proximity ligation assay (PLA) was performed using mouse ILT7 mAb and rabbit polyclonal anti-BST2 Abs. A fluorochrome-labeled probe (red) was used to reveal locations of close proximity, and nuclei were highlighted with DAPI staining (blue). (D) Images were acquired by confocal microscopy using a 63Å~ objective. Images shown are representative of multiple fields. A magnification of the section marked in yellow is shown beside the panel. White bar = 10 μm. (E) The percentage of cells with PLA red staining (% positive cells) was calculated from at least 50 cells per condition. (F-K) BST2 effectively activates ILT7. (F) ILT7+ NFAT-GFP reporter cells were cultured in the presence or absence of plate-bound BST2-Fc for 24 h and analyzed for GFP expression using flow cytometry. (G-H) ILT7+ NFAT-GFP reporter cells were cultured in the presence of plate-bound or soluble anti-ILT7_alexa647 Abs (grey shaded or solid black histograms, respectively) or soluble isotype_alexa647 Ab as negative control (dotted lines). Twenty-four hours later, cells were harvested and samples in contact with the isotype Ab were stained for surface ILT7 only, using the above mentioned Abs for 30 min at 4°C (isotype_alexa647: dotted black histogram and aILT7_alexa647: dotted red histogram). All sample were analyzed by flow cytometry to detect (G) the percentage of GFP positive cells and (H) anti-ILT7 Abs (surface or total: surface + internalized). (I-K) ILT7+ NFAT-GFP reporter cells were co-cultured for 24 h with (I) control Hela or BST2-depleted Hela (Hela shBST2) cells or (J-K) HEK293T cells expressing either (J) increasing amounts of BST2 or (K) a fixed amount of BST2 and analyzed by flow cytometry (n = 2). (K) Prior to co-cultures, HEK293T-BST2 cells were incubated with rabbit anti-BST2 Abs (aBST2) or ILT7+ NFAT-GFP reporter cells were incubated with anti-ILT7 Abs (aILT7) for 1h or cells were left untreated as control (noAb). Relative percentage of ILT7 activation was plotted as % of GFP+ cells in each condition relative to the no Ab condition, which was set at 100%. Error bars represent SD.
Fig 9
Fig 9. Vpu-mediated control of IFN-I production by pDCs involves engagement and activation of ILT7 by BST2.
(A-C) Vpu-mediated BST2 antagonism enhances activation of ILT7. ILT7+ NFAT-GFP reporter cells were co-cultured with HEK293T (mock) or BST2-expressing HEK293T cells mock-transfected or transfected with the indicated pNL4.3 constructs (WT or dU). (A) Representative example of ILT7 activation as determined by the percentage of NFAT-GFP positive cells measured by flow cytometry. (B) Percentage of ILT7 activation after co-culture with the indicated HIV/BST2 expressing HEK 293T cells relative to WT HIV-producing cells (100%) (n = 4). (C) Percentage of BST2 surface expression in HEK293T cells after co-transfection of BST2 with the indicated HIV provirus relative to dU HIV-producing cells (100%) (n = 4). (D-F) Effect of ILT7 depletion on IFN-I production by pDCs. (D) Non-pDC fraction (BDCA-2-) and siRNA-treated enriched pDCs (CD14-/BDCA-2+) were stained using anti-ILT7 Abs as indicated. A representative example of absolute levels (E) or relative percentages (F) of IFN-I produced after co-culture of control pDCs (pDC-siCTRL) or ILT7-depleted pDCs (pDC-siILT7) with the indicated infected MT4 cells are shown. The amount of IFN-I released by pDC siCTRL in contact with dU HIV-infected cells was set at 100% (n = 4). (G-I) Effect of recombinant soluble ILT7 on IFN-I production by pDCs. (G) Expression of a HA-tagged soluble ILT7 (soILT7-HA) in HEK 293T cells. Cells and supernatants (sup) were analyzed by Western blot (WB) using anti-HA Abs. Purity of secreted soILT7-HA was confirmed by Coomassie staining (sup Coom). A representative example of (H) absolute levels or (I) relative percentages of IFN-I production after co-culture of PBMCs with the indicated infected MT4 cells pre-treated with control (CTRL) or soILT7-HA-containing supernatants are shown. The amount of IFN-I released by PBMCs in contact with dU HIV-infected cells in presence of CTRL supernatant was set at 100% (n = 6). Two-tailed paired t-test was used in B-C while repeated measures ANOVA with Bonferroni’s multiple comparison test was used in F and I (*** p<0.001, ** p<0.01, ns not significant (p>0.05)). Error bars represent SD.
Fig 10
Fig 10. Presence of Vpu in HIV-infected cells limits pDC antiviral responses upon sensing of infected cells.
pDCs produce type-I interferon (IFN) upon sensing of HIV-infected cells. This process is negatively regulated when BST2 expressed on HIV producing donor cells interacts with ILT7, a pDC inhibitory receptor. (A) In infected cells lacking Vpu, BST2 restricts HIV-1 release by trapping nascent virions at the cell surface. This in turn, obstructs BST2 from interacting with ILT7. In this context, sensing of HIV-infected cells by pDCs will result in efficient IFN-1 production. (B) Vpu promotes efficient HIV-1 release in part by down-modulating surface BST2 but also by mislocalizing remaining molecules outside viral assembly sites (highlighted in red). Upon encountering CD4+ T cells infected with WT HIV (Vpu+), pDCs produce reduced amounts of IFN-I because residual surface BST2 molecules are free to interact with ILT7 and activate an inhibitory signal in pDCs.

Similar articles

Cited by

References

    1. Swiecki M, Colonna M (2010) Unraveling the functions of plasmacytoid dendritic cells during viral infections, autoimmunity, and tolerance. Immunol Rev 234: 142–162. 10.1111/j.0105-2896.2009.00881.x - DOI - PMC - PubMed
    1. Fitzgerald-Bocarsly P, Jacobs ES (2010) Plasmacytoid dendritic cells in HIV infection: striking a delicate balance. J Leukoc Biol 87: 609–620. 10.1189/jlb.0909635 - DOI - PMC - PubMed
    1. Malleret B, Maneglier B, Karlsson I, Lebon P, Nascimbeni M, et al. (2008) Primary infection with simian immunodeficiency virus: plasmacytoid dendritic cell homing to lymph nodes, type I interferon, and immune suppression. Blood 112: 4598–4608. 10.1182/blood-2008-06-162651 - DOI - PubMed
    1. Campillo-Gimenez L, Laforge M, Fay M, Brussel A, Cumont MC, et al. (2010) Nonpathogenesis of simian immunodeficiency virus infection is associated with reduced inflammation and recruitment of plasmacytoid dendritic cells to lymph nodes, not to lack of an interferon type I response, during the acute phase. J Virol 84: 1838–1846. 10.1128/JVI.01496-09 - DOI - PMC - PubMed
    1. Li G, Cheng M, Nunoya J, Cheng L, Guo H, et al. (2014) Plasmacytoid dendritic cells suppress HIV-1 replication but contribute to HIV-1 induced immunopathogenesis in humanized mice. PLoS Pathog 10: e1004291 10.1371/journal.ppat.1004291 - DOI - PMC - PubMed

Publication types

MeSH terms

Substances