

Self-organizing human cardiac microchambers mediated by geometric confinement
- PMID: 26172574
- PMCID: PMC4503387
- DOI: 10.1038/ncomms8413
Self-organizing human cardiac microchambers mediated by geometric confinement
Abstract
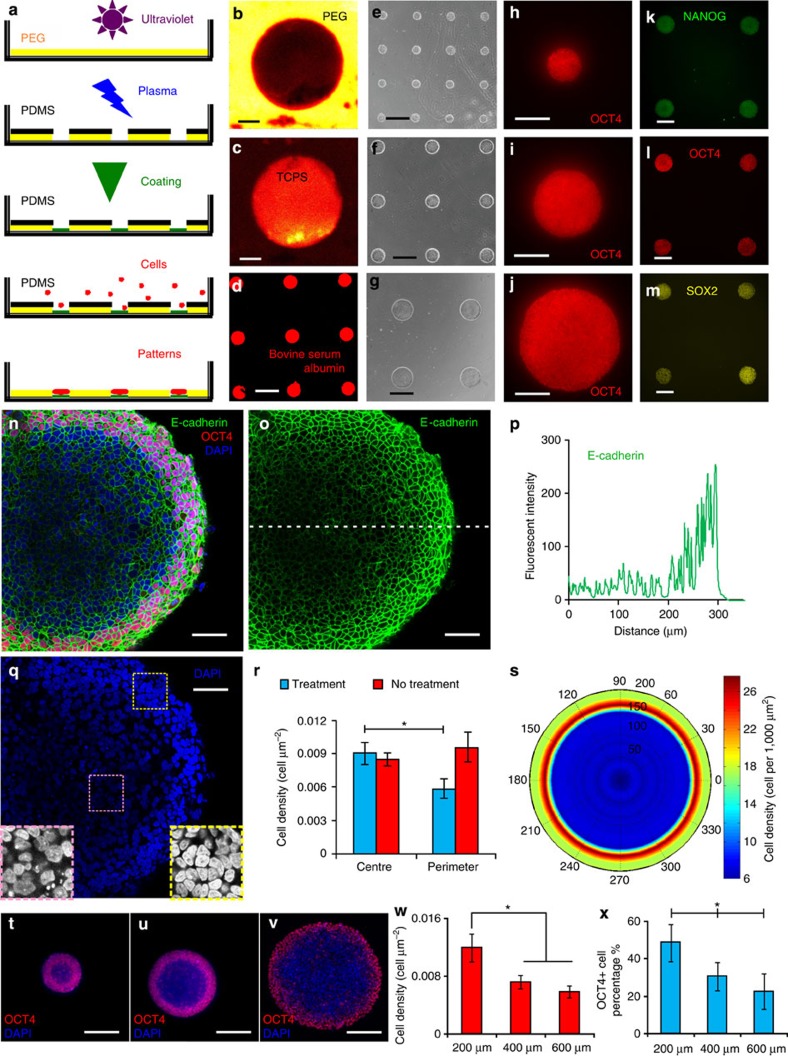
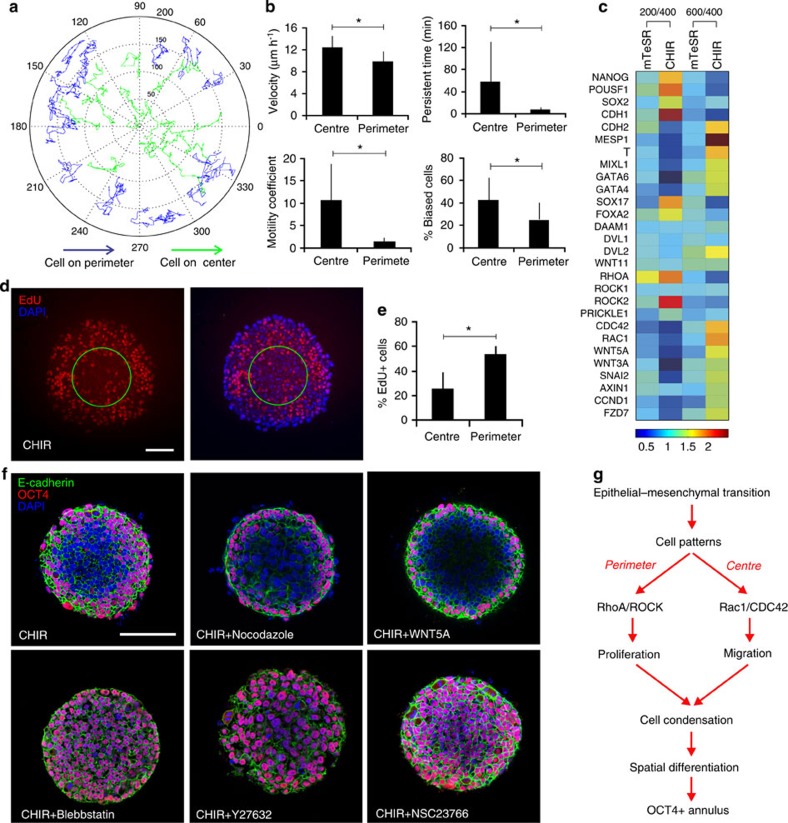
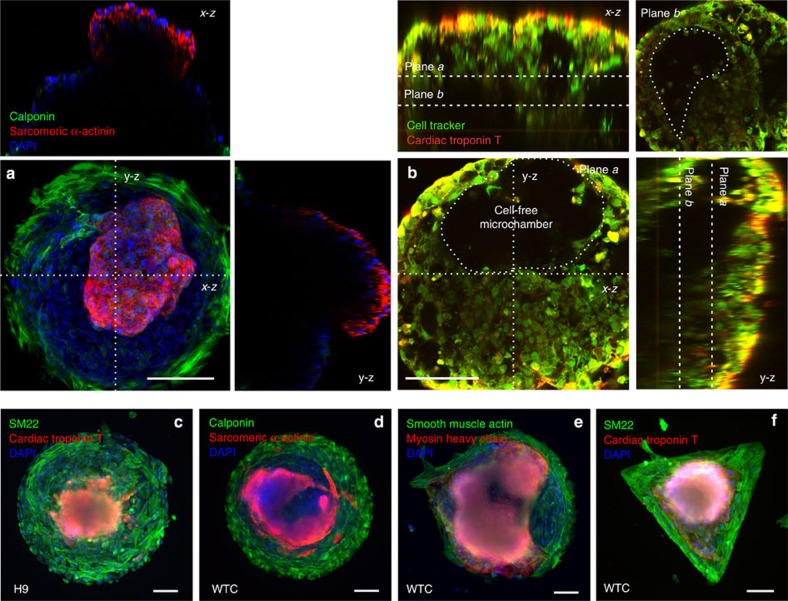
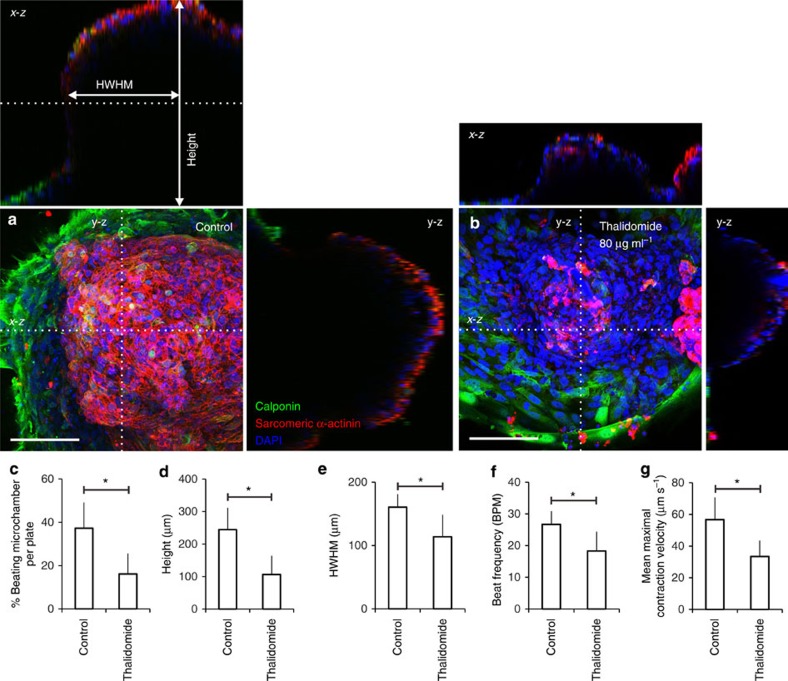
Tissue morphogenesis and organ formation are the consequences of biochemical and biophysical cues that lead to cellular spatial patterning in development. To model such events in vitro, we use PEG-patterned substrates to geometrically confine human pluripotent stem cell colonies and spatially present mechanical stress. Modulation of the WNT/β-catenin pathway promotes spatial patterning via geometric confinement of the cell condensation process during epithelial-mesenchymal transition, forcing cells at the perimeter to express an OCT4+ annulus, which is coincident with a region of higher cell density and E-cadherin expression. The biochemical and biophysical cues synergistically induce self-organizing lineage specification and creation of a beating human cardiac microchamber confined by the pattern geometry. These highly defined human cardiac microchambers can be used to study aspects of embryonic spatial patterning, early cardiac development and drug-induced developmental toxicity.
Figures
Similar articles
-
Three-dimensional poly-(ε-caprolactone) nanofibrous scaffolds directly promote the cardiomyocyte differentiation of murine-induced pluripotent stem cells through Wnt/β-catenin signaling.BMC Cell Biol. 2015 Sep 3;16:22. doi: 10.1186/s12860-015-0067-3. BMC Cell Biol. 2015. PMID: 26335746 Free PMC article.
-
Wnt/β-catenin-mediated signaling re-activates proliferation of matured cardiomyocytes.Stem Cell Res Ther. 2018 Dec 7;9(1):338. doi: 10.1186/s13287-018-1086-8. Stem Cell Res Ther. 2018. PMID: 30526659 Free PMC article.
-
Coordinated Proliferation and Differentiation of Human-Induced Pluripotent Stem Cell-Derived Cardiac Progenitor Cells Depend on Bone Morphogenetic Protein Signaling Regulation by GREMLIN 2.Stem Cells Dev. 2017 May 1;26(9):678-693. doi: 10.1089/scd.2016.0226. Epub 2017 Mar 20. Stem Cells Dev. 2017. PMID: 28125926 Free PMC article.
-
Heart fields and cardiac morphogenesis.Cold Spring Harb Perspect Med. 2014 Oct 1;4(10):a015750. doi: 10.1101/cshperspect.a015750. Cold Spring Harb Perspect Med. 2014. PMID: 25274757 Free PMC article. Review.
-
Scalable Cardiac Differentiation of Pluripotent Stem Cells Using Specific Growth Factors and Small Molecules.Adv Biochem Eng Biotechnol. 2018;163:39-69. doi: 10.1007/10_2017_30. Adv Biochem Eng Biotechnol. 2018. PMID: 29071404 Review.
Cited by
-
Engineering spatial-organized cardiac organoids for developmental toxicity testing.Stem Cell Reports. 2021 May 11;16(5):1228-1244. doi: 10.1016/j.stemcr.2021.03.013. Epub 2021 Apr 22. Stem Cell Reports. 2021. PMID: 33891865 Free PMC article.
-
Making a heart: advances in understanding the mechanisms of cardiac development.Curr Opin Pediatr. 2016 Oct;28(5):584-9. doi: 10.1097/MOP.0000000000000401. Curr Opin Pediatr. 2016. PMID: 27428484 Free PMC article. Review.
-
Naturally-Derived Biomaterials for Tissue Engineering Applications.Adv Exp Med Biol. 2018;1077:421-449. doi: 10.1007/978-981-13-0947-2_23. Adv Exp Med Biol. 2018. PMID: 30357702 Free PMC article. Review.
-
Microfluidic Organ-on-a-Chip System for Disease Modeling and Drug Development.Biosensors (Basel). 2022 May 27;12(6):370. doi: 10.3390/bios12060370. Biosensors (Basel). 2022. PMID: 35735518 Free PMC article. Review.
-
Spatial Stem Cell Fate Engineering via Facile Morphogen Localization.Adv Healthc Mater. 2021 Nov;10(21):e2100995. doi: 10.1002/adhm.202100995. Epub 2021 Aug 29. Adv Healthc Mater. 2021. PMID: 34459150 Free PMC article.
References
-
- Thompson D.W. On Growth and Form Cambridge University Press (1917).
-
- Srivastava D. & Olson E.N. A genetic blueprint for cardiac development. Nature 407, 221–226 (2000). - PubMed
-
- Curtiss J., Halder G. & Mlodzik M. Selector and signalling molecules cooperate in organ patterning. Nat. Cell Biol. 4, E48–E51 (2002). - PubMed
-
- Bruneau B.G. The developmental genetics of congenital heart disease. Nature 451, 943–948 (2008). - PubMed
-
- Engler A.J., Sen S., Sweeney H.L. & Discher D.E. Matrix elasticity directs stem cell lineage specification. Cell 126, 677–689 (2006). - PubMed
Publication types
MeSH terms
Substances
Grants and funding
- P01 HL089707/HL/NHLBI NIH HHS/United States
- U01 HL098179/HL/NHLBI NIH HHS/United States
- R01HL096525/HL/NHLBI NIH HHS/United States
- UH3TR000487/TR/NCATS NIH HHS/United States
- UH2 TR000487/TR/NCATS NIH HHS/United States
- U01HL100406/HL/NHLBI NIH HHS/United States
- UH2TR000487/TR/NCATS NIH HHS/United States
- EB-002027/EB/NIBIB NIH HHS/United States
- U01 HL100406/HL/NHLBI NIH HHS/United States
- R01 HL108677/HL/NHLBI NIH HHS/United States
- R21EB021003/EB/NIBIB NIH HHS/United States
- UH3 TR000487/TR/NCATS NIH HHS/United States
- R01 HL096525/HL/NHLBI NIH HHS/United States
- T32 HL007544/HL/NHLBI NIH HHS/United States
- U01HL098179/HL/NHLBI NIH HHS/United States
- R21 EB021003/EB/NIBIB NIH HHS/United States
- P41 EB002027/EB/NIBIB NIH HHS/United States
- R01HL108677/HL/NHLBI NIH HHS/United States
LinkOut - more resources
Full Text Sources
Other Literature Sources
