. 2015 Jun;91(6):062703.
doi: 10.1103/PhysRevE.91.062703. Epub 2015 Jun 8.

Scaling and optimal synergy: Two principles determining microbial growth in complex media

Affiliations

Scaling and optimal synergy: Two principles determining microbial growth in complex media

Francesco Alessandro Massucci et al. Phys Rev E Stat Nonlin Soft Matter Phys. 2015 Jun.

Abstract

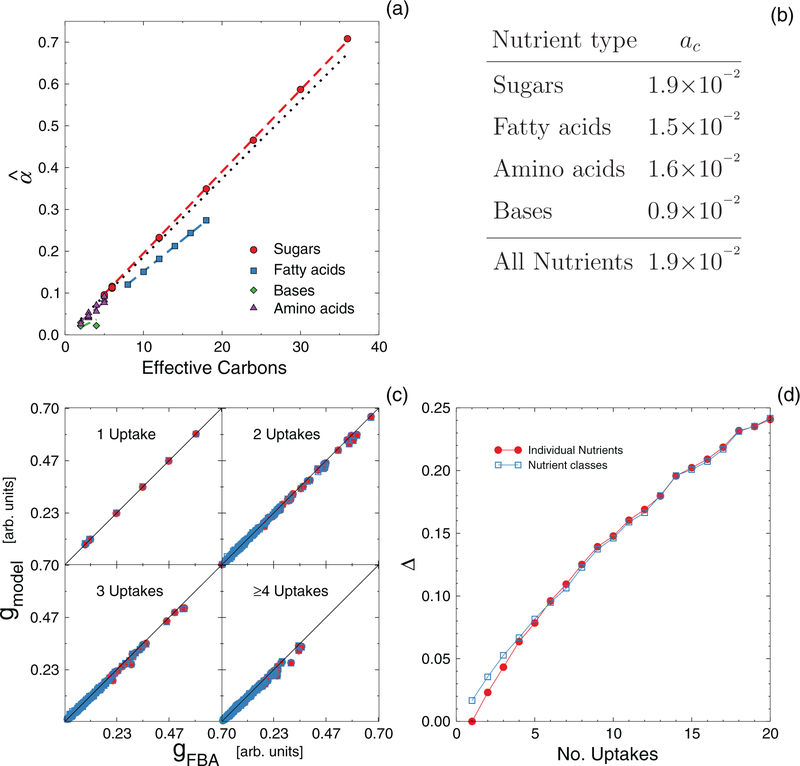
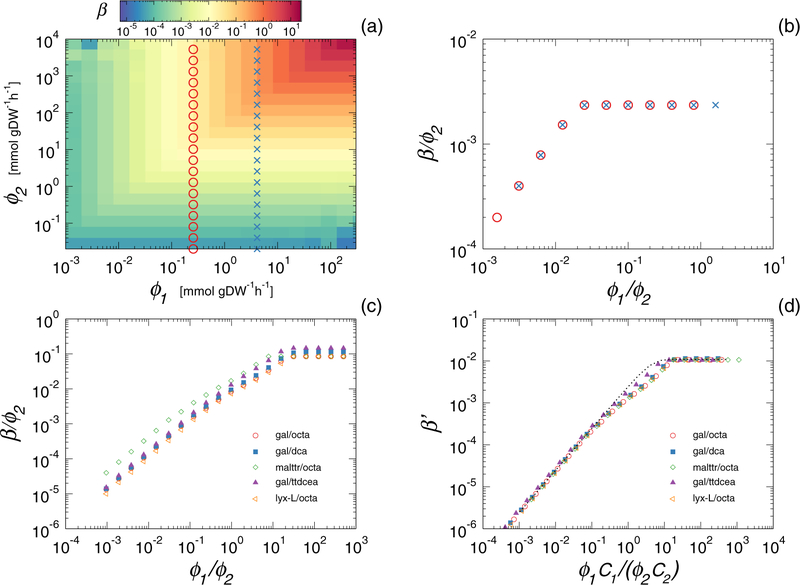
High-throughput experimental techniques and bioinformatics tools make it possible to obtain reconstructions of the metabolism of microbial species. Combined with mathematical frameworks such as flux balance analysis, which assumes that nutrients are used so as to maximize growth, these reconstructions enable us to predict microbial growth. Although such predictions are generally accurate, these approaches do not give insights on how different nutrients are used to produce growth, and thus are difficult to generalize to new media or to different organisms. Here, we propose a systems-level phenomenological model of metabolism inspired by the virial expansion. Our model predicts biomass production given the nutrient uptakes and a reduced set of parameters, which can be easily determined experimentally. To validate our model, we test it against in silico simulations and experimental measurements of growth, and find good agreement. From a biological point of view, our model uncovers the impact that individual nutrients and the synergistic interaction between nutrient pairs have on growth, and suggests that we can understand the growth maximization principle as the optimization of nutrient synergies.


Figures

FIG. 1.
FIG. 1.
(Color online) Idealized metabolism theory. (a) The α^ parameters introduced in Eq. (2), vs the number of effective carbons for each of the nutrients considered in our study. We consider nutrients in four groups: sugars, fatty acids, bases, and amino acids. The α^ coefficients are a linear function of the effective number of carbons whose slope depends very weakly on the nutrient class, except for bases [see panel (b)]. The dashed lines show linear fits for each class of nutrients, while the black dotted line is a fit considering all of them together. (b) The coefficients ac introduced in Eq. (3). We show the values of ac obtained from the fits shown in panel (a). ac varies weakly with nutrient class. (c) Predictions of the idealized metabolism theory, Eq. (2), vs FBA results for a selection of 100 random media with increasing number of possible uptakes (see Methods). Filled red circles correspond to using exact α values, and empty blue squares to Eq. (3). (d) The relative error Δ=|gFBAgmodel|gFBA of the IM theory predictions for the two different choices of α^ averaged over 500 random media, for increasing number of uptakes. Δ is relatively small in presence of a few nutrients only, but it increases roughly linearly. Note that the error performed when using Eq. (3) in presence of one nutrient only is different from zero, meaning that Eq. (3) does not correctly capture single nutrient contributions to growth. This effect however is negligible increasing the number of nutrients, as the two Δ curves overlap.
FIG. 2.
FIG. 2.
(Color online) Scaling of nutrient synergy contributions. (a) The function β, Eq. (4), that expresses the gap between the linear model predictions Eq. (2) and the FBA results for the growth rate of E. coli, when there are two nutrient uptakes different from zero. We show here the simultaneous uptake of dodecanoate and butyrate (both fatty acids) as a typical example. β is a growing function of the exchange fluxes of both nutrients. The circles and crosses correspond to the two (example) curves that are shown, once rescaled, in panel (b). (b) Scaling property of β, Eq. (5). We plot the same data points of panel (a): each curve shows β/ϕ2 as a function of ϕ1/ϕ2, for two different fixed values of ϕ1. Such normalization allows us to collapse all points on the same curve. (c) The function Eq. (5) for a set of five sugar-fatty acid pairs, that shows a characteristic linear-plateau behavior. (d) The rescaling property Eq. (6). We rescale the uptake fluxes of the nutrient pairs shown in panel (c) with the number of carbons of each nutrient. All the points collapse on the same curve. The dotted line corresponds to the function Eq. (7), where we set b¯sfa, b¯fas as the average of the set bs·fa, bfa·s for all the sugar-fatty acid pairs.
FIG. 3.
FIG. 3.
(Color online) Nutrient synergy contributions. We show the β′ function, Eq. (6), for pairs of four nutrient classes: sugars, fatty acids, bases, and amino acids. Dashed lines correspond to the function in Eq. (7) where the parameters {bκJ} are averaged over all pair of nutrients in the corresponding pair of classes.
FIG. 4.
FIG. 4.
(Color online) Second order equitative synergy theory. (a) Predictions of the optimized synergy model (OS) Eq. (9), empty blue squares, vs the FBA results, compared with the IM theory Eq. (2), filled red circles, for 100 different random media at increasing number of uptakes (see Methods and Appendix C for the details on growth media). Here, we use the exact values of parameter α^ and the average interclass value of parameters b. (b) The relative error Δ=|gmodelgFBA|gFBA vs the number of uptakes for the IM (filled red circles) and the OS model (empty blue squares), averaged over 500 different random media. The relative error of the IM theory grows almost linearly, while it remains much lower in the OS model and becomes roughly independent of the number of uptakes for E ⩾ 6.
FIG. 5.
FIG. 5.
(Color online) Comparison of the OS model, Eq. (9) (y axis), with the experimental growth of Beg et al. [20] (x axis); the dashed diagonal line indicates perfect agreement. The uptakes corresponding to each experimental growth rate were computed (Appendix F) and used as an input of the OS model to evaluate the predicted growth. The x error bars are one standard error, the y error bars indicate all feasible growths consistent with the uptakes plus or minus their error. We find a fair agreement between our theory and the experimental measurements, supporting that scaling and synergy are two principles regulating also microbial growth in vivo.
FIG. 6.
FIG. 6.
(Color online) Illustration of how random media are generated. Besides the minimal medium, we only consider growth on sugars, fatty acids, amino acids, and bases. Each random medium we generate only contains one sugar (the purple filled arrow), plus a set of other nutrients. The sugar and the remaining nutrients are all uniformly chosen at random. These nutrients and their uptake value form a random vector of exchange fluxes ϕ. In the figure we sketch as filled arrows all the nutrients included in the random medium and as empty arrows the ones not considered. For any random medium considered, uptakes are normalized so that ∑i ϕi = 1 arb. units.
FIG. 7.
FIG. 7.
(Color online) Number of amino acids in sets H and L for each metabolic pathway. We see that the amount of amino acids in each set is uneven in the majority of pathways, with most of them only featuring amino acids in the L set. We opted to exploit this characteristic to predict to which set each amino acid belongs and automatically assign it a β′ plateau value.
FIG. 8.
FIG. 8.
(Color online) The Bayesian information criterion as a function of the number of pathways n. Starting with zero pathways, we iteratively incorporated into the model Eq. (D1) the metabolic pathway that yielded the minimum BIC. This allows us to gain predictive power and to lower the BIC up to n = 6 pathways (black arrow). Inclusion of further information does not enhance the predictive ability and only overfits the model.
FIG. 9.
FIG. 9.
(Color online) The probabilities Pi(iH|πi) of each amino acid i varying the number of pathways n included in the model πi. The shaded green area highlights the expected region where Pi should lie, i.e., Pi[0,0.5] and Pi(0.5,1] for amino acids in sets L and H respectively. For the majority of them, the inclusion of only a few pathways in πi is enough to predict the correct set. When n = 6, that is, when the BIC is minimum, we correctly capture the behavior of all amino acids except for D-methionine (met_D).
FIG. 10.
FIG. 10.
(Color online) Second order model predictions. (a) Prediction of model bacterial growth against FBA results, for four models (see text): IM, NES, ES, OS. The idealized metabolism (IM, red circles) captures reasonably well FBA growth predictions. Including maximal synergy for all the nutrient pairs with a naive equitative synergy theory (NES, purple up triangles) largely overestimates the FBA growth. Considering a uniform uptake for all nutrient pairs with the equitative theory (ES, green diamonds) improves the IM results. When the number of uptakes is ≫ 1, all these models produce worse results than the optimized synergy model (OS, blue squares). (b) The relative error Δ of the different models as a function of the FBA growth gFBA. The baseline is the first order IM theory (red circles), with a relative error that increases roughly linearly with the number of uptakes. The NES model (purple up triangles) is clearly unrealistic, with a relative error that increases very fast. The ES model (green diamonds), conversely, improves the IM results, although its Δ still increases with the number of uptakes. The OS model error (blue squares) remains very low and depends very weakly on the number of uptakes, suggesting optimal allocation of synergies is a robust explanation for maximal growth.
FIG. 11.
FIG. 11.
(Color online) (a) Predictions of the OS model (blue open squares) vs the IM model (red filled circles), for complex media that may not include sugars. To better capture nonsugar synergies we allow here two different slopes to the β functions. (b) The relative error Δ of the OS model (blue empty squares) and the IM model (red filled circles). Also when sugars are not always uptaken the OS model has a consistently smaller relative error than the IM model.
FIG. 12.
FIG. 12.
(Color online) (a) The experimental uptakes ϕ computed via Eq. (F1), for the five nutrients considered in Fig. 2(b) of Beg et al. [20]. Glucose is almost totally consumed first, the rest of the nutrients are consumed for t > 3.5 h. Note that the dried weight, which normalizes the plotted values, steadily grows in time. The grey shaded area is the purely exponential growth time window [tgexpt(t) ≳ 1], where we pick the points plotted in Fig. 5. (b) Comparison of the growth rate gexpt(t) calculated via Eq. (F2) (Calc., red circles) and the values directly published in Fig. 2(a) of Ref. [20] (Publ., blue squares). The two quantities are fully consistent, all points but one being within one standard error. We use the values corresponding to the red circles to validate our model in Fig. 5, as they are also related to the dried weight employed to compute the nutrient uptakes. The shaded area once again denotes the pure exponential growth region.
FIG. 13.
FIG. 13.
(Color online) Model prediction of experimental growth rates. We compare here the accuracy of model Eq. (9) at predicting experimental bacterial growth rates when using Eq. (3) to estimate the α^ parameters (red circles) and by using the exact values of α^ (blue squares), which are evaluated by estimating the nutrients yield. Equation (3) performs fairly well, its predictions being only slightly worse than the ones obtained with the exact α^s. This is remarkable, as it implies that, when dealing with physiological values, one can accurately predict growth rates by only knowing the slope ac of each nutrient class and the carbon content of each nutrient, respectively, rather than the exact yield.

Similar articles

References

    1. Ray LB, Science 330, 1337 (2010). - PubMed
    1. Henry CS, DeJongh M, Best AA, Frybarger PM, Linsay B, and Stevens RL, Nat. Biotechnol 28, 977 (2010). - PubMed
    1. Christian N, May P, Kempa S, Handorf T, and Ebenhoh O, Mol. BioSyst 5, 1889 (2009). - PubMed
    1. Orth JD and Palsson B, BMC Syst. Biol 6, 30 (2012). - PMC - PubMed
    1. Oberhardt MA, Palsson BO, and Papin JA, Mol. Syst. Biol 5, 320 (2009). - PMC - PubMed

Publication types

LinkOut - more resources