. 2015 Sep;74(3):614-21.
doi: 10.1002/mrm.25803. Epub 2015 Jul 14.

High-resolution variable-density 3D cones coronary MRA

Affiliations

High-resolution variable-density 3D cones coronary MRA

Nii Okai Addy et al. Magn Reson Med. 2015 Sep.

Abstract

Purpose: To improve the spatial/temporal resolution of whole-heart coronary MR angiography by developing a variable-density (VD) 3D cones acquisition suitable for image reconstruction with parallel imaging and compressed sensing techniques.

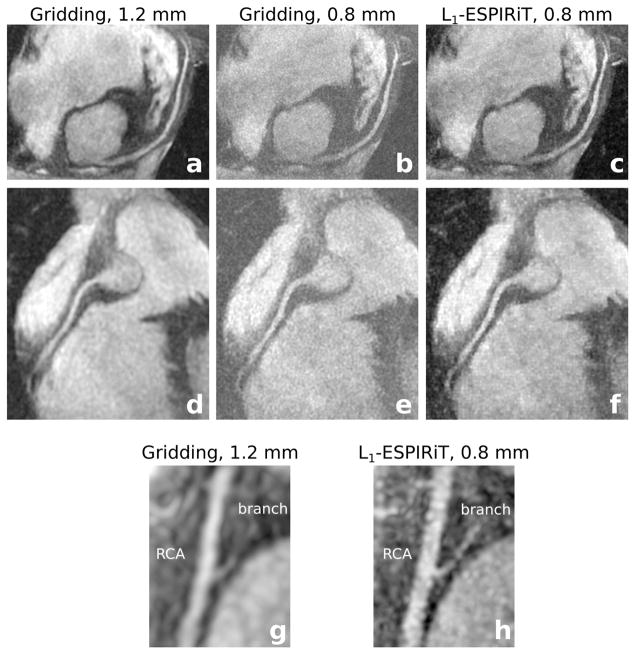
Methods: A VD 3D cones trajectory design incorporates both radial and spiral trajectory undersampling techniques to achieve higher resolution. This design is used to generate a VD 3D cones trajectory with 0.8 mm/66 ms isotropic spatial/temporal resolution, using a similar number of readouts as our previous fully sampled cones trajectory (1.2 mm/100 ms). Scans of volunteers and patients are performed to evaluate the performance of the VD trajectory, using non-Cartesian L1 -ESPIRiT for high-resolution image reconstruction.

Results: With gridding reconstruction, the high-resolution scans experience an expected drop in signal-to-noise and contrast-to-noise ratios, but with L1 -ESPIRiT, the apparent noise is substantially reduced. Compared with 1.2 mm images, in each volunteer, the L1 -ESPIRiT 0.8 mm images exhibit higher vessel sharpness values in the right and left anterior descending arteries.

Conclusion: Coronary MR angiography with isotropic submillimeter spatial resolution and high temporal resolution can be performed with VD 3D cones to improve the depiction of coronary arteries.

Keywords: 3D cones; coronary imaging; parallel imaging; trajectory design.


Figures

Figure 1
Figure 1
The path of the 3D cones trajectory on each conic surface is determined based on Gtwist, which is the ratio of circumferential to radial movement (a). A variable-density trajectory is generated by reducing Gtwist, which increases the spacing between loops of the projected spiral. A single readout path from fully sampled and variable-density trajectories is displayed. The sampling density functions for the two trajectories are also displayed (b).
Figure 2
Figure 2
L1-ESPIRiT adapted for VD 3D cones CMRA. The left of the diagram illustrates the 2D image-based motion correction. The right of the diagram illustrates the calculation of coil sensitivity maps. Iterative reconstruction is performed using a method based on FISTA in the final step.
Figure 3
Figure 3
A comparison of reformatted, maximum intensity projection (MIP), volunteer images of the LAD (a–c) and RCA (d–h) acquired with 1.2 and 0.8 mm isotropic resolutions. The 1.2 mm resolution images were reconstructed with gridding and the 0.8 mm resolution images were reconstructed with both gridding and L1-ESPIRiT. An additional reformat (g,h) is displayed at both resolutions showing a branch of the RCA.
Figure 4
Figure 4
SNR and blood-to-myocardium CNR measurements in the left ventricle (LV) and right ventricle (RV) in gridded images with 1.2 and 0.8 mm resolution. Measurements from all three cardiac phases are included. The error bars indicate the standard error of the mean.
Figure 5
Figure 5
Reformatted, 0.8 mm resolution, MIP images reconstructed with gridding (left) and L1-ESPIRiT (right).
Figure 6
Figure 6
Right coronary (RCA) and left anterior descending (LAD) artery vessel sharpness measured in volunteers (V) and patients (P). Measurements are based on a single cardiac phase of 1.2 mm resolution images reconstructed with gridding and 0.8 mm resolution images reconstructed with L1-ESPIRiT. Patients were scanned with the high-resolution trajectory only. The CoroEval software evaluates the vessel sharpness along an artery in 1 mm segments. The error bars on the plot indicate the standard error of the mean. Higher values correspond to a sharper vessel depiction.
Figure 7
Figure 7
0.75, 1.5, 2.25, 4, and 6 mm diameter cylindrical phantoms simulated (a) and imaged (b) with 1.2 and 0.8 mm resolutions. Phantom images are displayed for the stationary case. Air bubbles and banding artifacts are present in the larger vials, and low signal regions within these vials are a result of Gibbs phenomenon. Vessel sharpness measurements are shown for simulated images and phantom images with and without motion present at both resolutions (c). The error bars indicate the standard error of the mean.

Similar articles

Cited by

References

    1. Mendis S, Puska P, Norrving B, editors. Global atlas on cardiovascular disease prevention and control. World Health Organization; Geneva: 2011.
    1. Rochitte CE, George RT, Chen MY, Arbab-Zadeh A, Dewey M, Miller JM, Niinuma H, Yoshioka K, Kitagawa K, Nakamori S, Laham R, Vavere AL, Cerci RJ, Mehra VC, Nomura C, Kofoed KF, Jinzaki M, Kuribayashi S, de Roos A, Laule M, Tan SY, Hoe J, Paul N, Rybicki FJ, Brinker JA, Arai AE, Cox C, Clouse ME, Di Carli MF, Lima JAC. Computed tomography angiography and perfusion to assess coronary artery stenosis causing perfusion defects by single photon emission computed tomography: the CORE320 study. European Heart Journal. 2014;35:1120–1130. - PMC - PubMed
    1. Hoffmann U, Ferencik M, Cury RC, Pena AJ. Coronary CT angiography. Journal of Nuclear Medicine. 2006;47:797–806. - PubMed
    1. Sakuma H, Ichikawa Y, Chino S, Hirano T, Makino K, Takeda K. Detection of coronary artery stenosis with whole-heart coronary magnetic resonance angiography. J Am Coll Cardiol. 2006;48:1946–1950. - PubMed
    1. Yang Q, Li K, Liu X, Bi X, Liu Z, An J, Zhang A, Jerecic R, Li D. Contrast-enhanced whole-heart coronary magnetic resonance angiography at 3. 0-T: a comparative study with X-ray angiography in a single center. J Am Coll Cardiol. 2009;54:69–76. - PMC - PubMed

Publication types