. 2015 Jul 14;10(7):e0132572.
doi: 10.1371/journal.pone.0132572. eCollection 2015.

Moles of a Substance per Cell Is a Highly Informative Dosing Metric in Cell Culture

Affiliations

Moles of a Substance per Cell Is a Highly Informative Dosing Metric in Cell Culture

Claire M Doskey et al. PLoS One. .

Abstract

Background: The biological consequences upon exposure of cells in culture to a dose of xenobiotic are not only dependent on biological variables, but also the physical aspects of experiments e.g. cell number and media volume. Dependence on physical aspects is often overlooked due to the unrecognized ambiguity in the dominant metric used to express exposure, i.e. initial concentration of xenobiotic delivered to the culture medium over the cells. We hypothesize that for many xenobiotics, specifying dose as moles per cell will reduce this ambiguity. Dose as moles per cell can also provide additional information not easily obtainable with traditional dosing metrics.

Methods: Here, 1,4-benzoquinone and oligomycin A are used as model compounds to investigate moles per cell as an informative dosing metric. Mechanistic insight into reactions with intracellular molecules, differences between sequential and bolus addition of xenobiotic and the influence of cell volume and protein content on toxicity are also investigated.

Results: When the dose of 1,4-benzoquinone or oligomycin A was specified as moles per cell, toxicity was independent of the physical conditions used (number of cells, volume of medium). When using moles per cell as a dose-metric, direct quantitative comparisons can be made between biochemical or biological endpoints and the dose of xenobiotic applied. For example, the toxicity of 1,4-benzoquinone correlated inversely with intracellular volume for all five cell lines exposed (C6, MDA-MB231, A549, MIA PaCa-2, and HepG2).

Conclusions: Moles per cell is a useful and informative dosing metric in cell culture. This dosing metric is a scalable parameter that: can reduce ambiguity between experiments having different physical conditions; provides additional mechanistic information; allows direct comparison between different cells; affords a more uniform platform for experimental design; addresses the important issue of repeatability of experimental results, and could increase the translatability of information gained from in vitro experiments.


Conflict of interest statement

Competing Interests: The authors have declared that no competing interests exist.

Figures

Fig 1
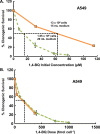
Fig 1. Dose of 1,4-BQ expressed as mol cell-1 allows direct comparisons between different experimental conditions and more accurately reports toxicity than initial concentration in medium.
Clonogenic survival of A549 cells was observed after a 4-h exposure to 1,4-BQ using two different experimental conditions: orange square, 13 x 106 cells exposed in 15.0 mL of medium; green diamond, 1.55 x 10⁶ cells exposed in 20.0 mL medium. The doses are expressed in: (A) Initial concentration in medium (μM), note that EC50 depends on the physical setup of the experiment; (B) Mol cell-1 basis (here fmol cell-1); note that ED50 is independent of the physical setup of the experiment. The two clonogenic survival curves are representative experiments with each point being the median of six plates. Error bars represent the standard error of the median; many error bars are smaller than the symbol.
Fig 2
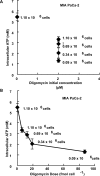
Fig 2. Dose specified as mol cell-1 more accurately reports toxicity of 1,4-BQ in cell culture experiments than initial concentration in medium.
(A) These data show two different physical setups for the experiments, black circle (1.7 x 10⁶ cells) and gray diamond (3.3 x 10⁶ cells). Clonogenic survival of MIA PaCa-2 cells was measured in triplicate after a 4-h exposure to 16.7 μM 1,4-BQ in different volumes of medium, yielding a range of doses on a mol per cell basis. No dose dependence is observed when the dose 1,4-BQ is expressed as the initial concentration in the culture medium. Error bars represent the standard deviation of the median of triplicate measures. (B) The data of panel A are transformed to express the dose of 1,4-BQ in units of fmol cell-1. A far better delineation of the dose-dependent toxicity is observed in each of the two sets of experiments. Error bars represent the standard deviation of the median of triplicate measures. (C) Using a varying number of MDA-MB231 cells, clonogenic survival varied considerably after a 4-h exposure to 16.7 μM 1,4-BQ in 10.0 mL of medium in T-25 culture flasks (each point has n = 2 for biological replicates, n = 3 within each replicate). Error bars represent the standard deviation of the mean. (D) As with MIA PaCa-2 cells, when the dose of 1,4-BQ is expressed in units of fmol cell-1, a much more informative delineation of the dose-dependent toxicity in MDA-MB231 cells is observed. Error bars represent the standard deviation of the mean. (E) Using a varying number of MIA PaCa-2 cells, intracellular ATP concentration of MIA PaCa-2 cells varied considerably after a 4-h exposure to 8.35 μM 1,4-BQ in 5.0 mL of medium in T-25 culture flasks (each point has a n = 2 for biological replicates, n = 2 within each replicate). Error bars represent the standard deviation of the mean; many standard deviations are smaller than the symbol. (F) When the dose of 1,4-BQ is expressed in units of fmol cell-1, a much more informative delineation of the dose-dependent effect on intracellular ATP concentration in MIA PaCa-2 cells is observed. Error bars represent the standard deviation of the mean.
Fig 3
Fig 3. Clonogenic survival correlates directly with intracellular ATP concentration following exposure to 1,4-BQ.
Clonogenic survival of MIA PaCa-2 cells following 4-h exposure to (0–1000 fmol cell-1) 1,4-BQ was plotted against intracellular ATP concentration of MIA PaCa-2 cells also following 4-h exposure to (0–1000 fmol cell-1) 1,4-BQ. Clonogenic survival directly correlates with intracellular ATP concentration following 4-h exposure to 1,4-BQ. Clonogenic survival is presented as the mean of n = 3 biological replicates with error bars representing the standard error of the mean. Intracellular ATP is presented as the mean of n = 2 biological replicates with error bars representing the standard error of the mean. Some error bars are smaller than the symbols.
Fig 4
Fig 4. Expressing dose as mol cell-1 yields more information and can be helpful when using biochemical tools in cell culture experiments: ATP per cell decreases with increasing dose of oligomycin A on a per cell basis.
The levels of ATP in MIA PaCa-2 cells were measured immediately after a 1-h exposure to oligomycin A. (A) ATP levels measured following a 1-h exposure of MIA PaCa-2 cells at varying cell densities to 2 μM oligomycin A in 3.0 mL medium. Doses of oligomycin A are expressed in initial concentration of oligomycin A in the medium (μM) (n = 4, error bars are standard deviation of the mean). (B) Doses of oligomycin A are expressed in mol cell-1 (fmol cell-1) (n = 4, error bars are standard deviation of the mean).
Fig 5
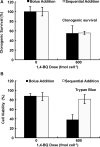
Fig 5. A single bolus addition or sequential additions of 1,4-BQ can provide differential toxicities based on the endpoint measured.
(A) Clonogenic survival of MIA PaCa-2 cells was evaluated after a bolus addition of 600 fmol cell-1 of 1,4-BQ or incremental additions of 1,4-BQ every 20 min over the 4-h exposure period (12 separate but equal additions) to yield a total dose of 600 fmol cell-1. Controls represent additions of DMSO only to the culture media using protocols parallel to additions of 1,4-BQ. Clonogenic survival was the same for both exposure methods (n = 3, error bars are standard deviation of the mean). There is no statistical difference in the clonogenic survival between the two protocols. Each is different from the controls (p < 0.05). (B) Cell viability as indicated with trypan blue staining produced quite different results using a bolus dose of 1,4-BQ vs. sequential addition (n = 3, error bars are standard deviation of the mean). A single bolus addition produces a significant difference between control and sequential addition (p < 0.05). Whereas the sequential addition is the same as the control (p > 0.05).
Fig 6
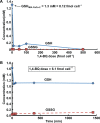
Fig 6. Glutathione is not depleted with 1:1 stoichiometry upon exposure of MIA PaCa-2 cells to 1,4-BQ.
(A) Intracellular concentration of GSH and GSSG in MIA PaCa-2 cells after a 30-min exposure to different doses of 1,4-BQ. The basal level of GSH in MIA PaCa-2 cell is 0.12 fmol cell-1 or 1.3 mM, assuming a uniform intracellular distribution and an intracellular volume of 2.03 pL cell-1, Table 1. To deplete 90% of the basal intracellular GSH a large excess of 1,4-BQ (10 fmol cell-1) is required. Additional depletion up to 99% requires ≈400 fold excess of 1,4-BQ. This implies that 1,4-BQ most likely reacts with extracellular targets; the fraction that enters the cells reacts with the multitude of targets available in the intracellular space. GSSG is not significantly produced (statistically) in these experiments. (B) Intracellular concentration of GSH and GSSG up to 24 h after exposure to a bolus of 1,4-BQ. Following exposure of MIA PaCa-2 cells to 1,4-BQ (6.1 fmol cell-1), an immediate 31% depletion in GSH levels is observed. There is no recovery of GSH for at least 24 h after exposure. There is little generation of GSSG, indicating negligible generation of H2O2. On a mol cell-1 basis, only 1 out of 100 of the molecules of 1,4-BQ that were present at the start of the exposure reacted with GSH; This demonstrates that GSH is not the exclusive target for 1,4-BQ. Shown here are typical experiment results, n = 3. The coefficient of variation in the GSH and GSSG measurements is 13%.
Fig 7
Fig 7. ED50 of 1,4-BQ correlates directly with intracellular volume and mass of protein per cell for C6, MB231, A549, MIA PaCa-2, and HepG2 cell lines.
(A) The dose of 1,4-BQ (mol cell-1) at which 50% clonogenic survival was observed for each cell type is plotted vs. the measured intracellular volume (Table 1). The correlation coefficient R2 is 0.74. Each cell line has n = 2 for biological replicates, n = 3 within each replicate. The measured intracellular volume represented is the mean of two different methods of measuring intracellular volume. Each cell line was measured (n = 3) using a Z2 Coulter Counter and a Moxi Z Mini Automated Cell Counter in ISOTON II Diluent (Beckman Coulter, Inc.). Error bars represent the standard error of the mean; some error bars are smaller than the symbol. (B) Mass of protein per cell directly correlates with intracellular volume (R2 = 0.76). Protein content was measured in the five cell lines used (C6, MDA-MB231, A549, MIA PaCa-2, and HepG2) by the SDS-Lowry protein assay. Some of the uncertainties in protein mass per cell are smaller than the symbols. Error bars represent the standard error of the mean. Each protein measurement has n = 3 for biological replicates, n = 3 within each replicate. (C) The ED50 of 1,4-BQ for C6, MB231, A549, MIA PaCa-2, and HepG2 cells (mol cell-1) is plotted vs. measured protein mass (pg) per cell. The correlation coefficient R2 is 0.96. Error bars represent the standard error of the mean. (D) The ED50 of 1,4-benzoquinone is expressed as fmol of 1,4-benzoquinone per pg protein for a cell. Each protein measurement has n = 3 for biological replicates, n = 3 within each replicate. Error bars represent the propagation of error as determined from the standard error of the means for both protein measurements and ED50 of 1,4-BQ. When dose of 1,4-BQ is expressed as fmol pg-1, there was no statistical difference in the ED50 of 1,4-BQ observed across the different cell lines. ANOVA showed p > 0.05 for all comparisons.
Fig 8
Fig 8. Depiction of target theory and exposure to 1,4-BQ.
The ten quinone moieties shown in each scenario represents the same mol cell-1. Here we assume that there are a certain number of sensitive/reactive “targets” within cells and the number of targets is proportional to intracellular volume. Damage to some fraction of those targets will produce a biological effect. Because larger cells have a greater number of targets, more 1,4-BQ will be required to produce the same biological effect as observed with smaller cells.
Fig 9
Fig 9. Exposure to xenobiotics when specified as mol cell-1 varies greatly when using different experimental platforms for cell culture.
Hypothetical cell culture experiments are shown where general recommendations, such as from Invitrogen (Life Technologies, Grand Island, NY), are followed for: seeding density, estimated number of cells at confluence, and media volume when using different cell culture vessels. In all hypothetical experiments, cells were exposed to an initial concentration of 10 μM xenobiotic in the medium. However, this leads to a wide range of doses when converted to mol cell-1. The size of each data point (circle) is proportional to the dose in units of nmol cell-1; the larger the area of the circle, the higher the exposure. Note that for platforms commonly used in wet bioscience laboratories, dose per cell varies over a range of 60-fold; if platforms used for high-throughput-screening are included (1536- and 3456-well plates) then dose per cell varies over a 106-fold range, despite the initial molar concentration of xenobiotic being the same for each experimental platform.

Similar articles

Cited by

References

    1. Halsey LG, Curran-Everett D, Vowler SL, Drummond GB. The fickle P value generates irreproducible results. Nat Methods. 2015;12: 179–185. 10.1038/nmeth.3288 10.1038/nmeth.3288 - DOI - DOI - PubMed
    1. Russel WMS, Burch RL. The principles of humane experimental technique. London: Methuen; 1959. Full text available at: http://altweb.jhsph.edu/pubs/books/humane_exp/het-toc accessed 2015.06.01
    1. Gülden M, Seibert H. In vitro-in vivo extrapolation: estimation of human serum concentrations of chemicals equivalent to cytotoxic concentrations in vitro. Toxicology. 2003;189: 211–222. 10.1016/S0300-483X(03)00146-X - DOI - PubMed
    1. Gülden M, Seibert H. Impact of bioavailability on the correlation between in vitro cytotoxic and in vivo acute fish toxic concentrations of chemicals. Aquat Toxicol. 2005;72: 327–337. 10.1016/j.aquatox.2005.02.002 - DOI - PubMed
    1. Groothuis FA, Heringa MB, Nicol B, Hermens JL, Blaauboer BJ, Kramer NI. Dose metric considerations in in vitro assays to improve quantitative in vitro-in vivo dose extrapolations. Toxicology. 2014;332: 30–40. 10.1016/j.tox.2013.08.012 - DOI - PubMed

Publication types

MeSH terms