

How Well Do Raters Agree on the Development Stage of Caenorhabditis elegans?
- PMID: 26172989
- PMCID: PMC4501796
- DOI: 10.1371/journal.pone.0132365
How Well Do Raters Agree on the Development Stage of Caenorhabditis elegans?
Abstract
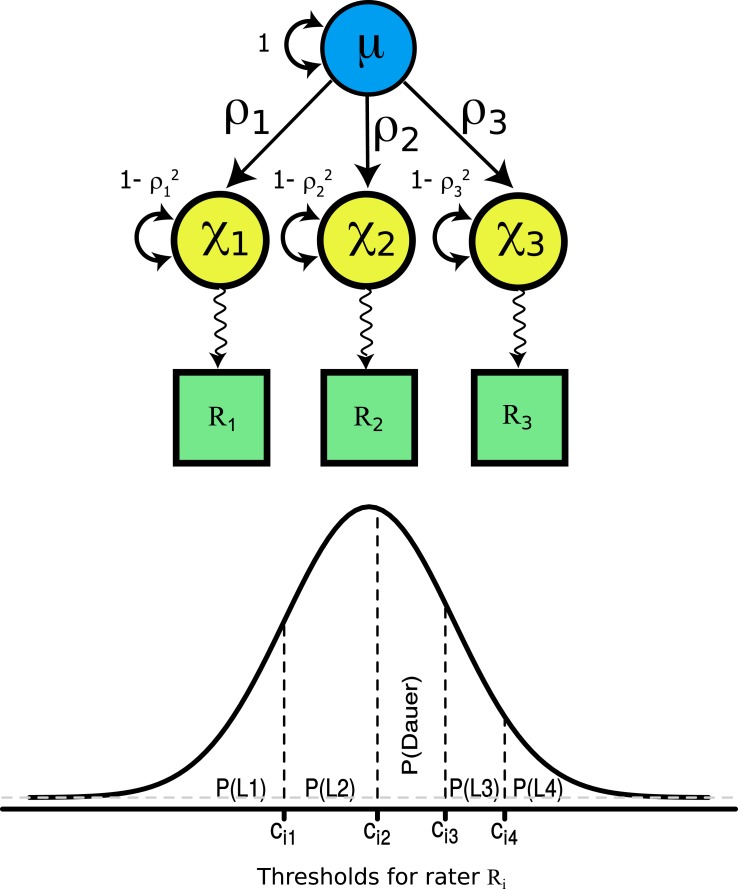
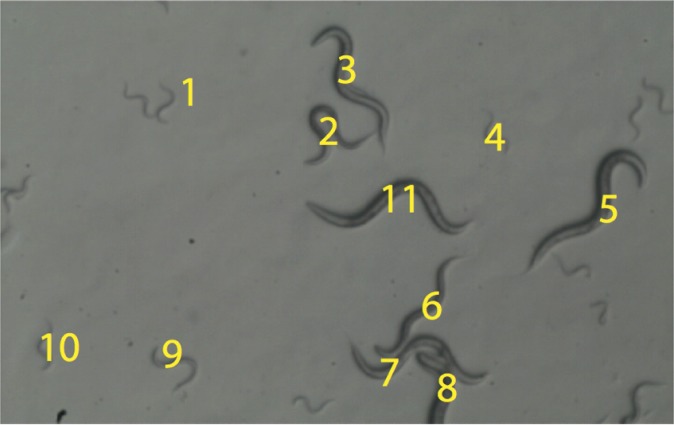
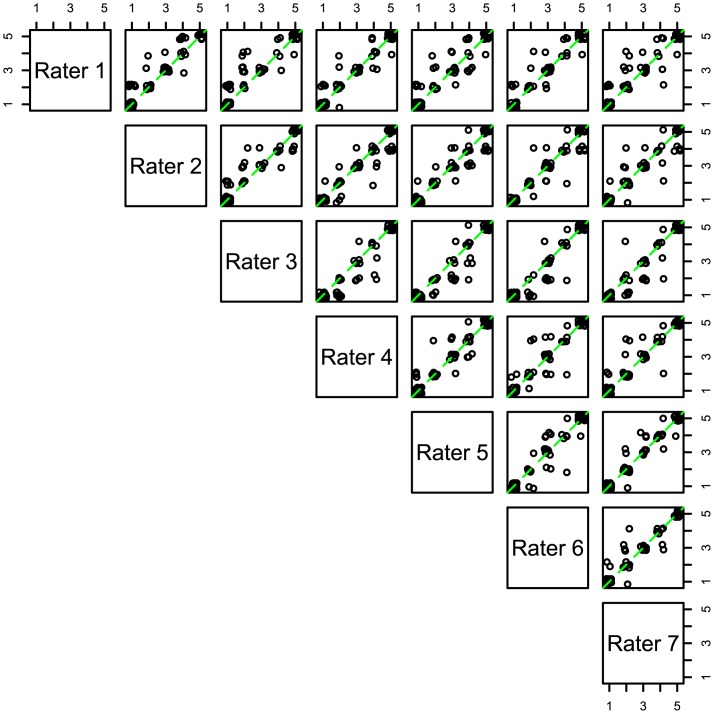
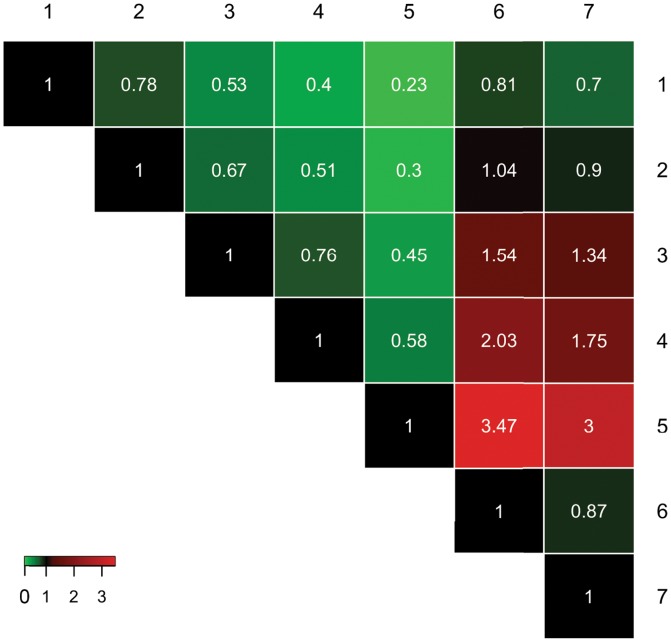
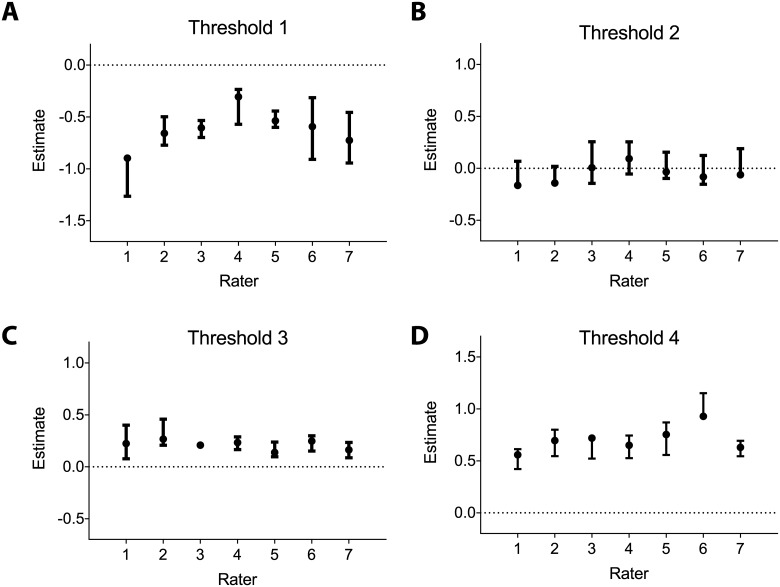
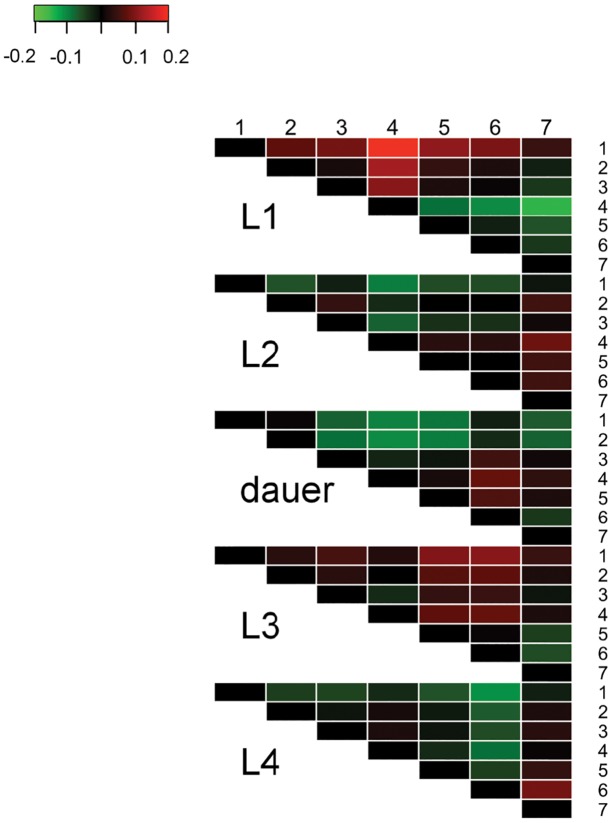
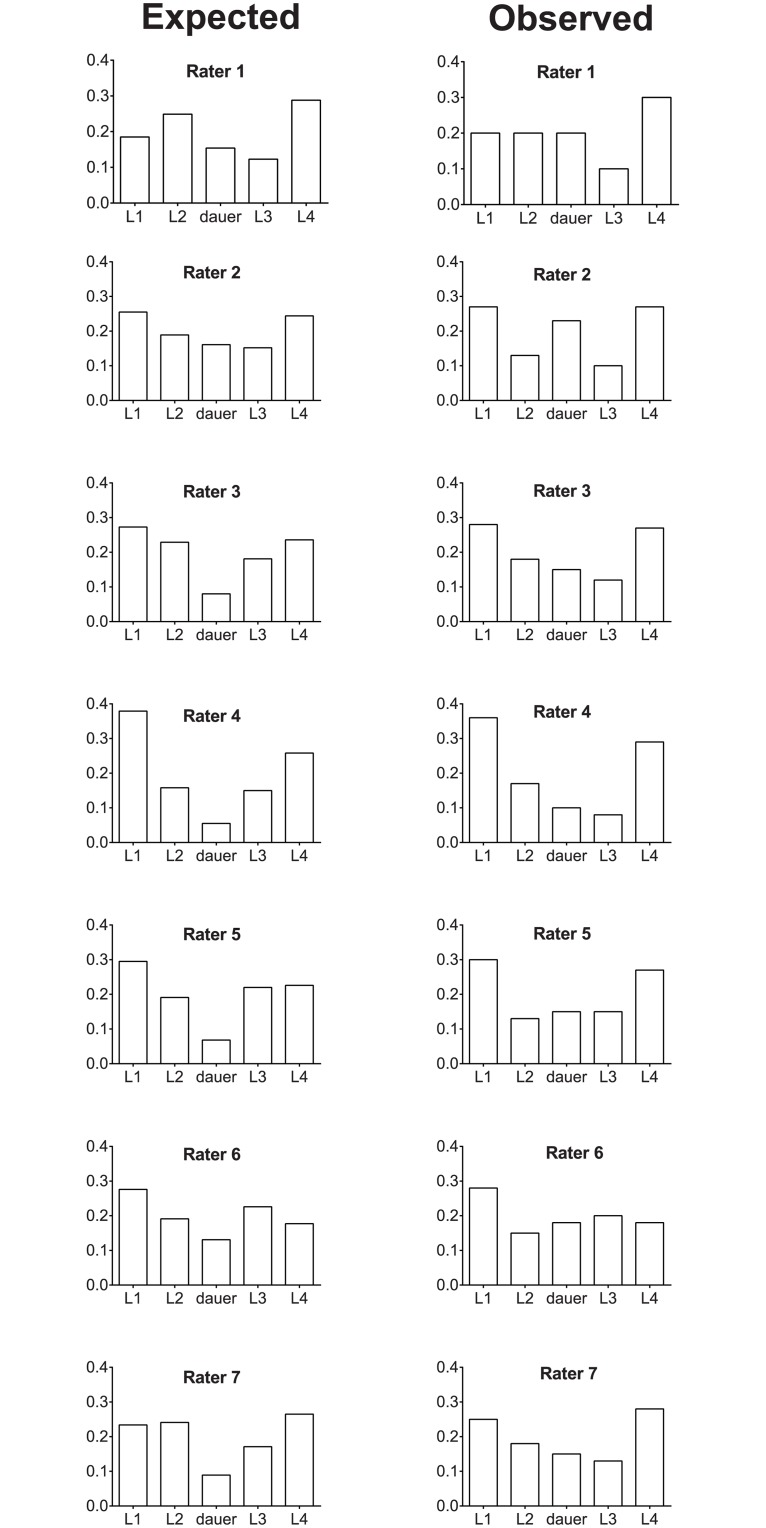
The assessment of inter-rater reliability is a topic that is infrequently addressed in Caenorhabditis elegans research, despite the existence of sophisticated statistical methods and the strong interest in the field in obtaining reliable and accurate data. This study applies statistical modeling as a robust means of analyzing the performance of worm researchers measuring the stage of worm development in terms of the two independent factors that comprise "agreement", which are (1) accuracy, representing trueness, a lack of systematic differences, or lack of bias, and (2) precision, representing reliability or the extent to which random differences are small. In our study, multiple raters assessed the same sample of worms to determine the developmental stage of each animal, and we collected data linking each scorer with their assessment for each worm. To describe the agreement of the raters, we developed a structural equation model with latent variables and thresholds, which assumes that all the raters are jointly scoring each worm. This common factor model separately quantifies the two aspects of agreement. The stage-specific thresholds examine accuracy and characterize the relative biases of each rater during the scoring process. The factor loadings for each rater examine the precision and characterizes the random error of the rater. Within our group, we found that the overall agreement was good, while certain adjustments in particular raters would have decreased systematic differences. Hence, the use of developmental stage as an experimental outcome can be both accurate and precise.
Conflict of interest statement
Figures
Similar articles
-
Effective number of subjects and number of raters for inter-rater reliability studies.Stat Med. 2006 May 15;25(9):1547-60. doi: 10.1002/sim.2294. Stat Med. 2006. PMID: 16143966
-
Reliability of the modified Rankin Scale across multiple raters: benefits of a structured interview.Stroke. 2005 Apr;36(4):777-81. doi: 10.1161/01.STR.0000157596.13234.95. Epub 2005 Feb 17. Stroke. 2005. PMID: 15718510
-
Inter-Rater Reliability and Intra-Rater Reliability of Assessing the 2-Minute Push-Up Test.Mil Med. 2016 Feb;181(2):167-72. doi: 10.7205/MILMED-D-14-00533. Mil Med. 2016. PMID: 26837086
-
Scoring reading parameters: An inter-rater reliability study using the MNREAD chart.PLoS One. 2019 Jun 7;14(6):e0216775. doi: 10.1371/journal.pone.0216775. eCollection 2019. PLoS One. 2019. PMID: 31173587 Free PMC article.
-
Inter-rater agreement on assessment of outcome within a trauma registry.Injury. 2016 Jan;47(1):130-4. doi: 10.1016/j.injury.2015.08.002. Epub 2015 Aug 10. Injury. 2016. PMID: 26304002
Cited by
-
Comparison of the Abilities of SD-OCT and SS-OCT in Evaluating the Thickness of the Macular Inner Retinal Layer for Glaucoma Diagnosis.PLoS One. 2016 Jan 26;11(1):e0147964. doi: 10.1371/journal.pone.0147964. eCollection 2016. PLoS One. 2016. PMID: 26812064 Free PMC article.
-
Genetic architecture and temporal analysis of Caenorhabditis briggsae hybrid developmental delay.PLoS One. 2022 Aug 11;17(8):e0272843. doi: 10.1371/journal.pone.0272843. eCollection 2022. PLoS One. 2022. PMID: 35951524 Free PMC article.
References
-
- Riddle DL, Swanson MM, Albert PS. Interacting genes in nematode dauer larva formation. Nature. 1981;290(5808):668–71. . - PubMed
-
- Ambros V. Heterochronic Genes In: Riddle DL, Blumenthal T, Meyer BJ, Priess JR, editors. C elegans II. 2nd ed Cold Spring Harbor (NY) 1997. - PubMed
-
- Cassada RC, Russell RL. The dauerlarva, a post-embryonic developmental variant of the nematode Caenorhabditis elegans. Developmental biology. 1975;46(2):326–42. . - PubMed
Publication types
MeSH terms
Grants and funding
LinkOut - more resources
Full Text Sources
Other Literature Sources
