. 2015 Oct;36(10):3777-92.
doi: 10.1002/hbm.22877. Epub 2015 Jul 14.

Age-related changes in the topological organization of the white matter structural connectome across the human lifespan

Affiliations

Age-related changes in the topological organization of the white matter structural connectome across the human lifespan

Tengda Zhao et al. Hum Brain Mapp. 2015 Oct.

Abstract

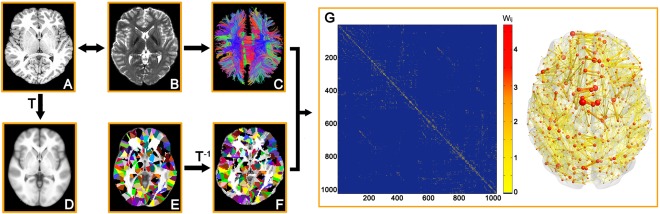
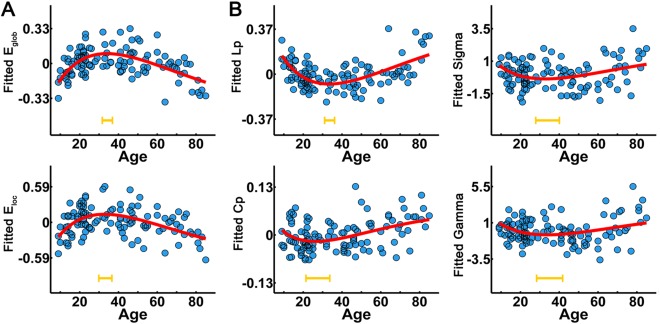
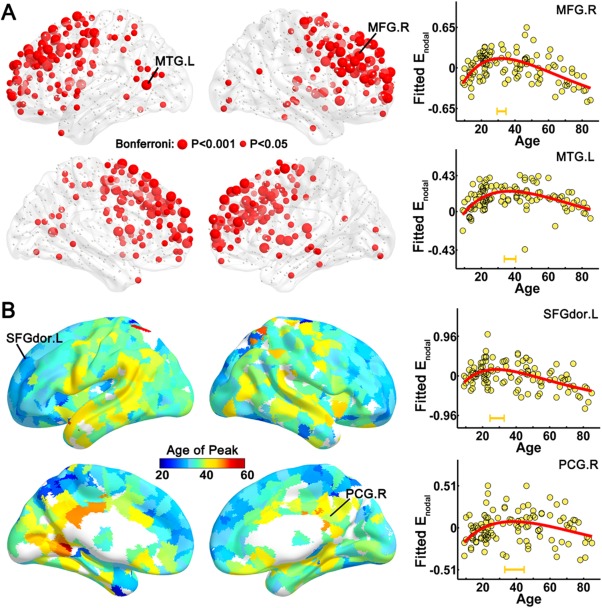
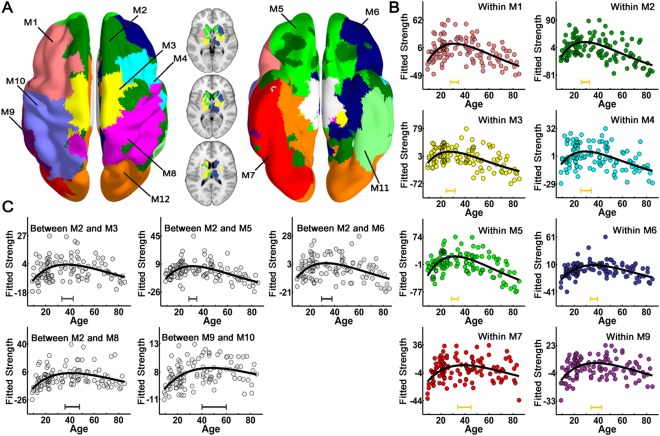
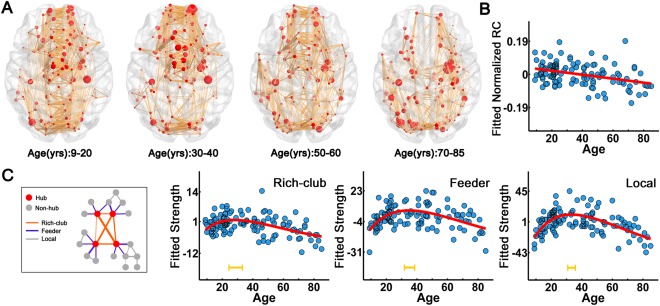
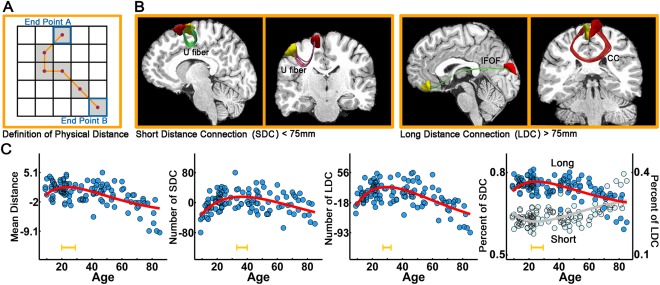
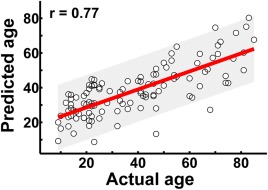
Lifespan is a dynamic process with remarkable changes in brain structure and function. Previous neuroimaging studies have indicated age-related microstructural changes in specific white matter tracts during development and aging. However, the age-related alterations in the topological architecture of the white matter structural connectome across the human lifespan remain largely unknown. Here, a cohort of 113 healthy individuals (ages 9-85) with both diffusion and structural MRI acquisitions were examined. For each participant, the high-resolution white matter structural networks were constructed by deterministic fiber tractography among 1024 parcellation units and were quantified with graph theoretical analyses. The global network properties, including network strength, cost, topological efficiency, and robustness, followed an inverted U-shaped trajectory with a peak age around the third decade. The brain areas with the most significantly nonlinear changes were located in the prefrontal and temporal cortices. Different brain regions exhibited heterogeneous trajectories: the posterior cingulate and lateral temporal cortices displayed prolonged maturation/degeneration compared with the prefrontal cortices. Rich-club organization was evident across the lifespan, whereas hub integration decreased linearly with age, especially accompanied by the loss of frontal hubs and their connections. Additionally, age-related changes in structural connections were predominantly located within and between the prefrontal and temporal modules. Finally, based on the graph metrics of structural connectome, accurate predictions of individual age were obtained (r = 0.77). Together, the data indicated a dynamic topological organization of the brain structural connectome across human lifespan, which may provide possible structural substrates underlying functional and cognitive changes with age.

Keywords: brain network; diffusion MRI; fiber tractography; graph theory; lifespan; white matter.


Figures

Figure 1
Figure 1
The flowchart of WM network construction by diffusion MRI. (1) The coregistration of a T1‐weighted image (A) to b = 0 image (B) for each subject. (2) The nonlinear registration from the individual T1‐weighted image in DTI space to the ICBM152 T1 template in the MNI space (D), resulting in a nonlinear transformation (T). (3) The application of the inverse transformation (T −1) to the H‐1024 template in the MNI space (E), resulting in subject‐specific parcellation in the DTI native space (F). All registrations were implemented in the SPM8 package. (4) The reconstruction of the whole‐brain WM fibers (C) was performed using deterministic tractography in DTI‐studio. (5) The weighted networks of each subject (G) were created by computing the number of the streamlines that connected each pair of brain regions. The matrix and 3D representation (axial view) of the WM structural network of a representative healthy subject are shown in the right panel. The nodes are located according to their centroid stereotaxic coordinates, and the edges are coded according to their connection weights. The network was visualized using BrainNet Viewer software (http://www.nitrc.org/projects/bnv/). See the Methods and Materials for further details. [Color figure can be viewed in the online issue, which is available at http://wileyonlinelibrary.com]
Figure 2
Figure 2
The lifespan trajectories of the global network metrics of the WM network. (A) The lifespan trajectories of global and local network efficiency. (B) The lifespan trajectories of small‐world properties (L p, C p, gamma, and sigma). The blue dots represent the adjusted values of each subject after controlling for gender and brain size. The curve‐fitted lines are shown in red. The orange bars at the bottom denote the age of peak and its 95% confidence interval. Significant age‐related nonlinear trajectories were found for these global network metrics (all P < 0.05). [Color figure can be viewed in the online issue, which is available at http://wileyonlinelibrary.com.]
Figure 3
Figure 3
The distribution of regions with significant age‐related alterations and the age of peaks across regions. (A) A 3D representation of brain regions with significant age‐related alterations of nodal efficiency. The red nodes represent regions with inverted U‐shaped trajectories with age (P < 0.05, Bonferroni correction); node size represents the significance of the age‐related alterations. Two representative nodes were selected to depict the age‐related trajectory curves of nodal efficiency, one is located in the right middle frontal gyrus (MFG.R) (upper right panel) and the other is in the left middle temporal gyrus (MTG.L) (lower right panel). (B) A 3D representation of the age of peaks across the regions with nonlinear trajectories (P < 0.05). Different colors of regional surface (from blue to red) represent different age of peaks. To present the early and late age of peaks, two nodes located in the left dorsal superior frontal gyrus (SFGdor.L) and the right posterior cingulate gyrus (PCG.R) were selected to depict the trajectory curves, respectively. The age of peaks (±95% confidence interval) were marked with orange bars. The surface visualization of WM networks was accomplished using the BrainNet Viewer software (http://www.nitrc.org/projects/bnv/).
Figure 4
Figure 4
The modular structure of the group‐averaged WM network and lifespan trajectories of the connection strength of intramodule and intermodules. (A) The left panel is a 3D representation of the group‐based modular structure (axial view) from top to bottom, with the bottom to top representation shown in the right panel. The modular structure of the subcortical regions was showed in the middle, with three axial slices overlaid on the volume template. Twelve modules were identified for the mean WM network and represented by different colors. Significant age‐related nonlinear changes of intramodule and intermodule connections were found and were primarily located in the bilateral prefrontal and temporal cortices (P < 0.05, Bonferroni correction). The dots with different colors corresponding to each module represent the intramodule connection strength (B) and the dots in gray represent intermodule connection strength (C) after controlling for gender and brain size. The curve‐fitted lines are shown in black. The bars at the bottom denote the age of peak and its 95% confidence interval. M1: left dorsal frontal cortex; M2: medial superior frontal cortex; M3: supplementary motor area; M4: right dorsal frontal gyrus; M5: orbital frontal cortex; M6: right inferior frontal and parahippocampal cortex; M7: left temporo‐occipital cortex; M8: right pre‐ and postcentral gyrus; M9: left middle temporal cortex; M10: left pre‐ and postcentral gyrus; M11: the right middle and inferior temporal gyrus; M12: the occipital cortex.
Figure 5
Figure 5
Rich‐club organization and its lifespan trajectories. (A) The rich‐club organization of different age subgroups. The red nodes represent the hub regions with mean Z‐scores of the nodal strength as nodal size. The orange lines represent the WM connections between hub regions identified from the average matrix of different subgroups. (B) Lifespan trajectory of normalized RC with age. (C) Lifespan trajectories of the strength of the rich‐club, feeder and local connections. The blue dots represent the adjusted values after controlling for gender and brain size. The curve‐fitted lines are shown in red. The orange bars at the bottom denote the age of peak and its 95% confidence interval. [Color figure can be viewed in the online issue, which is available at http://wileyonlinelibrary.com.]
Figure 6
Figure 6
The lifespan trajectories of the structural connectivity distance. (A) The distance of the anatomical connections is defined as the mean physical length along the fiber pathways connecting two regions. (B) Four representative short‐ (<75 mm) and long‐distance fiber connections (>75 mm) are shown in the right panel. IFOF: inferior fronto‐occipital fasciculus; CC: corpus callosum. (C) The lifespan trajectory of the mean network distance and the trajectories of the number and percent of short‐ and long‐distance connections. The blue dots represent the adjusted values after controlling for gender and brain size. The curve‐fitted lines are shown in red. The orange bars at the bottom denote the age of peak and its 95% confidence interval. [Color figure can be viewed in the online issue, which is available at http://wileyonlinelibrary.com.]
Figure 7
Figure 7
The prediction of individual age based on the graph metrics of structural connectome. The scatter plot depicts actual versus predicted age bounds of 95% confidential interval. Pearson correlation coefficient between the actual and predicted ages was calculated to assess the prediction accuracy. [Color figure can be viewed in the online issue, which is available at http://wileyonlinelibrary.com.]

Similar articles

Cited by

References

    1. Achard S, Bullmore E (2007): Efficiency and cost of economical brain functional networks. PLoS Comput Biol 3:e17 - PMC - PubMed
    1. Achard S, Salvador R, Whitcher B, Suckling J, Bullmore E (2006): A resilient, low‐frequency, small‐world human brain functional network with highly connected association cortical hubs. J Neurosci 26:63–72. - PMC - PubMed
    1. Akaike H (1974): A new look at statistical‐model identification. IEEE Trans Automat Control 19:716–723.
    1. Alvarez JA, Emory E (2006): Executive function and the frontal lobes: A meta‐analytic review. Neuropsychol Rev 16:17–42. - PubMed
    1. Ashburner J, Friston KJ (2005): Unified segmentation. NeuroImage 26:839–51. - PubMed

Publication types

MeSH terms