Higher oesophageal temperature at rest and during exercise in humans with patent foramen ovale
- PMID: 26173096
- PMCID: PMC4606538
- DOI: 10.1113/JP270219
Higher oesophageal temperature at rest and during exercise in humans with patent foramen ovale
Abstract
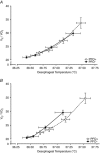
Respiratory system cooling occurs via convective and evaporative heat loss, so right-to-left shunted blood flow through a patent foramen ovale (PFO) would not be cooled. Accordingly, we hypothesized that PFO+ subjects would have a higher core temperature than PFO- subjects due, in part, to absence of respiratory system cooling of the shunted blood and that this effect would be dependent upon the estimated PFO size and inspired air temperature. Subjects were screened for the presence and size of a PFO using saline contrast echocardiography. Thirty well-matched males (15 PFO-, 8 large PFO+, 7 small PFO+) completed cycle ergometer exercise trials on three separate days. During Trial 1, subjects completed a V̇(O2max) test. For Trials 2 and 3, randomized, subjects completed four 2.5 min stages at 25, 50, 75 and 90% of the maximum workload achieved during Trial 1, breathing either ambient air (20.6 ± 1.0°C) or cold air (1.9 ± 3.5°C). PFO+ subjects had a higher oesophageal temperature (T(oesoph)) (P < 0.05) than PFO- subjects on Trial 1. During exercise breathing cold and dry air, PFO+ subjects achieved a higher T(oesoph) than PFO- subjects (P < 0.05). Subjects with a large PFO, but not those with a small PFO, had a higher T(oesoph) than PFO- subjects (P < 0.05) during Trial 1 and increased T(oesoph) breathing cold and dry air. These data suggest that the presence and size of a PFO are associated with T(oesoph) in healthy humans but this is explained only partially by absence of respiratory system cooling of shunted blood.
© 2015 The Authors. The Journal of Physiology © 2015 The Physiological Society.
Figures


Comment in
-
Patent foramen ovale: a leaking radiator?J Physiol. 2015 Oct 15;593(20):4513-4. doi: 10.1113/JP271316. J Physiol. 2015. PMID: 26466755 Free PMC article. No abstract available.
-
Temperature in the hot spot: oesophageal temperature and whole body thermal status in patent foramen ovale.J Physiol. 2015 Nov 1;593(21):4697-8. doi: 10.1113/JP271507. J Physiol. 2015. PMID: 26515306 Free PMC article. No abstract available.
References
-
- Altareki N, Drust B, Atkinson G, Cable T & Gregson W (2009). Effects of environmental heat stress (35 degrees C) with simulated air movement on the thermoregulatory responses during a 4‐km cycling time trial. Int J Sports Med 30, 9–15. - PubMed
-
- Borg GA (1973). Perceived exertion: a note on “history” and methods. Med Sci Sports 5, 90–93. - PubMed
-
- Burch GE (1945). Rate of water and heat loss from the respiratory tract of normal subjects in a subtropical climate. Arch Intern Med (Chic) 76, 315–327. - PubMed
-
- Cabanac M & White MD (1995). Core temperature thresholds for hyperpnea during passive hyperthermia in humans. Eur J Appl Physiol Occup Physiol 71, 71–76. - PubMed
-
- Christie A (1930). Normal closing time of the foramen ovale and the ductus arteriosus: an anatomic and statistical study. Archives of Pediatrics & Adolescent Medicine 40, 323.
Publication types
MeSH terms
LinkOut - more resources
Full Text Sources
Medical

