

Plant selection for ethnobotanical uses on the Amalfi Coast (Southern Italy)
- PMID: 26173678
- PMCID: PMC4508904
- DOI: 10.1186/s13002-015-0038-y
Plant selection for ethnobotanical uses on the Amalfi Coast (Southern Italy)
Abstract
Background: Many ethnobotanical studies have investigated selection criteria for medicinal and non-medicinal plants. In this paper we test several statistical methods using different ethnobotanical datasets in order to 1) define to which extent the nature of the datasets can affect the interpretation of results; 2) determine if the selection for different plant uses is based on phylogeny, or other selection criteria.
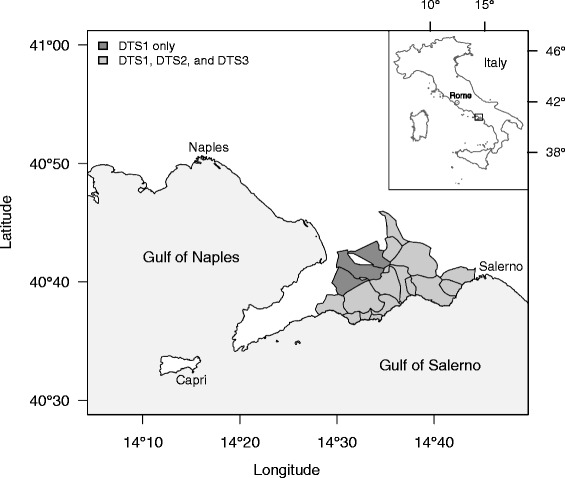
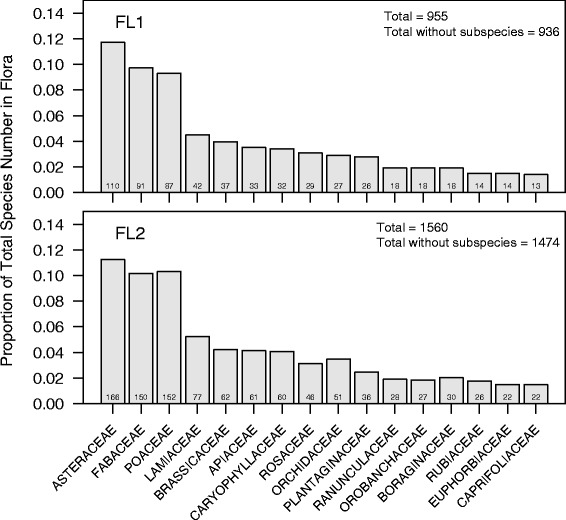
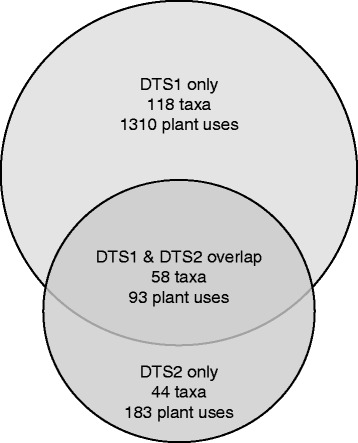
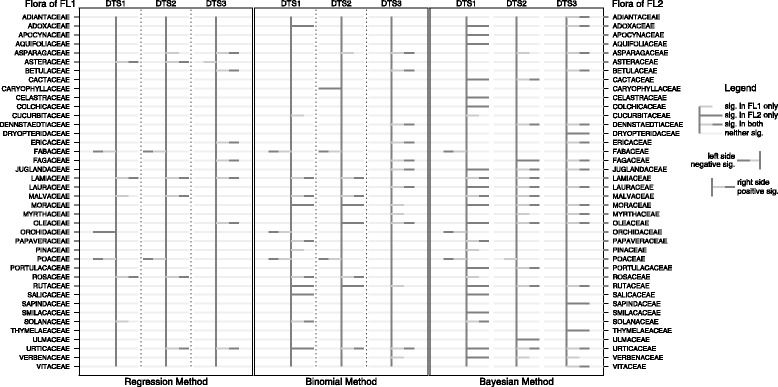
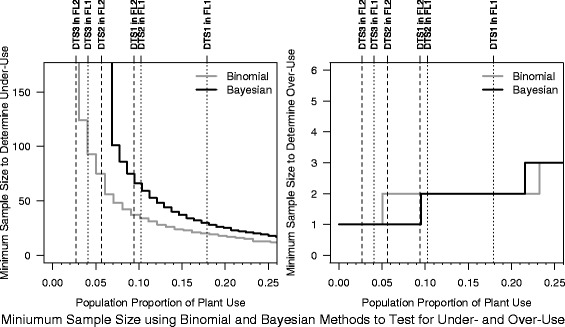
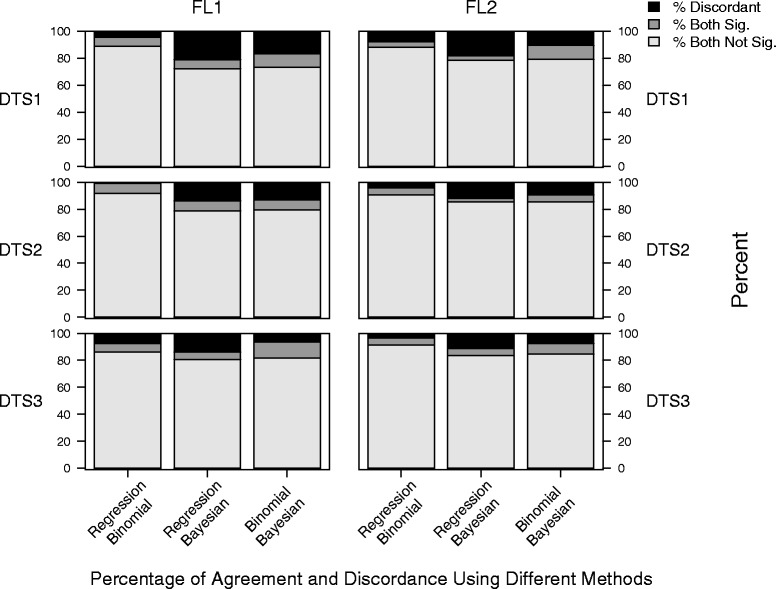
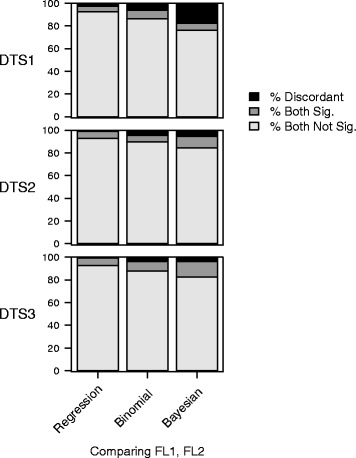
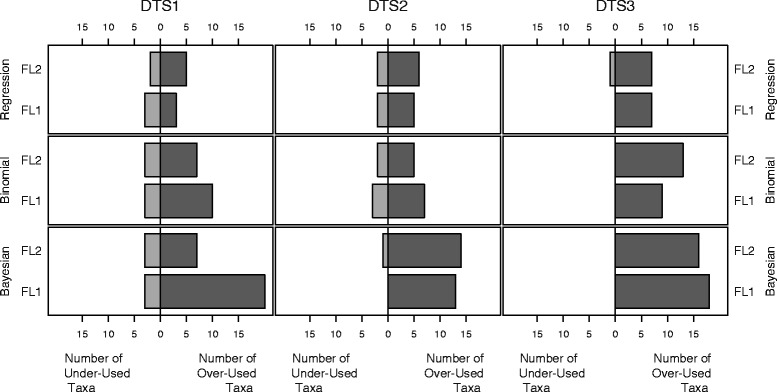
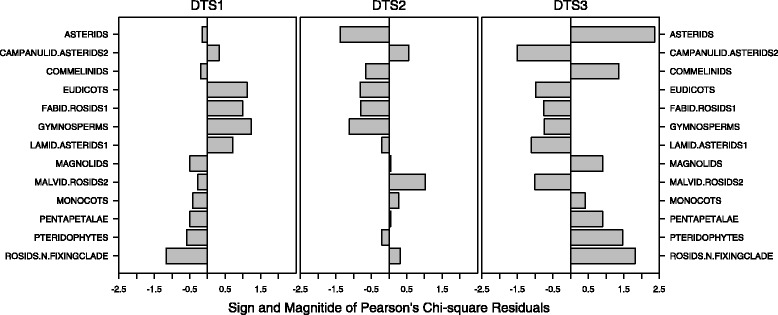
Methods: We considered three different ethnobotanical datasets: two datasets of medicinal plants and a dataset of non-medicinal plants (handicraft production, domestic and agro-pastoral practices) and two floras of the Amalfi Coast. We performed residual analysis from linear regression, the binomial test and the Bayesian approach for calculating under-used and over-used plant families within ethnobotanical datasets. Percentages of agreement were calculated to compare the results of the analyses. We also analyzed the relationship between plant selection and phylogeny, chorology, life form and habitat using the chi-square test. Pearson's residuals for each of the significant chi-square analyses were examined for investigating alternative hypotheses of plant selection criteria.
Results: The three statistical analysis methods differed within the same dataset, and between different datasets and floras, but with some similarities. In the two medicinal datasets, only Lamiaceae was identified in both floras as an over-used family by all three statistical methods. All statistical methods in one flora agreed that Malvaceae was over-used and Poaceae under-used, but this was not found to be consistent with results of the second flora in which one statistical result was non-significant. All other families had some discrepancy in significance across methods, or floras. Significant over- or under-use was observed in only a minority of cases. The chi-square analyses were significant for phylogeny, life form and habitat. Pearson's residuals indicated a non-random selection of woody species for non-medicinal uses and an under-use of plants of temperate forests for medicinal uses.
Conclusions: Our study showed that selection criteria for plant uses (including medicinal) are not always based on phylogeny. The comparison of different statistical methods (regression, binomial and Bayesian) under different conditions led to the conclusion that the most conservative results are obtained using regression analysis.
Figures
Similar articles
-
Quantitative methods in ethnobotany and ethnopharmacology: considering the overall flora--hypothesis testing for over- and underused plant families with the Bayesian approach.J Ethnopharmacol. 2011 Sep 1;137(1):837-43. doi: 10.1016/j.jep.2011.07.002. Epub 2011 Jul 7. J Ethnopharmacol. 2011. PMID: 21767623
-
Wild medicinal and food plants used by communities living in Mopane woodlands of southern Angola: Results of an ethnobotanical field investigation.J Ethnopharmacol. 2016 Jan 11;177:126-39. doi: 10.1016/j.jep.2015.11.041. Epub 2015 Nov 27. J Ethnopharmacol. 2016. PMID: 26639153
-
Ethnobotanical investigation on medicinal plants in the Vesuvio National Park (Campania, Southern Italy).J Ethnopharmacol. 2016 Nov 4;192:320-349. doi: 10.1016/j.jep.2016.07.049. Epub 2016 Jul 25. J Ethnopharmacol. 2016. PMID: 27457693
-
Diversity of wetland plants used traditionally in China: a literature review.J Ethnobiol Ethnomed. 2014 Oct 15;10:72. doi: 10.1186/1746-4269-10-72. J Ethnobiol Ethnomed. 2014. PMID: 25318542 Free PMC article. Review.
-
An overview on ethnobotanico-pharmacological studies carried out in Morocco, from 1991 to 2015: Systematic review (part 1).J Ethnopharmacol. 2021 Mar 1;267:113200. doi: 10.1016/j.jep.2020.113200. Epub 2020 Aug 1. J Ethnopharmacol. 2021. PMID: 32750461
Cited by
-
Plant parentage influences the type of timber use by traditional peoples of the Brazilian Caatinga.PLoS One. 2023 Oct 17;18(10):e0286434. doi: 10.1371/journal.pone.0286434. eCollection 2023. PLoS One. 2023. PMID: 37847702 Free PMC article.
-
Ethnobotanical knowledge in Calabria (southern Italy): A summary review.Heliyon. 2025 Jan 16;11(2):e42050. doi: 10.1016/j.heliyon.2025.e42050. eCollection 2025 Jan 30. Heliyon. 2025. PMID: 39911427 Free PMC article.
-
Wild food plants of Brazil: a theoretical approach to non-random selection.J Ethnobiol Ethnomed. 2023 Jul 8;19(1):28. doi: 10.1186/s13002-023-00603-6. J Ethnobiol Ethnomed. 2023. PMID: 37422690 Free PMC article.
-
Reducing Virulence and Biofilm of Pseudomonas aeruginosa by Potential Quorum Sensing Inhibitor Carotenoid: Zeaxanthin.Microb Ecol. 2017 Aug;74(2):466-473. doi: 10.1007/s00248-017-0949-3. Epub 2017 Mar 2. Microb Ecol. 2017. PMID: 28255686
-
Alien woody plants are more versatile than native, but both share similar therapeutic redundancy in South Africa.PLoS One. 2021 Nov 30;16(11):e0260390. doi: 10.1371/journal.pone.0260390. eCollection 2021. PLoS One. 2021. PMID: 34847163 Free PMC article.
References
-
- Albuquerque UP, de Lucena RFP. Can apparency affect the use of plants by local people in tropical forest? Interciencia. 2005;30:506–11.
Publication types
MeSH terms
LinkOut - more resources
Full Text Sources
Other Literature Sources
