. 2015 Jul 14;6(4):e00974.
doi: 10.1128/mBio.00974-15.

Antibiotic-Induced Alterations of the Murine Gut Microbiota and Subsequent Effects on Colonization Resistance against Clostridium difficile

Affiliations

Antibiotic-Induced Alterations of the Murine Gut Microbiota and Subsequent Effects on Colonization Resistance against Clostridium difficile

Alyxandria M Schubert et al. mBio. .

Abstract

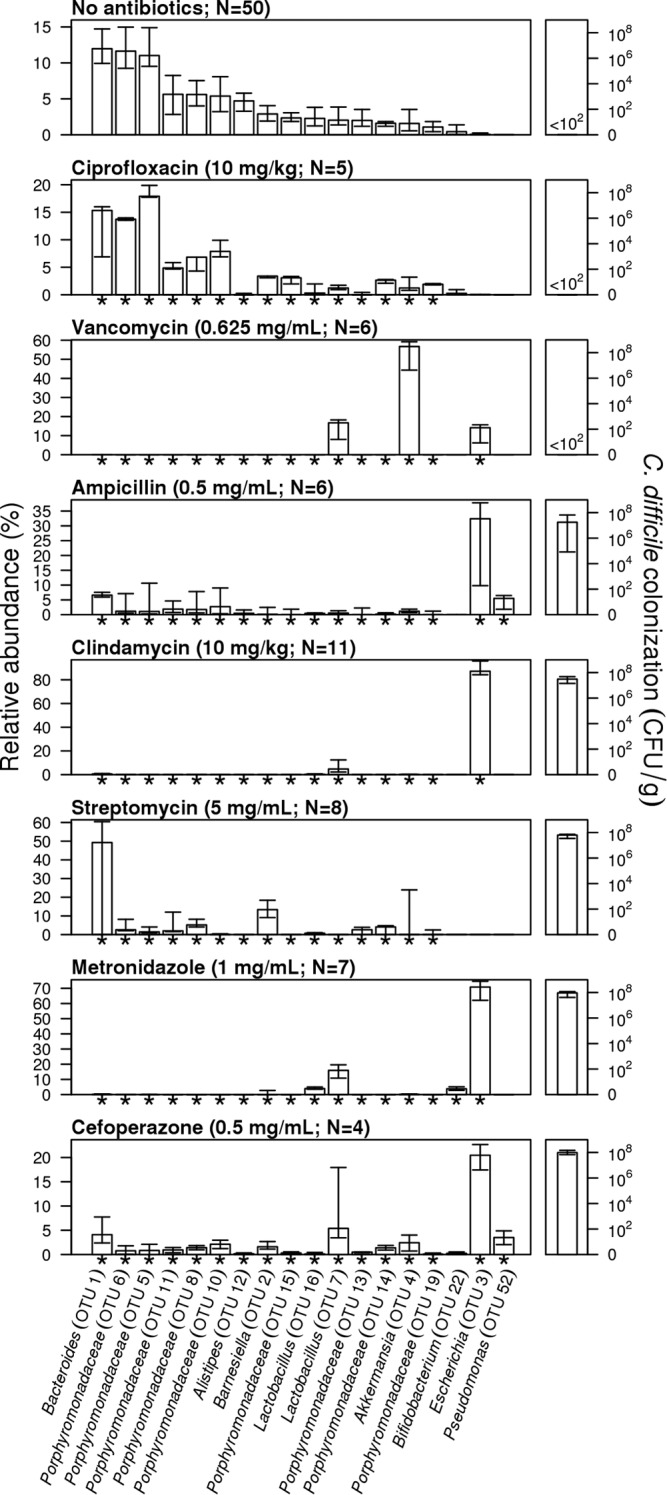
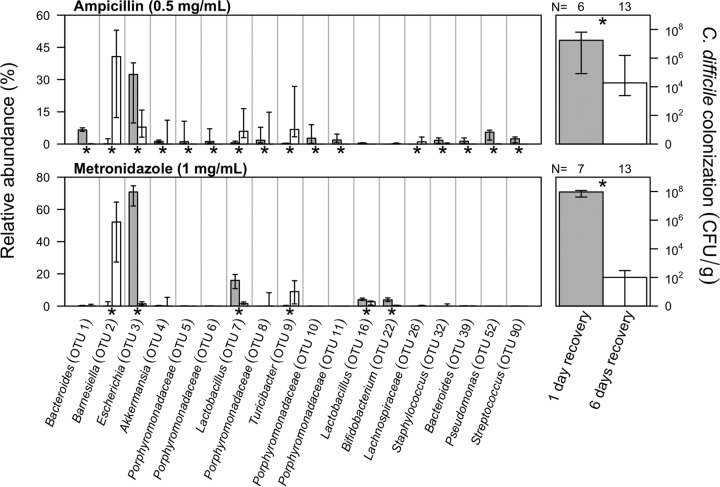
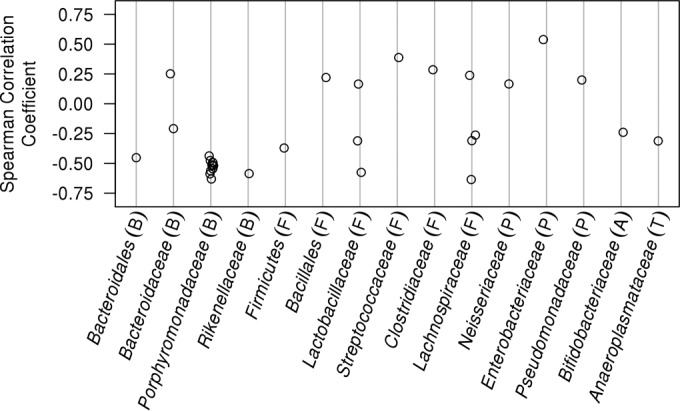
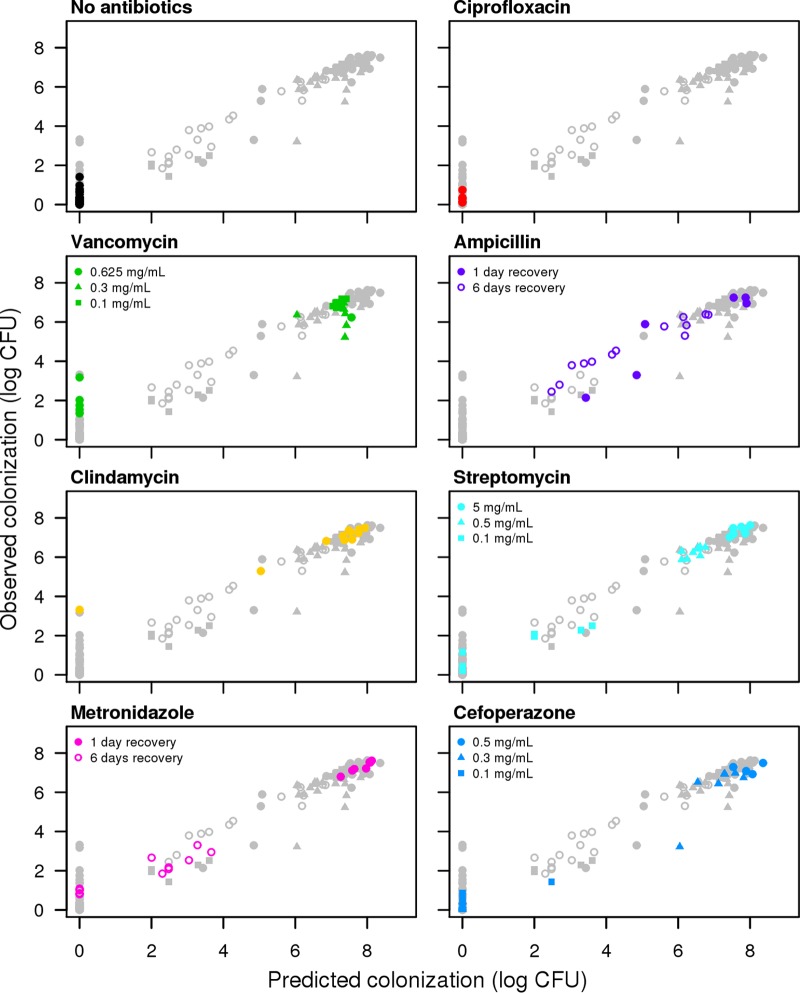
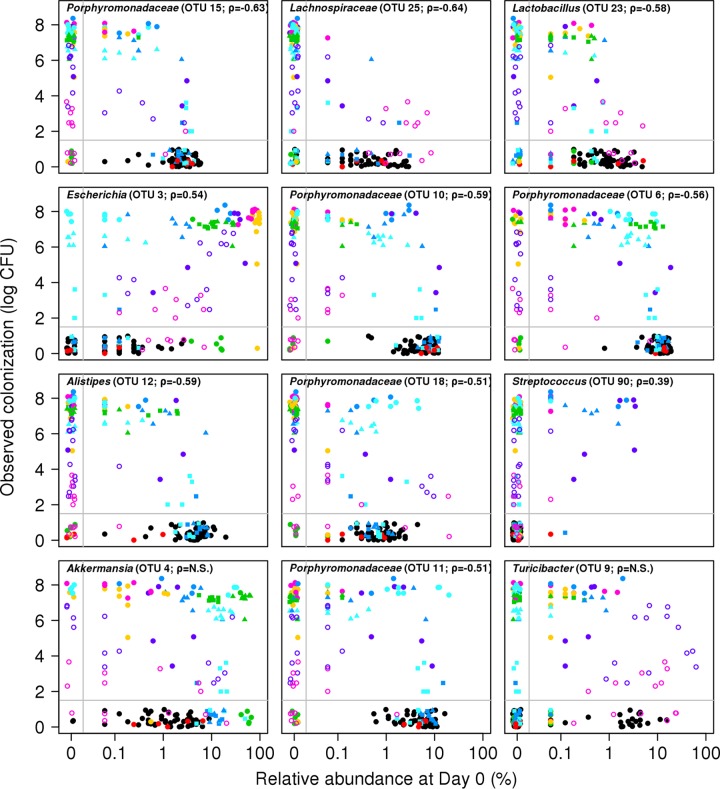
Perturbations to the gut microbiota can result in a loss of colonization resistance against gastrointestinal pathogens such as Clostridium difficile. Although C. difficile infection is commonly associated with antibiotic use, the precise alterations to the microbiota associated with this loss in function are unknown. We used a variety of antibiotic perturbations to generate a diverse array of gut microbiota structures, which were then challenged with C. difficile spores. Across these treatments we observed that C. difficile resistance was never attributable to a single organism, but rather it was the result of multiple microbiota members interacting in a context-dependent manner. Using relative abundance data, we built a machine learning regression model to predict the levels of C. difficile that were found 24 h after challenging the perturbed communities. This model was able to explain 77.2% of the variation in the observed number of C. difficile per gram of feces. This model revealed important bacterial populations within the microbiota, which correlation analysis alone did not detect. Specifically, we observed that populations associated with the Porphyromonadaceae, Lachnospiraceae, Lactobacillus, and Alistipes were protective and populations associated with Escherichia and Streptococcus were associated with high levels of colonization. In addition, a population affiliated with the Akkermansia indicated a strong context dependency on other members of the microbiota. Together, these results indicate that individual bacterial populations do not drive colonization resistance to C. difficile. Rather, multiple diverse assemblages act in concert to mediate colonization resistance.

Importance: The gastrointestinal tract harbors a complex community of bacteria, known as the microbiota, which plays an integral role preventing its colonization by gut pathogens. This resistance has been shown to be crucial for protection against Clostridium difficile infections (CDI), which are the leading source of hospital-acquired infections in the United States. Antibiotics are a major risk factor for acquiring CDI due to their effect on the normal structure of the indigenous gut microbiota. We found that diverse antibiotic perturbations gave rise to altered communities that varied in their susceptibility to C. difficile colonization. We found that multiple coexisting populations, not one specific population of bacteria, conferred resistance. By understanding the relationships between C. difficile and members of the microbiota, it will be possible to better manage this important infection.


Figures

FIG 1
FIG 1
Antibiotic treatments result in significant alterations to the structure of the microbiota and variation in colonization resistance. Bars indicate the median percent relative abundance of those selected OTUs from all treatment groups on the day of C. difficile challenge. Asterisks along the x axis indicate those OTUs that were significantly different from untreated mice for that antibiotic treatment after correcting for multiple comparisons. The error bars indicate the interquartile range. The median level C. difficile colonization found 24 h after microbiota sampling is plotted on the right for each treatment, with error bars indicating the interquartile range. The dose of antibiotic and the number of animals used in each treatment group are indicated for each antibiotic treatment group. The treatment groups are shown in order of the level of C. difficile colonization.
FIG 2
FIG 2
Titration of antibiotic perturbations results in altered community structures and C. difficile colonization resistance. Bars indicate the median percent relative abundance of those selected OTUs from all treatment groups on the day of C. difficile challenge. Asterisks along the x axis indicate those OTUs that varied significantly across doses of the same antibiotic after correcting for multiple comparisons. The error bars indicate the interquartile range. The number of animals used in each treatment group is indicated in the legend, which also gives the dose of each antibiotic that was used. The median level C. difficile colonization found 24 h after microbiota sampling is plotted on the right for each treatment, with error bars indicating the interquartile range. Letters above colonization levels indicate statistical differences between groups. Values that are not significantly different (NS) are indicated.
FIG 3
FIG 3
Increasing the recovery time following antibiotic perturbation restores colonization resistance. Bars indicate the median percent relative abundance of those selected OTUs from all treatment groups on the day of C. difficile challenge. Asterisks along the x axis indicate those OTUs that varied significantly between those mice that were allowed 1 or 6 days of recovery after correcting for multiple comparisons. The error bars indicate the interquartile range. The median level C. difficile colonization found 24 h after microbiota sampling is plotted on the right for each recovery period and antibiotic, with error bars indicating the interquartile range. The number of mice used in each treatment group is indicated above the C. difficile colonization data. The dose of each antibiotic is indicated next to the name of the antibiotic.
FIG 4
FIG 4
Diverse taxonomic groups are associated with low levels of C. difficile colonization. Spearman correlation coefficients were calculated using the relative abundance of OTUs found on the day that mice were challenged with C. difficile spores and the amount of C. difficile observed 24 h later. Only significant correlations are presented after correcting for multiple comparisons. OTUs are grouped by the taxonomic family. The phylum that the taxa belong to are indicated by letters within parentheses as follows: B, Bacteroidetes; F, Firmicutes; P, Proteobacteria; A; Actinobacteria; T, Tenericutes.
FIG 5
FIG 5
The random forest regression model predicts C. difficile colonization levels based on the structure of the microbiota. The overall model explained 77.2% of the variation in the data. Each panel shows antibiotic treatment groups in color and the other points as gray circles. The panels are shown in order of the level of C. difficile colonization when mice were treated with the highest dose of their respective antibiotic.
FIG 6
FIG 6
Relationship between OTU relative abundance and C. difficile colonization levels indicates nonlinearity and context dependency. The 12 OTUs that resulted in the greatest change in percent mean squared error when removed from the random forest regression model are shown in each panel and together explain 77.1% of the variation in the data. The Spearman correlation value between that OTU’s abundance and C. difficile levels are shown for each panel when the corrected P value was significant. The color and symbols represent the same antibiotic dose and recovery period as in Fig. 5. N.S., not significant.

Comment in

References

    1. Vollaard EJ, Clasener HA. 1994. Colonization resistance. Antimicrob Agents Chemother 38:409–414. doi:10.1128/AAC.38.3.409. - DOI - PMC - PubMed
    1. Chang JY, Antonopoulos DA, Kalra A, Tonelli A, Khalife WT, Schmidt TM, Young VB. 2008. Decreased diversity of the fecal microbiome in recurrent Clostridium difficile-associated diarrhea. J Infect Dis 197:435–438. doi:10.1086/525047. - DOI - PubMed
    1. Reeves AE, Theriot CM, Bergin IL, Huffnagle GB, Schloss PD, Young VB. 2011. The interplay between microbiome dynamics and pathogen dynamics in a murine model of Clostridium difficile infection. Gut Microbes 2:145–158. doi:10.4161/gmic.2.3.16333. - DOI - PMC - PubMed
    1. Wilson KH, Sheagren JN, Freter R. 1985. Population dynamics of ingested Clostridium difficile in the gastrointestinal tract of the Syrian hamster. J Infect Dis 151:355–361. doi:10.1093/infdis/151.2.355. - DOI - PubMed
    1. Bauer MP, Kuijper EJ. 2015. Potential sources of Clostridium difficile in human infection. Infect Dis Clin North Am 29:29–35. doi:10.1016/j.idc.2014.11.010. - DOI - PubMed

Publication types

MeSH terms

Substances

Associated data