Concentration-independent MRI of pH with a dendrimer-based pH-responsive nanoprobe
- PMID: 26173742
- PMCID: PMC4713357
- DOI: 10.1002/cmmi.1651
Concentration-independent MRI of pH with a dendrimer-based pH-responsive nanoprobe
Abstract
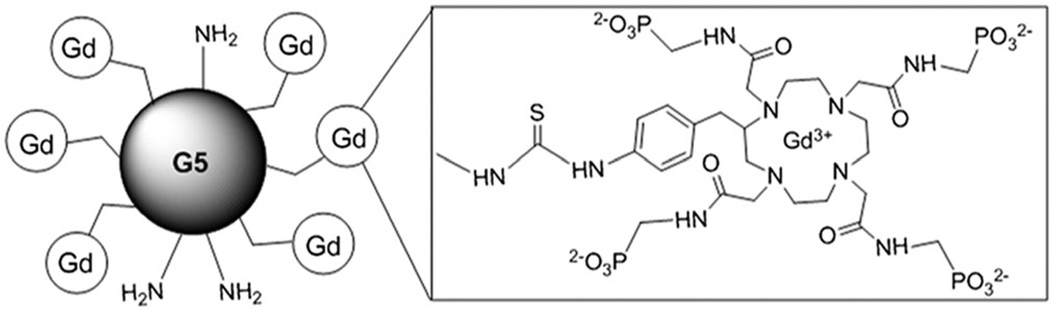
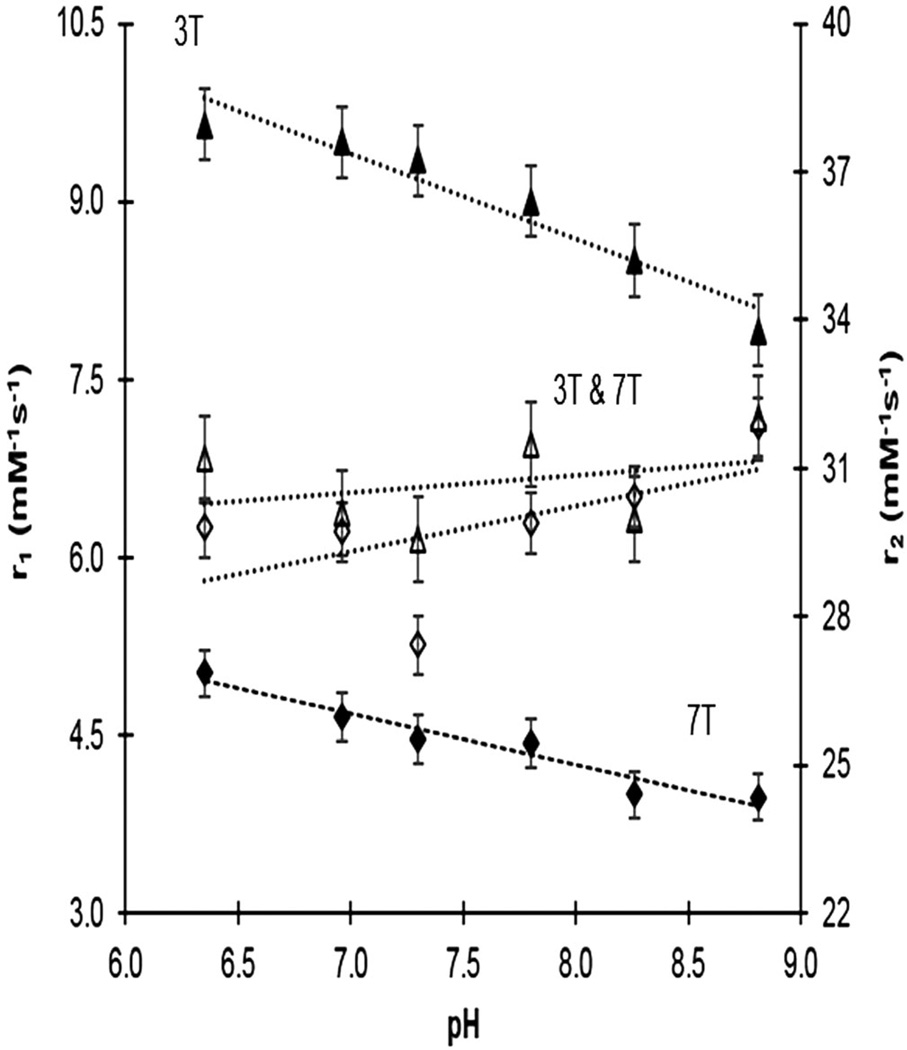
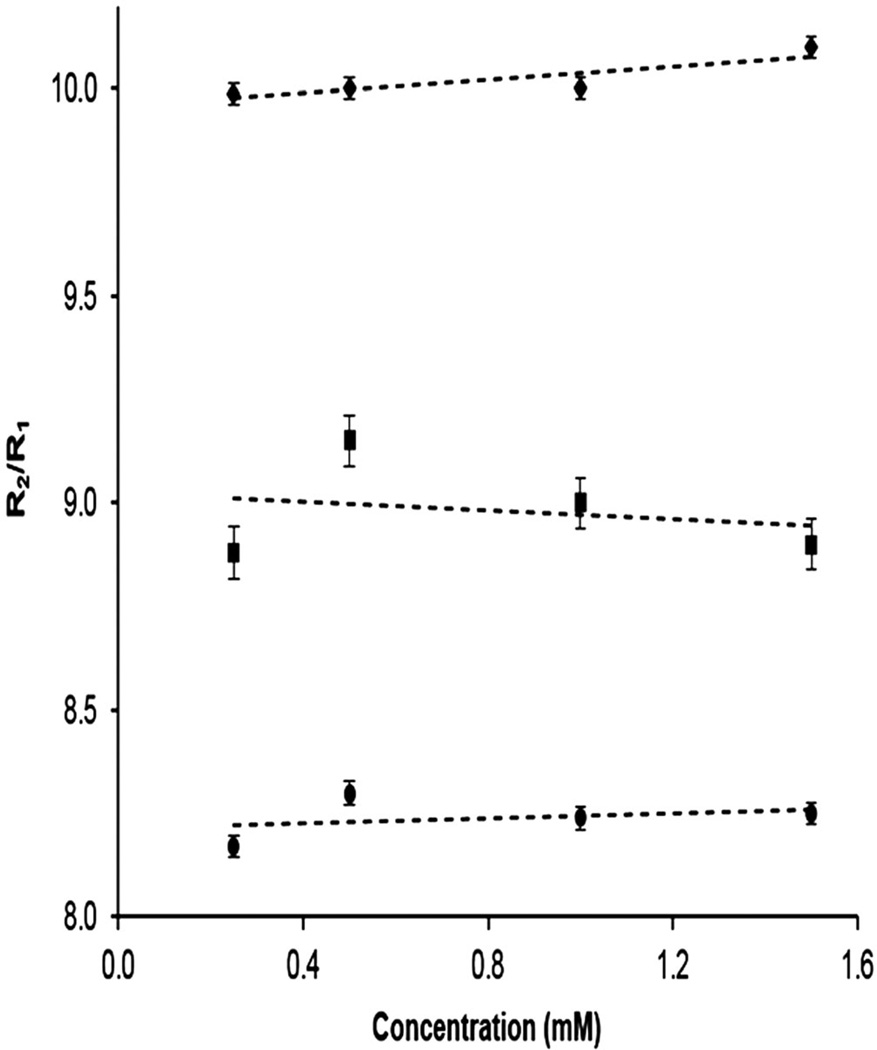
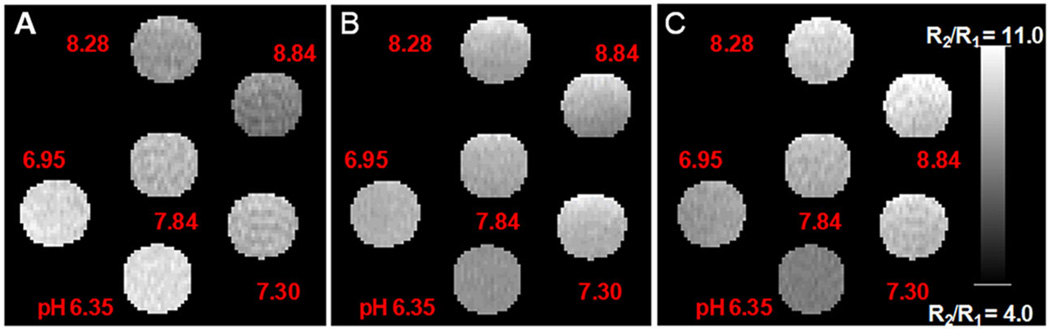
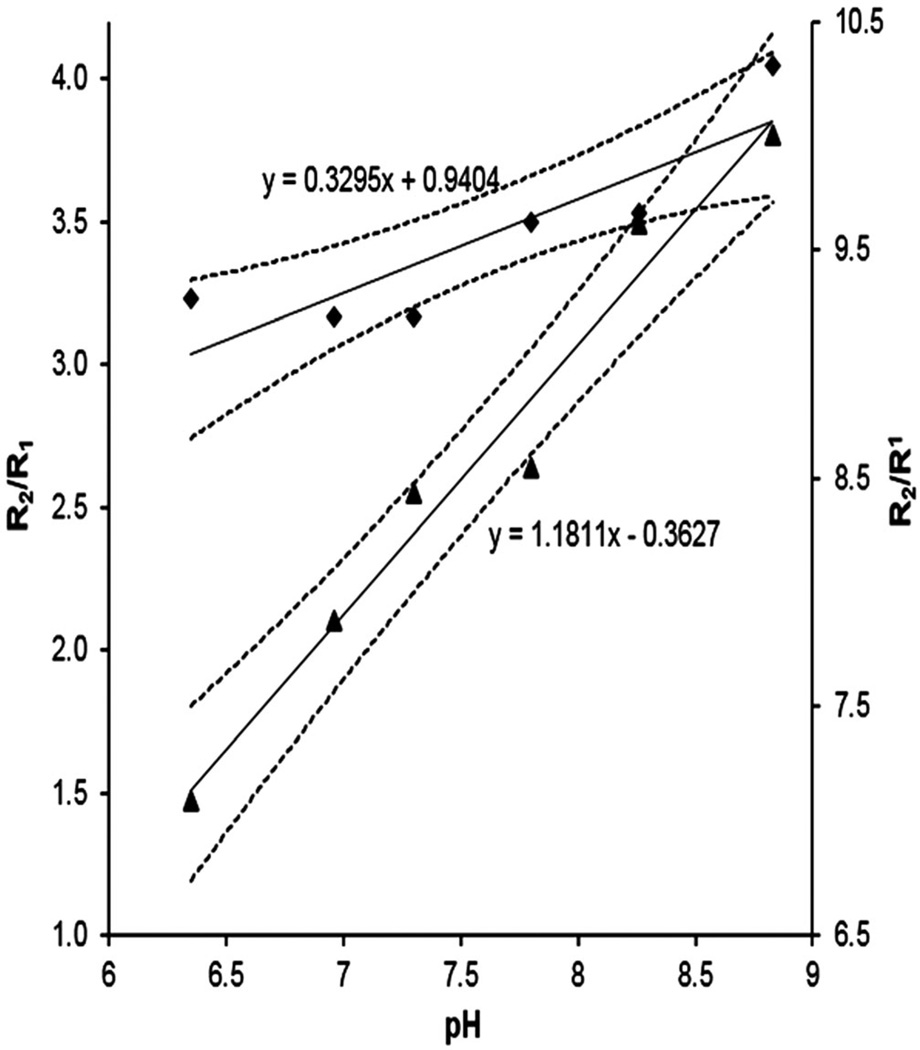
The measurement of extracellular pH (pHe ) has significant clinical value for pathological diagnoses and for monitoring the effects of pH-altering therapies. One of the major problems of measuring pHe with a relaxation-based MRI contrast agent is that the longitudinal relaxivity depends on both pH and the concentration of the agent, requiring the use of a second pH-unresponsive agent to measure the concentration. Here we tested the feasibility of measuring pH with a relaxation-based dendritic MRI contrast agent in a concentration-independent manner at clinically relevant field strengths. The transverse and longitudinal relaxation times in solutions of the contrast agent (GdDOTA-4AmP)44 -G5, a G5-PAMAM dendrimer-based MRI contrast agent in water, were measured at 3 T and 7 T magnetic field strengths as a function of pH. At 3 T, longitudinal relaxivity (r1 ) increased from 7.91 to 9.65 mM(-1) s(-1) (on a per Gd(3+) basis) on changing pH from 8.84 to 6.35. At 7 T, r1 relaxivity showed pH response, albeit at lower mean values; transverse relaxivity (r2 ) remained independent of pH and magnetic field strengths. The longitudinal relaxivity of (GdDOTA-4AmP)44 -G5 exhibited a strong and reversible pH dependence. The ratio of relaxation rates R2 /R1 also showed a linear relationship in a pH-responsive manner, and this pH response was independent of the absolute concentration of (GdDOTA-4AmP)44 -G5 agent. Importantly, the nanoprobe (GdDOTA-4AmP)44 -G5 shows pH response in the range commonly found in the microenvironment of solid tumors.
Keywords: dendritic agent; magnetic resonance imaging; noninvasive pH measurement; responsive agent.
Copyright © 2015 John Wiley & Sons, Ltd.
Figures
Similar articles
-
Rotational dynamics account for pH-dependent relaxivities of PAMAM dendrimeric, Gd-based potential MRI contrast agents.Chemistry. 2005 May 6;11(10):3064-76. doi: 10.1002/chem.200401326. Chemistry. 2005. PMID: 15776490
-
Synthesis and relaxivity studies of a tetranuclear gadolinium(III) complex of DO3A as a contrast-enhancing agent for MRI.Inorg Chem. 2005 Dec 12;44(25):9434-43. doi: 10.1021/ic050743r. Inorg Chem. 2005. PMID: 16323930
-
Water-soluble gadofullerenes: toward high-relaxivity, pH-responsive MRI contrast agents.J Am Chem Soc. 2005 Jan 19;127(2):799-805. doi: 10.1021/ja044688h. J Am Chem Soc. 2005. PMID: 15643906
-
Chemistry of paramagnetic and diamagnetic contrast agents for Magnetic Resonance Imaging and Spectroscopy pH responsive contrast agents.Eur J Radiol. 2008 Sep;67(3):453-8. doi: 10.1016/j.ejrad.2008.02.048. Epub 2008 May 1. Eur J Radiol. 2008. PMID: 18455343 Review.
-
Responsive MRI agents for sensing metabolism in vivo.Acc Chem Res. 2009 Jul 21;42(7):948-57. doi: 10.1021/ar800237f. Acc Chem Res. 2009. PMID: 19265438 Free PMC article. Review.
Cited by
-
pH-Dependent Cellular Internalization of Paramagnetic Nanoparticle.ACS Sens. 2016 Aug 26;1(8):975-978. doi: 10.1021/acssensors.6b00396. Epub 2016 Aug 10. ACS Sens. 2016. PMID: 28066811 Free PMC article.
-
Application of Dendrimer-based Nanoparticles in Glioma Imaging.J Nanomed Nanotechnol. 2017 Jun;8(3):444. doi: 10.4172/2157-7439.1000444. Epub 2017 Jun 14. J Nanomed Nanotechnol. 2017. PMID: 28856067 Free PMC article.
-
Targeting Triple Negative Breast Cancer with a Small-sized Paramagnetic Nanoparticle.J Nanomed Nanotechnol. 2016 Oct;7(5):404. doi: 10.4172/2157-7439.1000404. Epub 2016 Oct 28. J Nanomed Nanotechnol. 2016. PMID: 28018751 Free PMC article.
-
Gear Up for a pH Shift: A Responsive Iron(II) 2-Amino-6-picolyl-Appended Macrocyclic paraCEST Agent That Protonates at a Pendent Group.Inorg Chem. 2016 Nov 21;55(22):12001-12010. doi: 10.1021/acs.inorgchem.6b02159. Epub 2016 Nov 4. Inorg Chem. 2016. PMID: 27934305 Free PMC article.
-
Application of Dendrimers in Anticancer Diagnostics and Therapy.Molecules. 2022 May 18;27(10):3237. doi: 10.3390/molecules27103237. Molecules. 2022. PMID: 35630713 Free PMC article. Review.
References
-
- Delli Castelli D, Ferrauto G, Cutrin JC, Terreno E, Aime S. In vivo maps of extracellular pH in murine melanoma by CEST–MRI. Magn Reson Med. 2014;71(1):326–332. - PubMed
-
- Engin K, Leeper DB, Cater, Thistlethwaite AJ, Tupchong L, McFarlane JD. Extracellular pH distribution in human tumours. Int J Hypertherm. 1995;11(2):211–216. - PubMed
-
- Garcia-Martin ML, Herigault G, Remy C, Farion R, Ballesteros P, Coles JA, Cerdan S, Ziegler A. Mapping extracellular pH in rat brain gliomas in vivo by 1H magnetic resonance spectroscopic imaging: comparison with maps of metabolites. Cancer Res. 2001;61(17):6524–6531. - PubMed
-
- Gillies RJ, Liu Z, Bhujwalla Z. 31P-MRS measurements of extracellular pH of tumors using 3-aminopropylphosphonate. Am J Physiol. 1994;267(1 Pt 1):C195–C203. - PubMed
-
- van Sluis R, Bhujwalla ZM, Raghunand N, Ballesteros P, Alvarez J, Cerdan S, Galons JP, Gillies RJ. In vivo imaging of extracellular pH using 1H MRSI. Magn Reson Med. 1999;41(4):743–750. - PubMed
Publication types
MeSH terms
Substances
Grants and funding
LinkOut - more resources
Full Text Sources
Other Literature Sources
Medical