

Time-dependent deacclimation after cold acclimation in Arabidopsis thaliana accessions
- PMID: 26174584
- PMCID: PMC4648415
- DOI: 10.1038/srep12199
Time-dependent deacclimation after cold acclimation in Arabidopsis thaliana accessions
Abstract
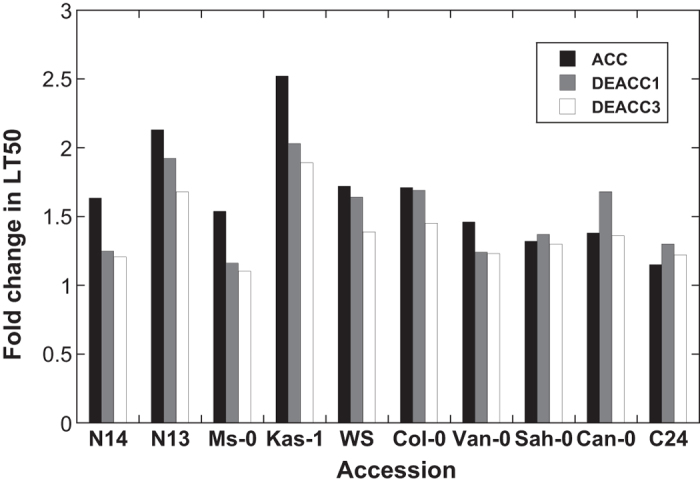
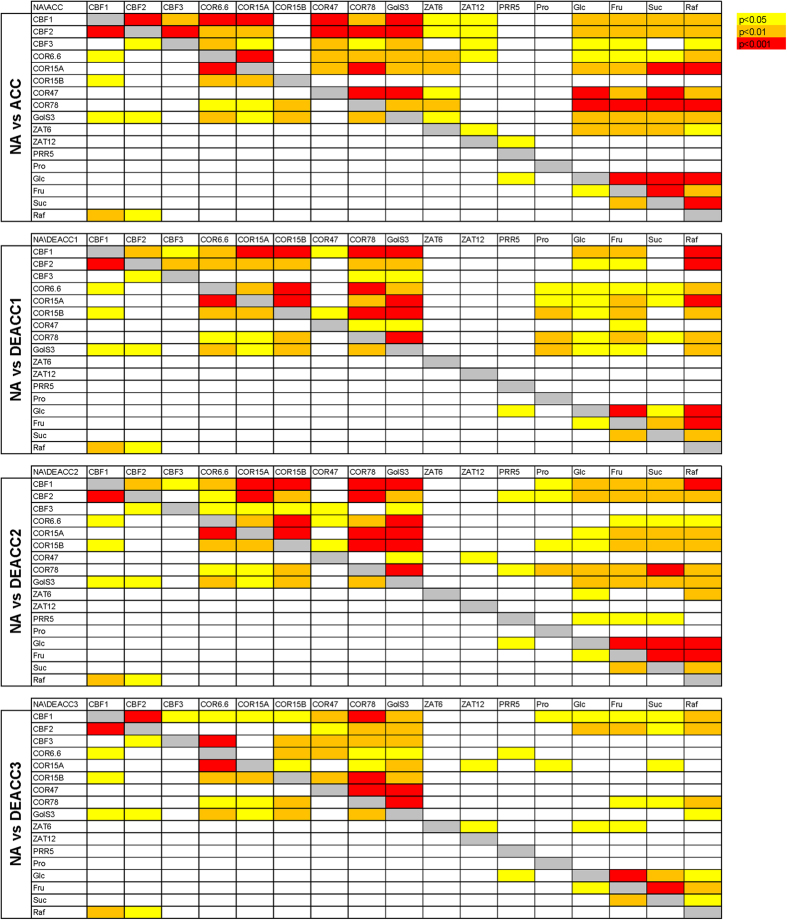
During low temperature exposure, Arabidopsis thaliana and many other plants from temperate climates increase in freezing tolerance in a process termed cold acclimation. However, the correct timing and rate of deacclimation, resulting in loss of freezing tolerance and initiation of growth is equally important for plant fitness and survival. While the molecular basis of cold acclimation has been investigated in detail, much less information is available about deacclimation. We have characterized the responses of 10 natural accessions of Arabidopsis thaliana that vary widely in their freezing tolerance, to deacclimation conditions. Sugar, proline and transcript levels declined sharply over three days in all accessions after transfer of cold acclimated plants to ambient temperatures, while freezing tolerance only declined in tolerant accessions. Correlations between freezing tolerance and the expression levels of COR genes and the content of glucose, fructose and sucrose, as well as many correlations among transcript and solute levels, that were highly significant in cold acclimated plants, were lost during deacclimation. Other correlations persisted, indicating that after three days of deacclimation, plant metabolism had not completely reverted back to the non-acclimated state. These data provide the basis for further molecular and genetic studies to unravel the regulation of deacclimation.
Figures


Similar articles
-
Rapid transcriptional and metabolic regulation of the deacclimation process in cold acclimated Arabidopsis thaliana.BMC Genomics. 2017 Sep 16;18(1):731. doi: 10.1186/s12864-017-4126-3. BMC Genomics. 2017. PMID: 28915789 Free PMC article.
-
Natural genetic variation in acclimation capacity at sub-zero temperatures after cold acclimation at 4 degrees C in different Arabidopsis thaliana accessions.Cryobiology. 2008 Oct;57(2):104-12. doi: 10.1016/j.cryobiol.2008.06.004. Epub 2008 Jun 21. Cryobiology. 2008. PMID: 18619434
-
Clinal variation in the non-acclimated and cold-acclimated freezing tolerance of Arabidopsis thaliana accessions.Plant Cell Environ. 2012 Oct;35(10):1860-78. doi: 10.1111/j.1365-3040.2012.02522.x. Epub 2012 May 10. Plant Cell Environ. 2012. PMID: 22512351
-
Deacclimation after cold acclimation-a crucial, but widely neglected part of plant winter survival.J Exp Bot. 2019 Sep 24;70(18):4595-4604. doi: 10.1093/jxb/erz229. J Exp Bot. 2019. PMID: 31087096 Free PMC article. Review.
-
Natural Variation in Freezing Tolerance and Cold Acclimation Response in Arabidopsis thaliana and Related Species.Adv Exp Med Biol. 2018;1081:81-98. doi: 10.1007/978-981-13-1244-1_5. Adv Exp Med Biol. 2018. PMID: 30288705 Review.
Cited by
-
Thermal plasticity of a freshwater cnidarian holobiont: detection of trans-generational effects in asexually reproducing hosts and symbionts.ISME J. 2019 Aug;13(8):2058-2067. doi: 10.1038/s41396-019-0413-0. Epub 2019 Apr 23. ISME J. 2019. PMID: 31015561 Free PMC article.
-
Natural Variation of Cold Deacclimation Correlates with Variation of Cold-Acclimation of the Plastid Antioxidant System in Arabidopsis thaliana Accessions.Front Plant Sci. 2016 Mar 17;7:305. doi: 10.3389/fpls.2016.00305. eCollection 2016. Front Plant Sci. 2016. PMID: 27014325 Free PMC article.
-
Genome-Wide Association Studies and Transcriptome Changes during Acclimation and Deacclimation in Divergent Brassica napus Varieties.Int J Mol Sci. 2020 Nov 30;21(23):9148. doi: 10.3390/ijms21239148. Int J Mol Sci. 2020. PMID: 33266351 Free PMC article.
-
Effect of Rhizobium Symbiosis on Low-Temperature Tolerance and Antioxidant Response in Alfalfa (Medicago sativa L.).Front Plant Sci. 2019 Apr 30;10:538. doi: 10.3389/fpls.2019.00538. eCollection 2019. Front Plant Sci. 2019. PMID: 31114600 Free PMC article.
-
Repeated colonization of alpine habitats by Arabidopsis arenosa viewed through freezing resistance and ice management strategies.Plant Biol (Stuttg). 2022 Oct;24(6):939-949. doi: 10.1111/plb.13454. Epub 2022 Aug 11. Plant Biol (Stuttg). 2022. PMID: 35833328 Free PMC article.
References
-
- Guy C. L., Kaplan F., Kopka J., Selbig J. & Hincha D. K. Metabolomics of temperature stress. Physiol. Plant. 132, 220–235 (2008). - PubMed
-
- Hincha D. K., Espinoza C. & Zuther E. in Improving Crop Resistance to Abiotic Stress Vol. 1 (eds Tuteja N., Gill S. S., Toburcio A. F. & Tuteja R. ) 255–287 (Wiley-Blackwell, 2012).
-
- Thomashow M. F. Plant cold acclimation: freezing tolerance genes and regulatory mechanisms. Annu. Rev. Plant Physiol. Plant Mol. Biol. 50, 571–599 (1999). - PubMed
-
- Xin Z. & Browse J. Cold comfort farm: the acclimation of plants to freezing temperatures. Plant Cell Environ. 23, 893–902 (2000).
Publication types
MeSH terms
Substances
LinkOut - more resources
Full Text Sources
Other Literature Sources
