

Recommendations for real-time speech MRI
- PMID: 26174802
- PMCID: PMC5079859
- DOI: 10.1002/jmri.24997
Recommendations for real-time speech MRI
Abstract
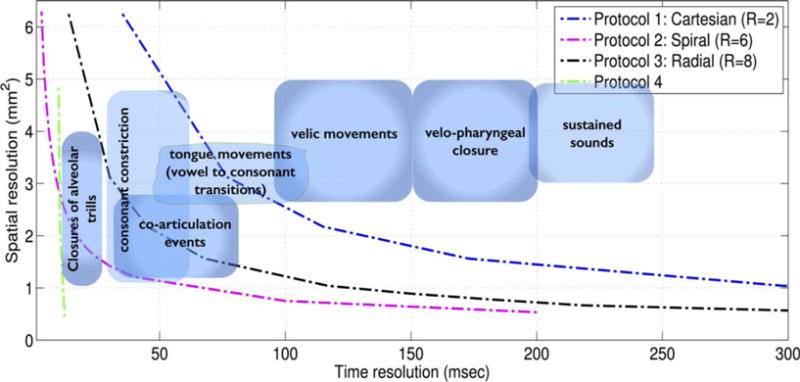
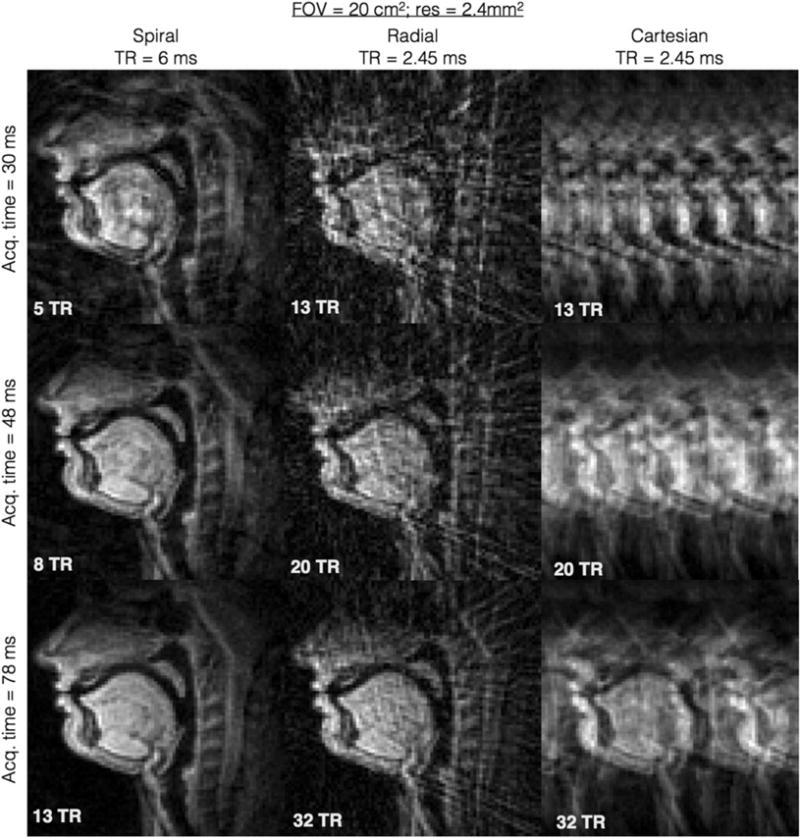
Real-time magnetic resonance imaging (RT-MRI) is being increasingly used for speech and vocal production research studies. Several imaging protocols have emerged based on advances in RT-MRI acquisition, reconstruction, and audio-processing methods. This review summarizes the state-of-the-art, discusses technical considerations, and provides specific guidance for new groups entering this field. We provide recommendations for performing RT-MRI of the upper airway. This is a consensus statement stemming from the ISMRM-endorsed Speech MRI summit held in Los Angeles, February 2014. A major unmet need identified at the summit was the need for consensus on protocols that can be easily adapted by researchers equipped with conventional MRI systems. To this end, we provide a discussion of tradeoffs in RT-MRI in terms of acquisition requirements, a priori assumptions, artifacts, computational load, and performance for different speech tasks. We provide four recommended protocols and identify appropriate acquisition and reconstruction tools. We list pointers to open-source software that facilitate implementation. We conclude by discussing current open challenges in the methodological aspects of RT-MRI of speech.
Keywords: rapid imaging; real time MRI; recommendations; speech imaging.
© 2015 Wiley Periodicals, Inc.
Figures

Similar articles
-
Feasibility of through-time spiral generalized autocalibrating partial parallel acquisition for low latency accelerated real-time MRI of speech.Magn Reson Med. 2017 Dec;78(6):2275-2282. doi: 10.1002/mrm.26611. Epub 2017 Feb 10. Magn Reson Med. 2017. PMID: 28185301 Free PMC article.
-
One-second MRI of a three-dimensional vocal tract to measure dynamic articulator modifications.J Magn Reson Imaging. 2017 Jul;46(1):94-101. doi: 10.1002/jmri.25561. Epub 2016 Dec 9. J Magn Reson Imaging. 2017. PMID: 27943448
-
A multispeaker dataset of raw and reconstructed speech production real-time MRI video and 3D volumetric images.Sci Data. 2021 Jul 20;8(1):187. doi: 10.1038/s41597-021-00976-x. Sci Data. 2021. PMID: 34285240 Free PMC article.
-
Recommended Protocols for Instrumental Assessment of Voice: American Speech-Language-Hearing Association Expert Panel to Develop a Protocol for Instrumental Assessment of Vocal Function.Am J Speech Lang Pathol. 2018 Aug 6;27(3):887-905. doi: 10.1044/2018_AJSLP-17-0009. Am J Speech Lang Pathol. 2018. PMID: 29955816 Review.
-
[Functional MRI of speech].Radiologe. 2013 Jul;53(7):592-7. doi: 10.1007/s00117-013-2480-y. Radiologe. 2013. PMID: 23818013 Review. German.
Cited by
-
Realistic Dynamic Numerical Phantom for MRI of the Upper Vocal Tract.J Imaging. 2020 Aug 27;6(9):86. doi: 10.3390/jimaging6090086. J Imaging. 2020. PMID: 34460743 Free PMC article.
-
Real-Time Magnetic Resonance Imaging.J Magn Reson Imaging. 2022 Jan;55(1):81-99. doi: 10.1002/jmri.27411. Epub 2020 Dec 9. J Magn Reson Imaging. 2022. PMID: 33295674 Free PMC article. Review.
-
Sub-millisecond 2D MRI of the vocal fold oscillation using single-point imaging with rapid encoding.MAGMA. 2022 Apr;35(2):301-310. doi: 10.1007/s10334-021-00959-4. Epub 2021 Sep 20. MAGMA. 2022. PMID: 34542771 Free PMC article.
-
Feasibility of through-time spiral generalized autocalibrating partial parallel acquisition for low latency accelerated real-time MRI of speech.Magn Reson Med. 2017 Dec;78(6):2275-2282. doi: 10.1002/mrm.26611. Epub 2017 Feb 10. Magn Reson Med. 2017. PMID: 28185301 Free PMC article.
-
Automatic Multiple Articulator Segmentation in Dynamic Speech MRI Using a Protocol Adaptive Stacked Transfer Learning U-NET Model.Bioengineering (Basel). 2023 May 22;10(5):623. doi: 10.3390/bioengineering10050623. Bioengineering (Basel). 2023. PMID: 37237693 Free PMC article.
References
-
- Scott AD, Wylezinska M, Birch MJ, Miquel ME. Speech MRI: morphology and function. Phys Med. 2014;30:604–618. - PubMed
-
- Bresch E, Kim Y-C, Nayak K, Byrd D, Narayanan S. Seeing speech: capturing vocal tract shaping using real-time magnetic resonance imaging. IEEE Signal Proc Mag. 2008;25:123–132.
-
- Demolin D, Hassid S, Metens T, Soquet A. Real-time MRI and articulatory coordination in speech. Comptes Rendus Biol. 2002;325:547–556. - PubMed
-
- Honda K, Takemoto H, Kitamura T, Fujita S, Takano S. Exploring human speech production mechanisms by MRI. IEICE Trans Inform Syst. 2004;87:1050–1058.
-
- NessAiver MS, Stone M, Parthasarathy V, Kahana Y, Paritsky A. Recording high quality speech during tagged cine-MRI studies using a fiber optic microphone. J Magn Reson Imaging. 2006;23:92–97. - PubMed
Publication types
MeSH terms
Grants and funding
LinkOut - more resources
Full Text Sources
Other Literature Sources
Medical
