

Time- and compartment-resolved proteome profiling of the extracellular niche in lung injury and repair
- PMID: 26174933
- PMCID: PMC4547847
- DOI: 10.15252/msb.20156123
Time- and compartment-resolved proteome profiling of the extracellular niche in lung injury and repair
Abstract
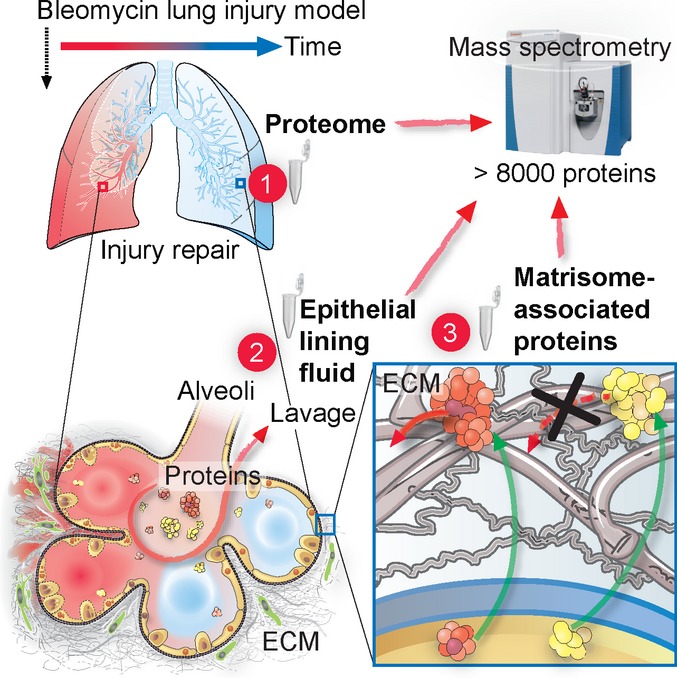
The extracellular matrix (ECM) is a key regulator of tissue morphogenesis and repair. However, its composition and architecture are not well characterized. Here, we monitor remodeling of the extracellular niche in tissue repair in the bleomycin-induced lung injury mouse model. Mass spectrometry quantified 8,366 proteins from total tissue and bronchoalveolar lavage fluid (BALF) over the course of 8 weeks, surveying tissue composition from the onset of inflammation and fibrosis to its full recovery. Combined analysis of proteome, secretome, and transcriptome highlighted post-transcriptional events during tissue fibrogenesis and defined the composition of airway epithelial lining fluid. To comprehensively characterize the ECM, we developed a quantitative detergent solubility profiling (QDSP) method, which identified Emilin-2 and collagen-XXVIII as novel constituents of the provisional repair matrix. QDSP revealed which secreted proteins interact with the ECM, and showed drastically altered association of morphogens to the insoluble matrix upon injury. Thus, our proteomic systems biology study assigns proteins to tissue compartments and uncovers their dynamic regulation upon lung injury and repair, potentially contributing to the development of anti-fibrotic strategies.
Keywords: extracellular matrix; fibrosis; proteomics; regeneration; secretome.
© 2015 The Authors. Published under the terms of the CC BY 4.0 license.
Figures
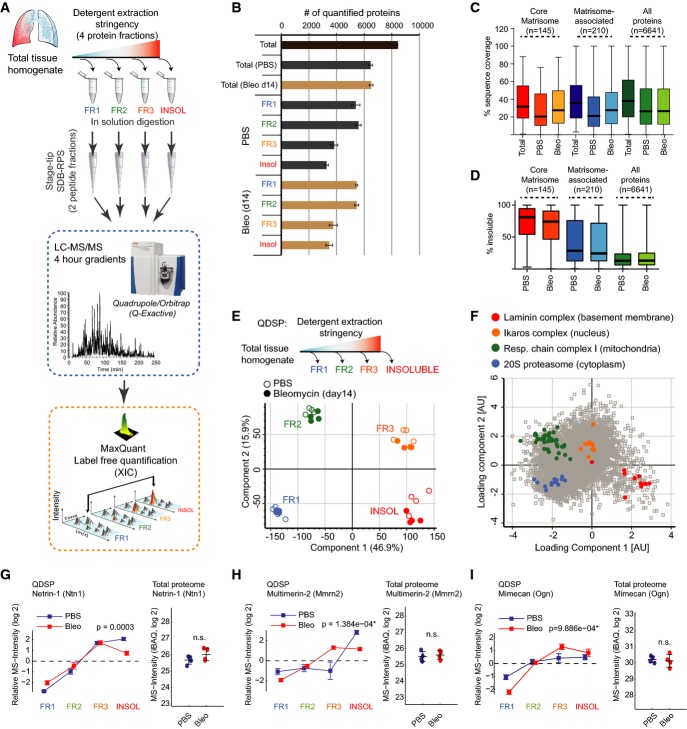
A Experimental workflow.
B Number of quantified proteins in the indicated protein fractions and experimental conditions. The mean and standard deviation are shown (PBS, n = 4; Bleo d14, n = 4).
C, D The box and whisker plots depict the distribution of protein sequence coverage (coverage of possible tryptic peptides per protein in %) (C) or the percentage of MS intensity in the most insoluble protein fraction (D) for the indicated matrisome categories (Naba et al, 2012a) and experimental conditions.
E Principal component analysis (PCA) separates protein fractions derived from sequential detergent extraction. The first two components of data variability of 6,641 proteins, from four replicates of PBS control (open circles) and four replicates of bleomycin-treated lungs at day 14 after injury (closed circles), are shown.
F The scatter plot depicts the protein feature loadings of component 1 and component 2 of the PCA in (E) for the four indicated multiprotein complexes.
G–I Normalized QDSP MS intensity profiles (left panel) and total protein abundance (right panel) are shown for the indicated example proteins Netrin-1 (G), Multimerin-2 (H), and Mimecan (I). Error bars depict the standard error of the mean, and the indicated P-values are derived from an ANOVA test (all fractions: PBS, n = 4; Bleo d14, n = 4).
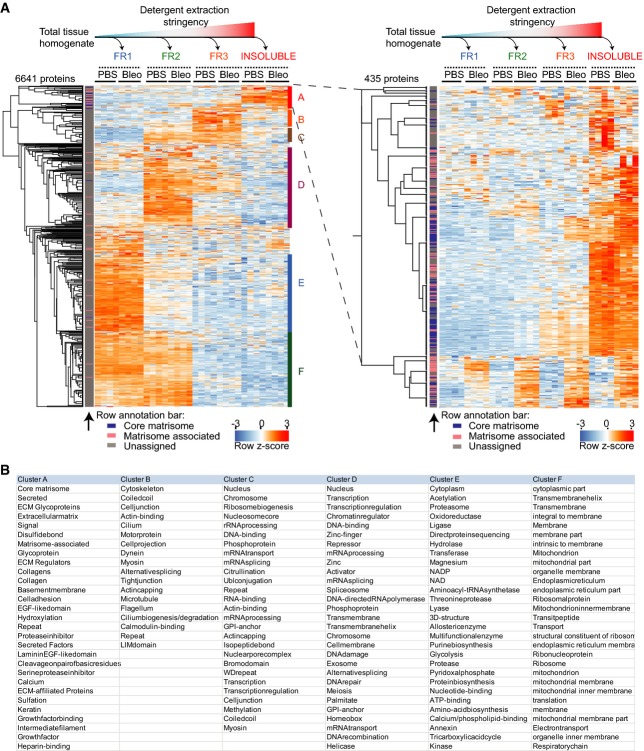
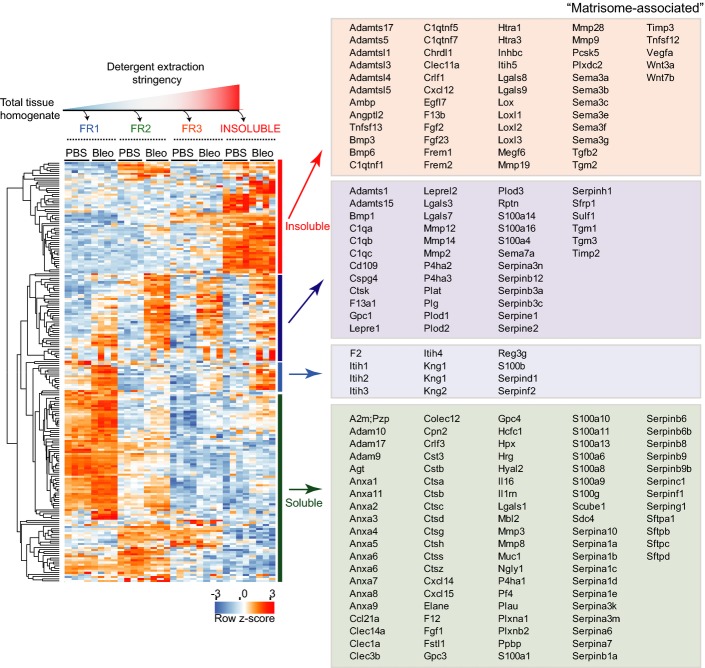
Non-supervised hierarchical clustering of z-scored MS intensities from the indicated protein fractions and conditions (PBS, n = 4; Bleo day 14, n = 4). The left panel depicts all 6,641 proteins, while the right panel shows a zoom in on the 435 most detergent-insoluble proteins in cluster A. The row annotation bar assigns proteins into the indicated matrisome categories.
The table shows UniProt keywords that were significantly enriched (FDR < 2%) in the indicated protein clusters of the clustering analysis in (A).
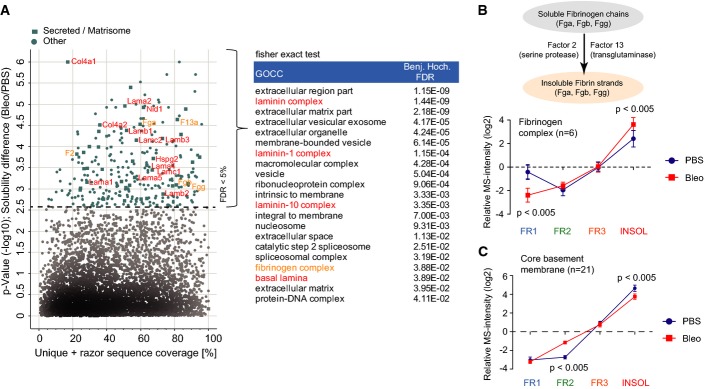
A Proteins (n = 283) with significantly altered normalized MS intensity profiles (Benjamini–Hochberg FDR < 0.05) between PBS controls (n = 4) and bleomycin-treated (day 14; n = 4) samples are highlighted in a scatter plot depicting the percent coverage of identified tryptic peptides across the protein sequence and the P-value of the solubility difference. Significantly enriched GOCC terms (Fisher’s exact test, FDR < 2%) in the 283 protein group with altered QDSP profiles are shown in the right panel.
B, C The mean normalized QDSP MS intensity profiles of the fibrinogen complex (B; n = 6) and all core basement membrane proteins (C; n = 21) from PBS controls (n = 4) in blue and bleomycin (day 14; n = 4) in red are shown. The mean is shown and the error bars depict the standard error of the mean. The indicated P-values are derived from a t-test.
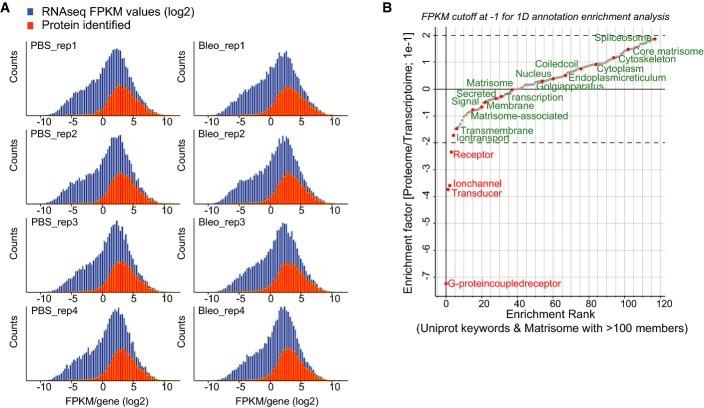
The histogram shows the distribution of the FPKM values from the RNA-seq experiment in log2 space (blue bars). The orange bars show the distribution of FPKM values for a total of 6,672 genes for which we also quantified the corresponding protein.
Relative enrichment (coverage) of the indicated gene categories (UniProt keywords) in the proteome and transcriptome was calculated using the 1D annotation enrichment algorithm embedded in the Perseus software suite. The enrichment is normalized to a score spanning from −1 to 1 as indicated. Gene categories are ranked according to their relative enrichment in the transcriptome or proteome (PBS, n = 4; Bleo day 14, n = 4).
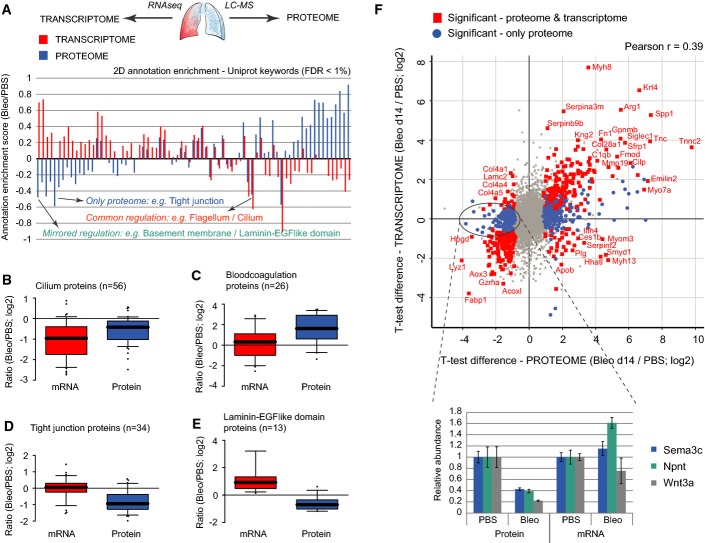
A The bar graph shows the normalized annotation enrichment score (−1 min to +1 max) of UniProt keyword annotations that were significantly regulated (FDR < 1%) in the proteome (blue bars) and/or the transcriptome (red bars) dataset.
B–E The box and whisker plots depict the distribution of median log2 ratios from the transcriptome experiment (red boxes) and the proteome experiment (blue boxes) for the indicated UniProt keyword gene categories.
F The scatter plot shows the median log2 ratios of MS intensities and FPKM values for individual genes (n = 6,672). Genes that were significantly regulated in both RNA and protein are highlighted in red (FDR < 5%). Three example proteins that were only significantly regulated in the proteome but not in the transcriptome are shown in the bar graph inset. Error bars depict the standard error of the mean (PBS, n = 4; Bleo day 14, n = 4).
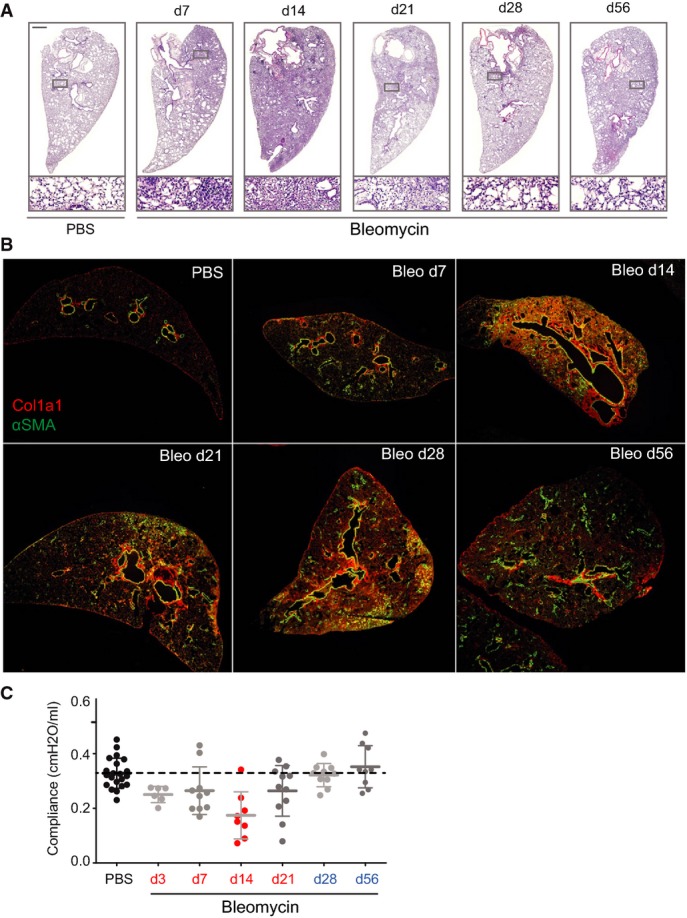
Representative tissue sections of the indicated experimental conditions and time points were analyzed using hematoxylin and eosin stain (H&E).
Tissue sections of the indicated experimental conditions and time points were stained for α-smooth muscle actin (α-SMA in green) and collagen type I (Col1a1 in red).
Lung compliance was measured in the indicated experimental conditions and time points using the forced oscillation technique from FlexiVent systems (Scireq, Montreal, Canada). The values for mean and standard deviation are shown.
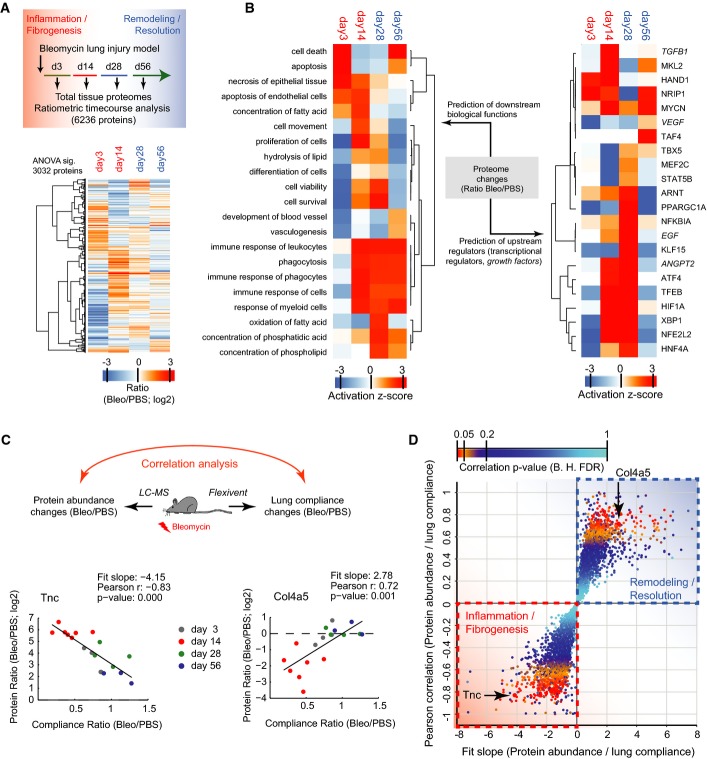
Schematic of experimental design and hierarchical clustering analysis of 3,032 MS intensity ratios (Bleo/PBS; log2) that were significant in ANOVA (day 3, n = 3; day 14, n = 7; day 28, n = 4; day 56, n = 3).
Hierarchical clustering of the activity score of downstream biological functions (left panel) and the upstream transcriptional regulators and growth factors (right panel) for the indicated time points after injury as determined by Ingenuity pathway analysis using the 3,032 significant protein ratios.
Correlation of protein abundance changes with lung compliance changes in individual mouse lungs at the indicated time points after bleomycin instillation into the airways. The ECM glycoprotein Tnc serves as an example for proteins that have a negative slope of the correlation fit. The basement membrane protein Col4a5 serves as an example for proteins that have a positive slope of the correlation fit.
The scatter plot depicts the Pearson correlation coefficient and the correlation fit slope of all 6,236 proteins that were used in the ratiometric analysis of protein abundance versus lung compliance. The statistical significance of the correlation coefficient is color-coded as indicated.
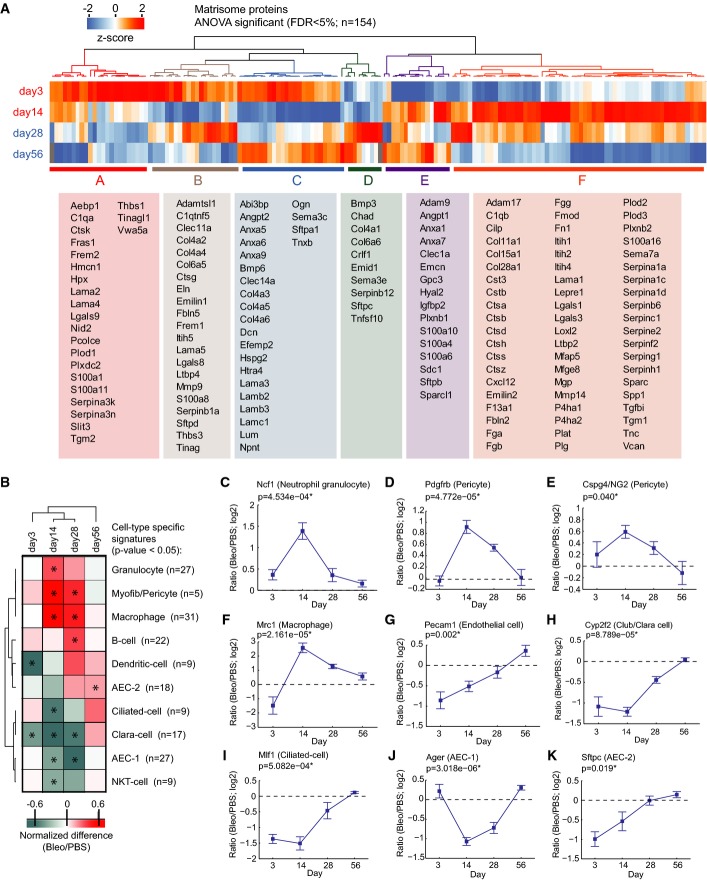
A The z-scored MS intensity ratios of the indicated 154 matrisome proteins (ANOVA FDR < 0.05) were grouped by correlation using unsupervised hierarchical clustering. The table shows the gene names of the proteins associated with the indicated clusters.
B The normalized enrichment score (−1 to +1; 1D annotation enrichment in the Perseus software) of the indicated cell-type-specific protein signatures and time points after injury was grouped based on non-supervised hierarchical clustering. Conditions with significant enrichment or depletion of a cell-type-specific signature are marked with an asterisk (P-value < 0.05).
C–K The line plots show dynamic changes in relative abundance (log2 ratio bleomycin/PBS) of the indicated examples of cell-type-specific proteins over the tissue repair progression timeline. The mean and standard error of the mean and a P-value from ANOVA are shown (day 3, n = 3; day 14, n = 7; day 28, n = 4; day 56, n = 3).
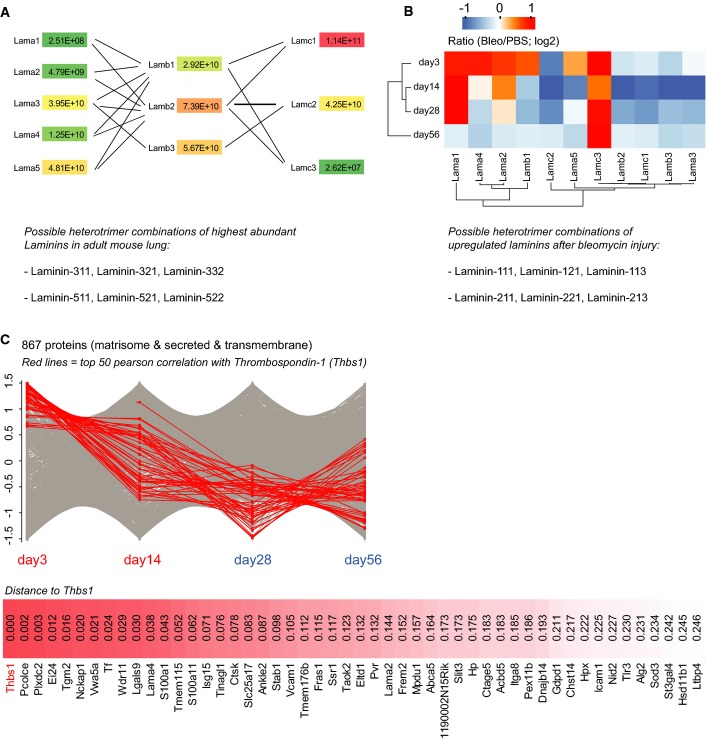
The median MS intensity of all laminin chains was normalized for the theoretical number of tryptic peptides (iBAQ), yielding a relative stoichiometry of laminin chains, which is shown in the network graph for healthy control lungs (PBS,n = 16). The lower panel depicts the possible laminin heterotrimer combinations of the highly abundant α3- and α5-laminins, based on previous literature.
The median z-scored MS intensity ratios of the indicated laminin chains were grouped by correlation using unsupervised hierarchical clustering (day 3, n = 3; day 14, n = 7; day 28, n = 4; day 56, n = 3). Possible heterotrimer combinations of the upregulated α1- and α2-laminins are shown in the lower panel.
The median z-scored MS intensity ratios of 867 extracellular proteins were grouped by correlation analysis of their temporal profiles. The 50 proteins with highest correlation to thrombospondin-1 (Thbs1) are shown (day 3, n = 3; day 14, n = 7; day 28, n = 4; day 56, n = 3).
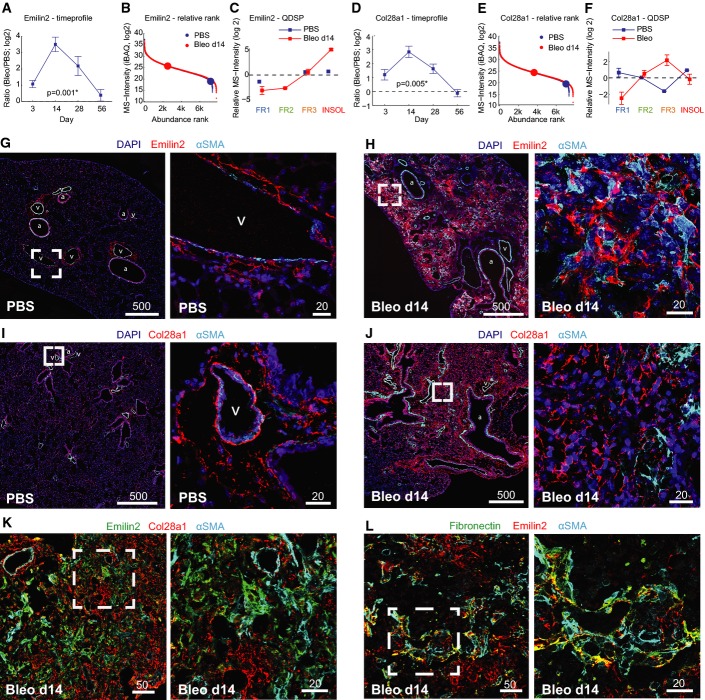
A–F Quantitative proteome data depict protein abundance changes over time relative to healthy control mice (A, D), the abundance rank relative to all other quantified proteins (b, e), and the QDSP profiles indicative for the detergent solubility (C, F). The mean and standard error of the mean are shown (day 3, n = 3; day 14, n = 7; day 28, n = 4; day 56, n = 3).
G–L Lung tissue sections from control mice (PBS) and bleomycin-treated mice 2 weeks after injury (Bleo d14) were stained as indicated. Scale bars are in μm. Vessels are labeled with (v) and airways with (a).
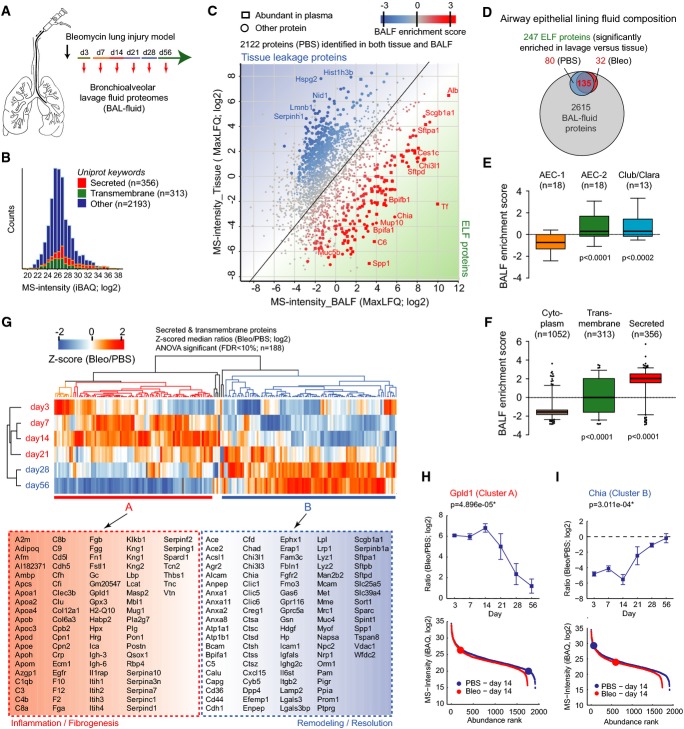
A Experimental design.
B The histogram depicts MS intensity distributions of the indicated categories.
C The scatter plot shows the relative enrichment of proteins in either tissue or bronchoalveolar lavage fluid proteome. The enrichment score is color-coded as indicated, and proteins that are highly abundant in plasma are shown as squares.
D The Venn diagram depicts relative proportions of the number of proteins in the indicated categories and experimental conditions.
E, F The box plots depict the distribution of BALF enrichment scores in the indicated gene categories.
G The z-scored MS intensity ratios of the 189 secreted and transmembrane proteins that were significantly regulated (Benjamini–Hochberg FDR < 0.05) were grouped by correlation using unsupervised hierarchical clustering.
H, I Protein abundance changes over time of the indicated example proteins are shown in the upper panels. The mean log2 MS intensity ratio of bleomycin-treated to the PBS controls with the standard error of the mean and the P-value of ANOVA are shown. The lower panels depict the protein abundance rank relative to the complete BALF proteomes. The error bars depict the standard error of the mean.
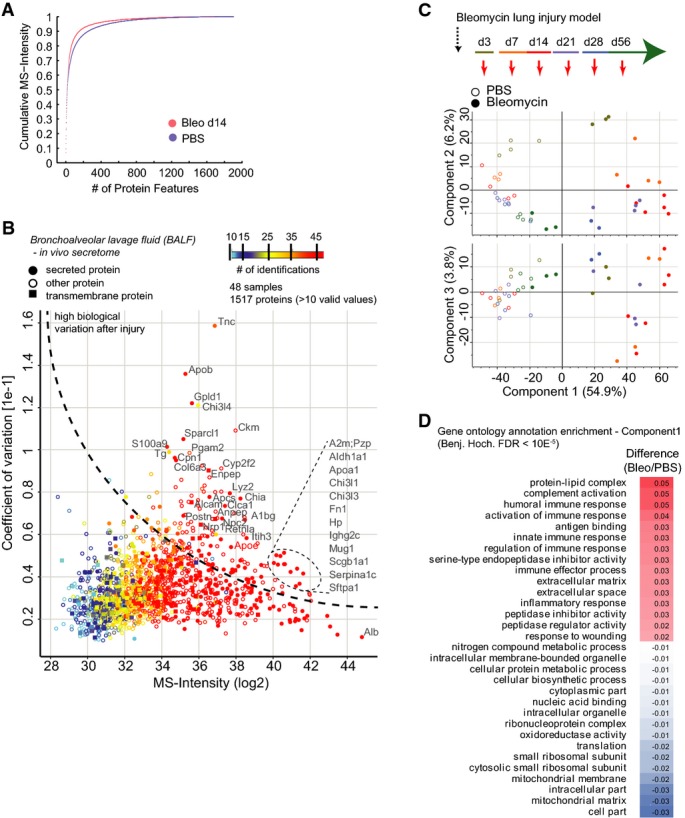
The mean cumulative MS intensity of the indicated conditions demonstrates differences in dynamic range of protein copy numbers (PBS, n = 24; Bleo day 14, n = 7). The lower number after bleomycin treatment was likely due to the leakage of plasma through the endothelial barrier upon injury, which makes MS analysis more challenging.
The scatter plot depicts the median MS intensity versus the coefficient of variation across the injury time course and all replicates, which highlights proteins with high biological variation upon injury. The number of protein identifications across replicates and time points (n = 48) is color-coded, and secreted and transmembrane proteins are marked with the indicated symbols.
Principal component analysis of BALF proteomes from the indicated experimental conditions and time points separates experimental groups.
The table shows significantly regulated gene ontology terms (FDR < 2%) that were found to be enriched in either the negative (PBS) or positive (Bleo) data dimension of component 1 in the principal component analysis shown in (C).
References
-
- Altelaar AF, Heck AJ. Trends in ultrasensitive proteomics. Curr Opin Chem Biol. 2012;16:206–213. - PubMed
-
- Bakowska J, Adamson IY. Collagenase and gelatinase activities in bronchoalveolar lavage fluids during bleomycin-induced lung injury. J Pathol. 1998;185:319–323. - PubMed
-
- Barallobre-Barreiro J, Didangelos A, Schoendube FA, Drozdov I, Yin X, Fernandez-Caggiano M, Willeit P, Puntmann VO, Aldama-Lopez G, Shah AM, Domenech N, Mayr M. Proteomics analysis of cardiac extracellular matrix remodeling in a porcine model of ischemia/reperfusion injury. Circulation. 2012;125:789–802. - PubMed
Publication types
MeSH terms
Substances
LinkOut - more resources
Full Text Sources
Other Literature Sources
