

Ebolavirus comparative genomics
- PMID: 26175035
- PMCID: PMC4551310
- DOI: 10.1093/femsre/fuv031
Ebolavirus comparative genomics
Abstract
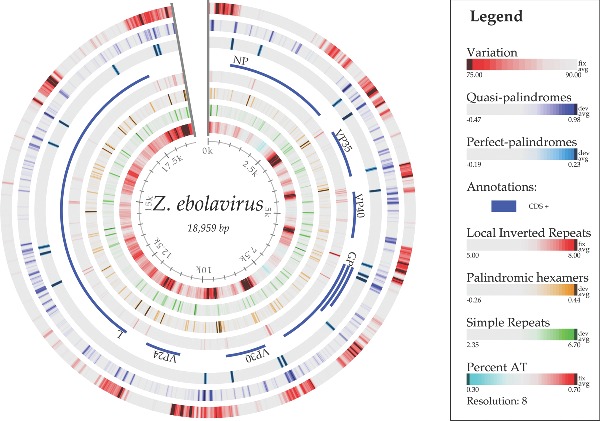
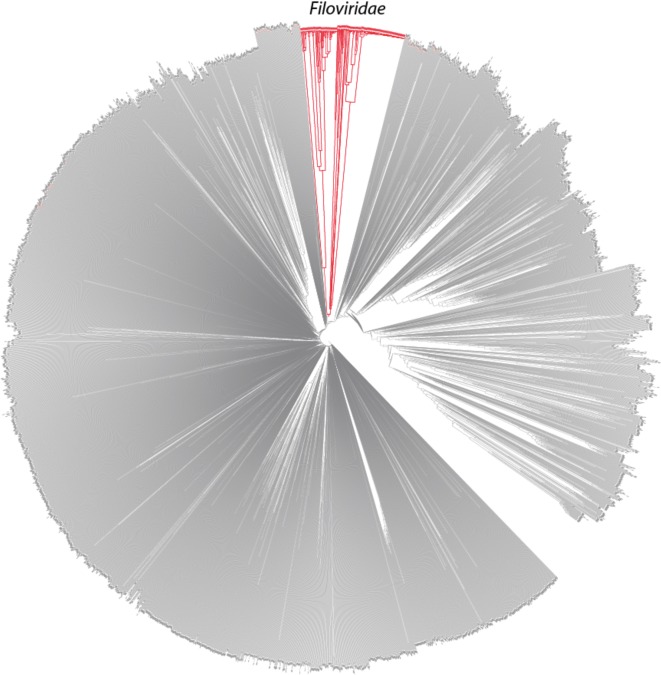
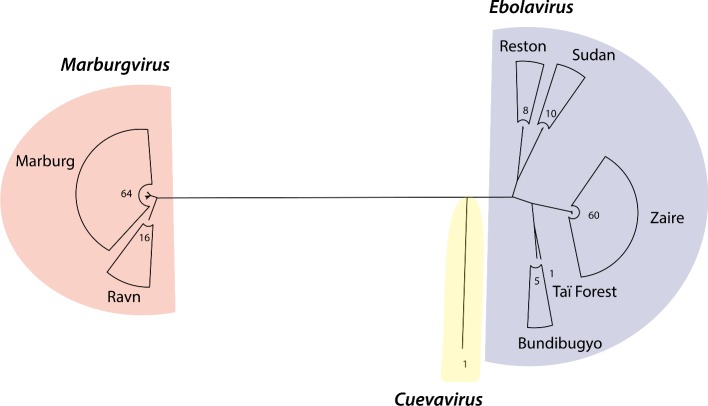
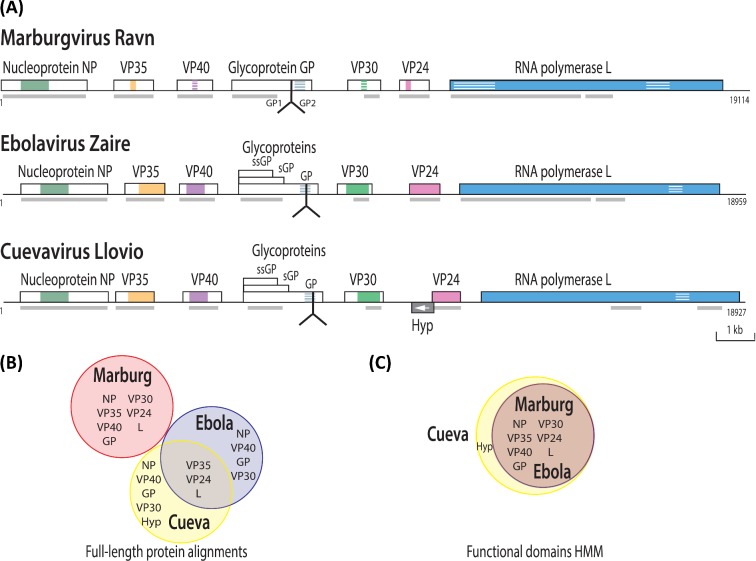
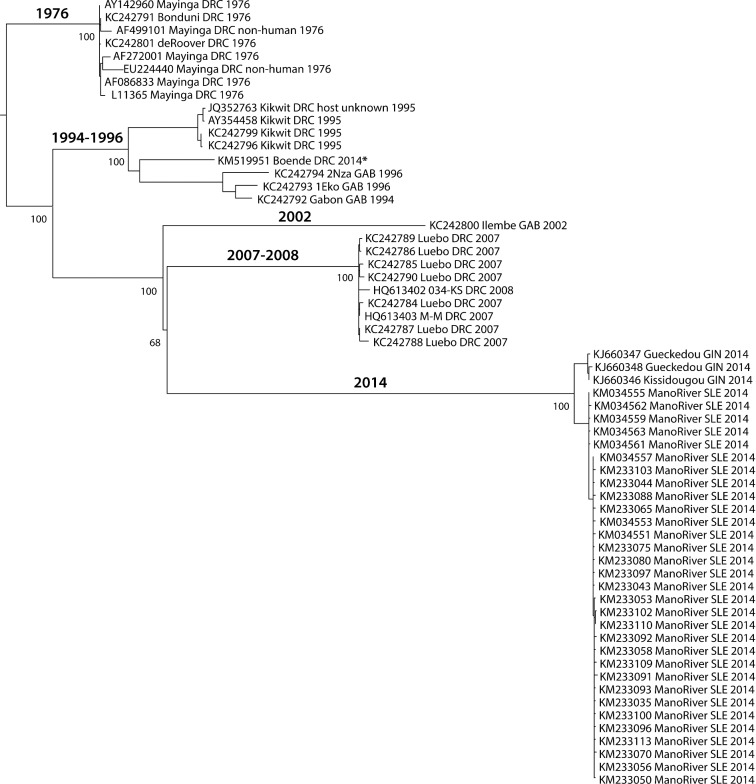
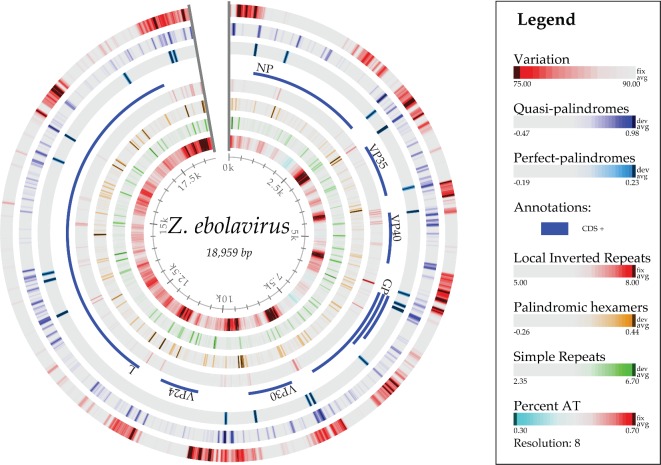
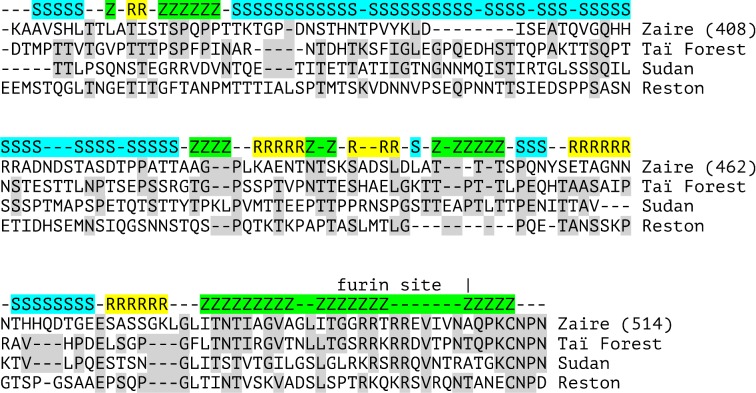
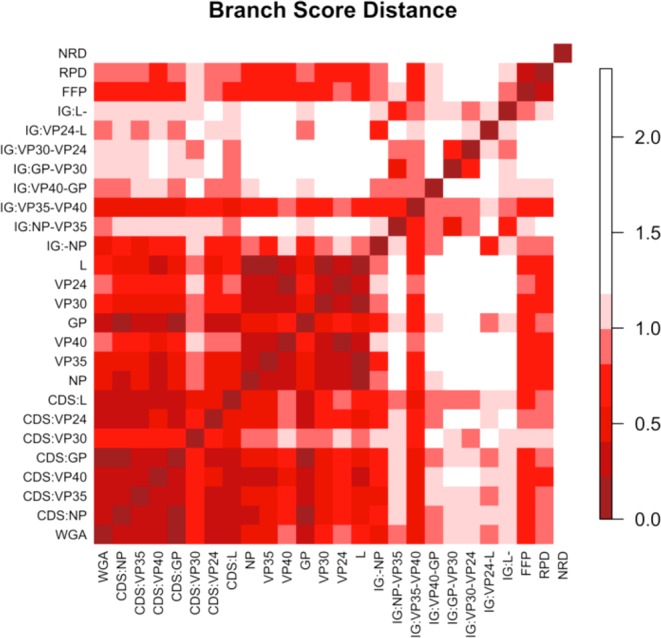
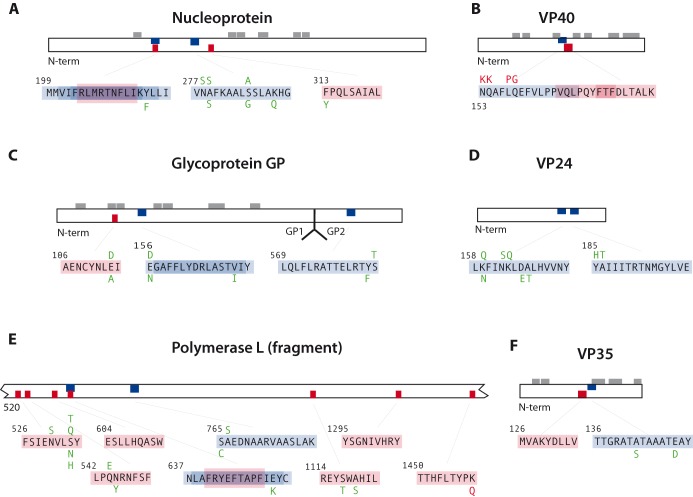
The 2014 Ebola outbreak in West Africa is the largest documented for this virus. To examine the dynamics of this genome, we compare more than 100 currently available ebolavirus genomes to each other and to other viral genomes. Based on oligomer frequency analysis, the family Filoviridae forms a distinct group from all other sequenced viral genomes. All filovirus genomes sequenced to date encode proteins with similar functions and gene order, although there is considerable divergence in sequences between the three genera Ebolavirus, Cuevavirus and Marburgvirus within the family Filoviridae. Whereas all ebolavirus genomes are quite similar (multiple sequences of the same strain are often identical), variation is most common in the intergenic regions and within specific areas of the genes encoding the glycoprotein (GP), nucleoprotein (NP) and polymerase (L). We predict regions that could contain epitope-binding sites, which might be good vaccine targets. This information, combined with glycosylation sites and experimentally determined epitopes, can identify the most promising regions for the development of therapeutic strategies.This manuscript has been authored by UT-Battelle, LLC under Contract No. DE-AC05-00OR22725 with the U.S. Department of Energy. The United States Government retains and the publisher, by accepting the article for publication, acknowledges that the United States Government retains a non-exclusive, paid-up, irrevocable, world-wide license to publish or reproduce the published form of this manuscript, or allow others to do so, for United States Government purposes. The Department of Energy will provide public access to these results of federally sponsored research in accordance with the DOE Public Access Plan (http://energy.gov/downloads/doe-public-access-plan).
Keywords: Ebola; Ebola virus disease (EVD); Filovirus; comparative genomics; epitope prediction; viral genomes.
© FEMS 2015.
Figures

Similar articles
-
Reporter genes confer new-to-nature ornamental traits in plants.Hortic Res. 2022 Apr 11;9:uhac077. doi: 10.1093/hr/uhac077. eCollection 2022. Hortic Res. 2022. PMID: 35669710 Free PMC article.
-
A database of synthetic inelastic neutron scattering spectra from molecules and crystals.Sci Data. 2023 Jan 24;10(1):54. doi: 10.1038/s41597-022-01926-x. Sci Data. 2023. PMID: 36693896 Free PMC article.
-
Implementation of Objective PASC-Derived Taxon Demarcation Criteria for Official Classification of Filoviruses.Viruses. 2017 May 11;9(5):106. doi: 10.3390/v9050106. Viruses. 2017. PMID: 28492506 Free PMC article.
-
Distinct Genome Replication and Transcription Strategies within the Growing Filovirus Family.J Mol Biol. 2019 Oct 4;431(21):4290-4320. doi: 10.1016/j.jmb.2019.06.029. Epub 2019 Jun 29. J Mol Biol. 2019. PMID: 31260690 Free PMC article. Review.
-
Ebolavirus and Marburgvirus: insight the Filoviridae family.Mol Aspects Med. 2008 Jun;29(3):151-85. doi: 10.1016/j.mam.2007.09.005. Epub 2007 Oct 22. Mol Aspects Med. 2008. PMID: 18063023 Review.
Cited by
-
A Perspective on the Development of Plant-Made Vaccines in the Fight against Ebola Virus.Front Immunol. 2017 Mar 10;8:252. doi: 10.3389/fimmu.2017.00252. eCollection 2017. Front Immunol. 2017. PMID: 28344580 Free PMC article. Review.
-
From dengue to Zika: the wide spread of mosquito-borne arboviruses.Eur J Clin Microbiol Infect Dis. 2019 Jan;38(1):3-14. doi: 10.1007/s10096-018-3375-7. Epub 2018 Sep 28. Eur J Clin Microbiol Infect Dis. 2019. PMID: 30267170 Review.
-
Mapping HLA-A2, -A3 and -B7 supertype-restricted T-cell epitopes in the ebolavirus proteome.BMC Genomics. 2018 Jan 19;19(Suppl 1):42. doi: 10.1186/s12864-017-4328-8. BMC Genomics. 2018. PMID: 29363421 Free PMC article.
-
Report of the 2019 NIST-FDA workshop on standards for next generation sequencing detection of viral adventitious agents in biologics and biomanufacturing.Biologicals. 2020 Mar;64:76-82. doi: 10.1016/j.biologicals.2020.02.003. Epub 2020 Feb 22. Biologicals. 2020. PMID: 32094072 Free PMC article.
-
New Perspectives on Ebola Virus Evolution.PLoS One. 2016 Aug 1;11(8):e0160410. doi: 10.1371/journal.pone.0160410. eCollection 2016. PLoS One. 2016. PMID: 27479005 Free PMC article.
References
-
- Audet J, Kobinger G. Immune evasion in Ebolavirus infections. Viral Immunol. 2014;28:10–8. - PubMed
Publication types
MeSH terms
LinkOut - more resources
Full Text Sources
Other Literature Sources
Medical
Miscellaneous
