. 2015 Dec 2;43(21):e144.
doi: 10.1093/nar/gkv718. Epub 2015 Jul 14.

Dual-colour imaging of RNAs using quencher- and fluorophore-binding aptamers

Affiliations

Dual-colour imaging of RNAs using quencher- and fluorophore-binding aptamers

Ankita Arora et al. Nucleic Acids Res. .

Abstract

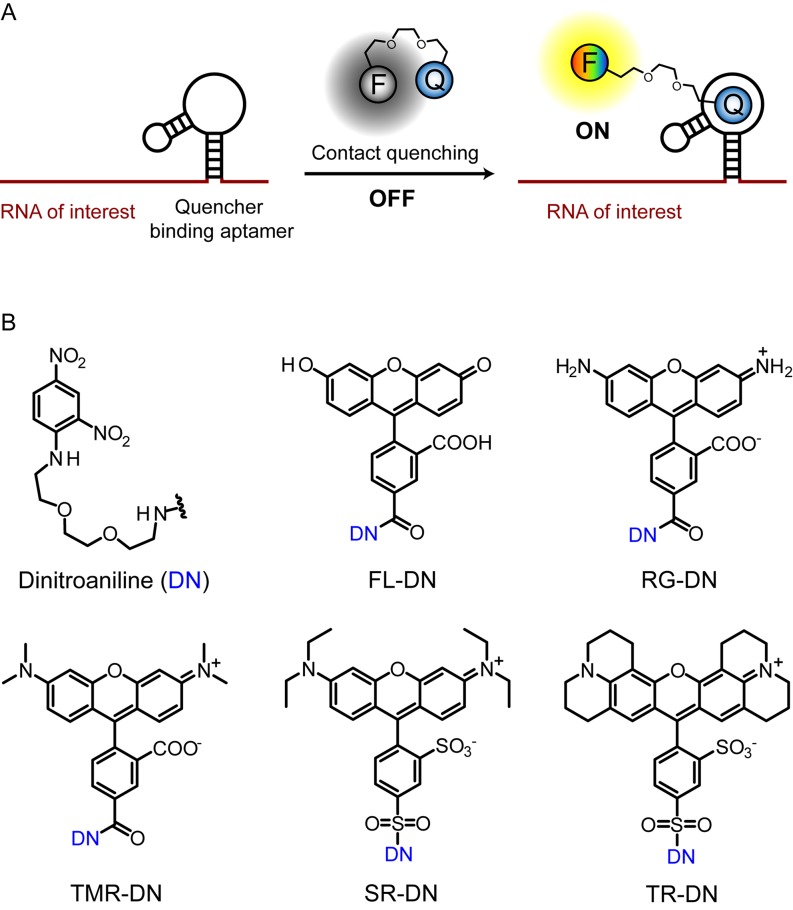
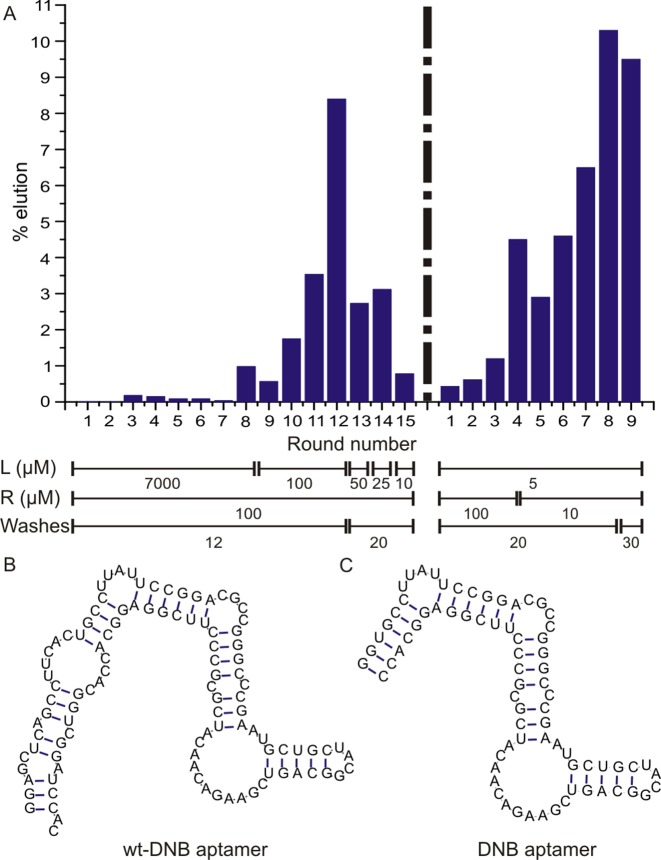
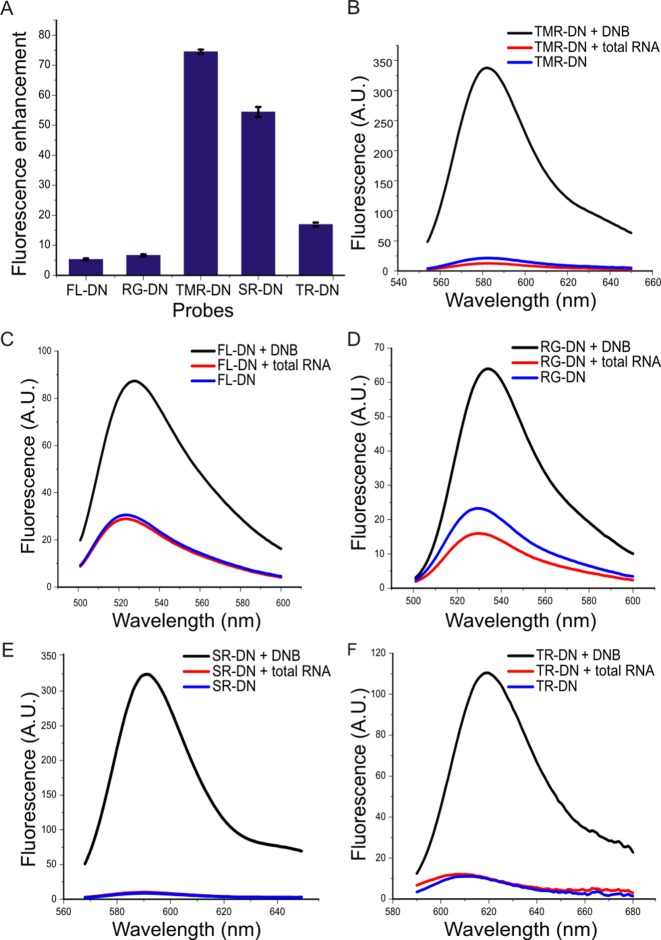
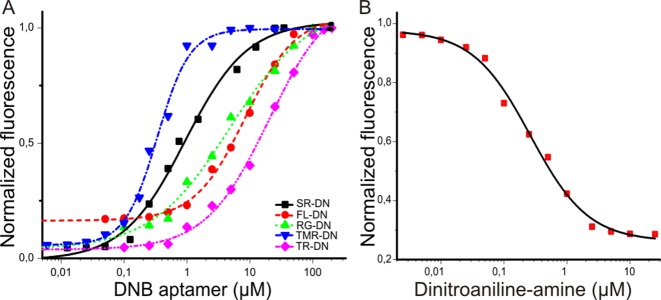
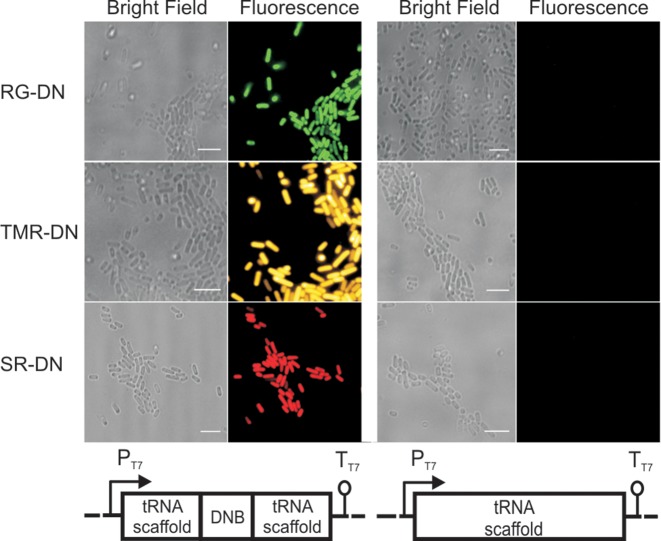
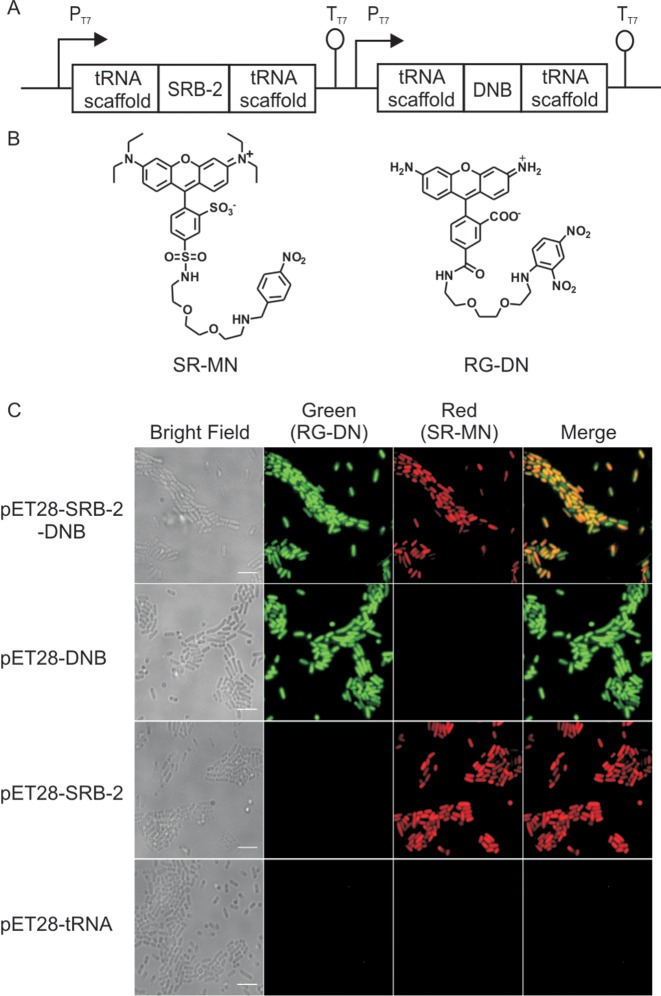
In order to gain deeper insight into the functions and dynamics of RNA in cells, the development of methods for imaging multiple RNAs simultaneously is of paramount importance. Here, we describe a modular approach to image RNA in living cells using an RNA aptamer that binds to dinitroaniline, an efficient general contact quencher. Dinitroaniline quenches the fluorescence of different fluorophores when directly conjugated to them via ethylene glycol linkers by forming a non-fluorescent intramolecular complex. Since the binding of the RNA aptamer to the quencher destroys the fluorophore-quencher complex, fluorescence increases dramatically upon binding. Using this principle, a series of fluorophores were turned into fluorescent turn-on probes by conjugating them to dinitroaniline. These probes ranged from fluorescein-dinitroaniline (green) to TexasRed-dinitroaniline (red) spanning across the visible spectrum. The dinitroaniline-binding aptamer (DNB) was generated by in vitro selection, and was found to bind all probes, leading to fluorescence increase in vitro and in living cells. When expressed in E. coli, the DNB aptamer could be labelled and visualized with different-coloured fluorophores and therefore it can be used as a genetically encoded tag to image target RNAs. Furthermore, combining contact-quenched fluorogenic probes with orthogonal DNB (the quencher-binding RNA aptamer) and SRB-2 aptamers (a fluorophore-binding RNA aptamer) allowed dual-colour imaging of two different fluorescence-enhancing RNA tags in living cells, opening new avenues for studying RNA co-localization and trafficking.


Figures

Figure 1.
Figure 1.
Scheme for imaging RNA by using contact-quenched fluorogenic probes. (A) The contact-quenched fluorophore-dinitroaniline conjugates (OFF) light up upon binding to the quencher binding aptamer (ON). RNA of interest can be fused to the quencher binding aptamer and imaged in the presence of the fluorophore-quencher conjugate. F denotes any fluorophore and Q denotes a contact quencher. (B) Structures of the contact quencher and fluorogenic probes used in this study. Dinitroaniline (DN) is the contact-quencher used in this work. FL-DN: fluorescein-dinitroaniline, RG-DN: rhodamine green dinitro­aniline, TMR-DN: tetramethylrhodamine-dinitro­aniline, SR-DN: sulforhodamine-dinitroaniline, TR-DN: TexasRed-dinitroaniline.
Figure 2.
Figure 2.
(A) Progress of the in vitro selection. Selection progress was monitored by calculating% of RNA eluted from dinitroaniline-immobilized resin. L denotes the ligand concentration (μM), R denotes the RNA concentration (μM) and W denotes the number of column washes for each round of SELEX. (B) Mfold-predicted secondary structure of wt-DNB aptamer. (C) Mfold-predicted secondary structure of DNB aptamer.
Figure 3.
Figure 3.
Confirmation of DNB aptamer's ability to restore the fluorescence of various fluorogenic probes. (A) Fluorescence enhancement factors (Faptamer:probe/Ftotal RNA:probe) obtained upon binding of the DNB aptamer (10 μM) to various probes (1 μM). Fluorescence emission spectra of various probes (1 μM) in the presence of DNB aptamer (10 μM, black), alone (blue) and in the presence of E. coli total RNA (red). (B) TMR-DN. (C) FL-DN. (D) RG-DN. (E) SR-DN. and (F) TR-DN.
Figure 4.
Figure 4.
Determination of the binding affinity between various probes and DNB. (A) Dissociation constants (KD) between DNB and various probes. The KD values were determined by titrating increasing amounts of aptamer with a fixed concentration of probe (100 nM) and measuring the fluorescence increase upon binding. The KD values were found to be 8.55 ± 0.53 μM for FL-DN-DNB (red), 4.48 ± 0.60 μM for RG-DN-DNB (green), 0.35 ± 0.05 μM for TMR-DN-DNB (blue), 0.80 ± 0.1 μM for SR-DN-DNB (black) and 18.0 ± 1.8 μM for TR-DN-DNB (pink). (B) The dissociation constant between dinitroaniline-amine (ligand used for SELEX) and DNB was calculated in a competition based assay where the DNB aptamer (100 nM) was saturated with SR-DN (1 μM) and the fluorescence decrease was measured upon addition of dinitroaniline-amine. The KD was determined from the IC50 obtained by the competition assay. KD was calculated to be 100 ± 14 nM.
Figure 5.
Figure 5.
Imaging DNB aptamer in live E. coli with various fluorophore-dinitroaniline conjugates. Bacteria were transformed with either pET28-DNB or pET28-tRNA plasmid. Transcription was induced with IPTG. Bacteria were incubated with 1 μM of RG-DN (green), TMR-DN (yellow) and SR-DN (red) for 5 min and imaged at 37°C. Scale bar, 5 μm.
Figure 6.
Figure 6.
Dual colour labelling strategy using a quencher-binding aptamer and a fluorophore-binding aptamer. (A) Cloning vector used for expressing both SRB-2 and DNB (pET-SRB-2-DNB) aptamers in E. coli. (B) Structure of the two fluorogenic probes used for dual-colour imaging, SR-MN: sulforhodamine B-p-nitrobenzyl­amine and RG-DN: Rhodamine green-dinitroaniline. (C) Imaging DNB and SRB-2 aptamers in live E. coli with RG-DN and SR-MN (1 μM, each), respectively. Fluorescence signal in both red and green channel was detected in cells expressing both DNB and SRB-2, while cells expressing either DNB or SRB-2 showed fluorescence only in the green or red channel, respectively. Cells expressing the tRNA scaffold showed no fluorescence signal. Scale bar, 5 μm.

Similar articles

Cited by

References

    1. Bratu D.P., Cha B.J., Mhlanga M.M., Kramer F.R., Tyagi S. Visualizing the distribution and transport of mRNAs in living cells. Proc. Natl. Acad. Sci. U.S.A. 2003;100:13308–13313. - PMC - PubMed
    1. Tyagi S., Kramer F.R. Molecular beacons: probes that fluoresce upon hybridization. Nat. Biotechnol. 1996;14:303–308. - PubMed
    1. Tyagi S. Imaging intracellular RNA distribution and dynamics in living cells. Nat. Methods. 2009;6:331–338. - PubMed
    1. Bertrand E., Chartrand P., Schaefer M., Shenoy S.M., Singer R.H., Long R.M. Localization of ASH1 mRNA particles in living yeast. Mol. Cell. 1998;2:437–445. - PubMed
    1. Valencia-Burton M., McCullough R.M., Cantor C.R., Broude N.E. RNA visualization in live bacterial cells using fluorescent protein complementation. Nat. Methods. 2007;4:421–427. - PubMed

Publication types