. 2015 Sep 4;290(36):22143-54.
doi: 10.1074/jbc.M115.641092. Epub 2015 Jul 14.

Lysophosphatidic Acid Initiates Epithelial to Mesenchymal Transition and Induces β-Catenin-mediated Transcription in Epithelial Ovarian Carcinoma

Affiliations

Lysophosphatidic Acid Initiates Epithelial to Mesenchymal Transition and Induces β-Catenin-mediated Transcription in Epithelial Ovarian Carcinoma

Rebecca J Burkhalter et al. J Biol Chem. .

Abstract

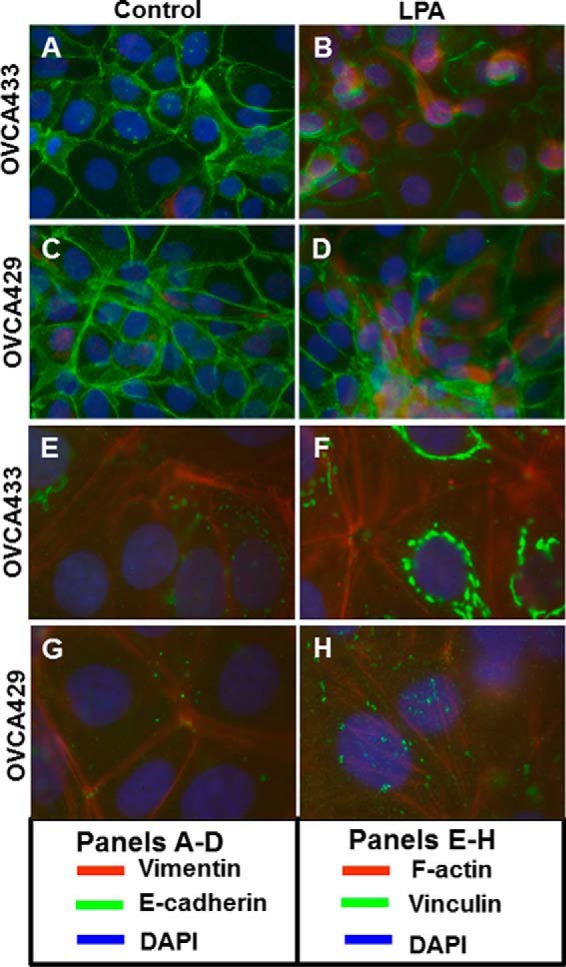
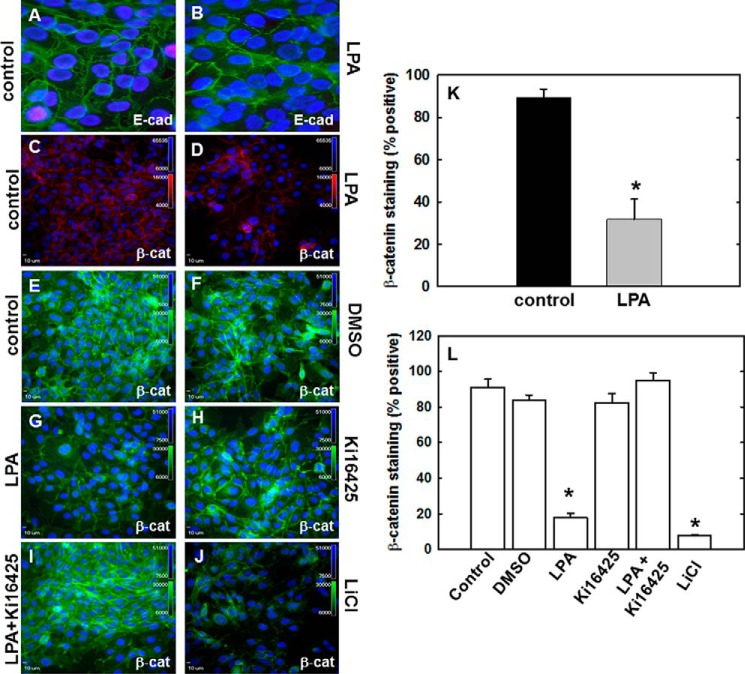
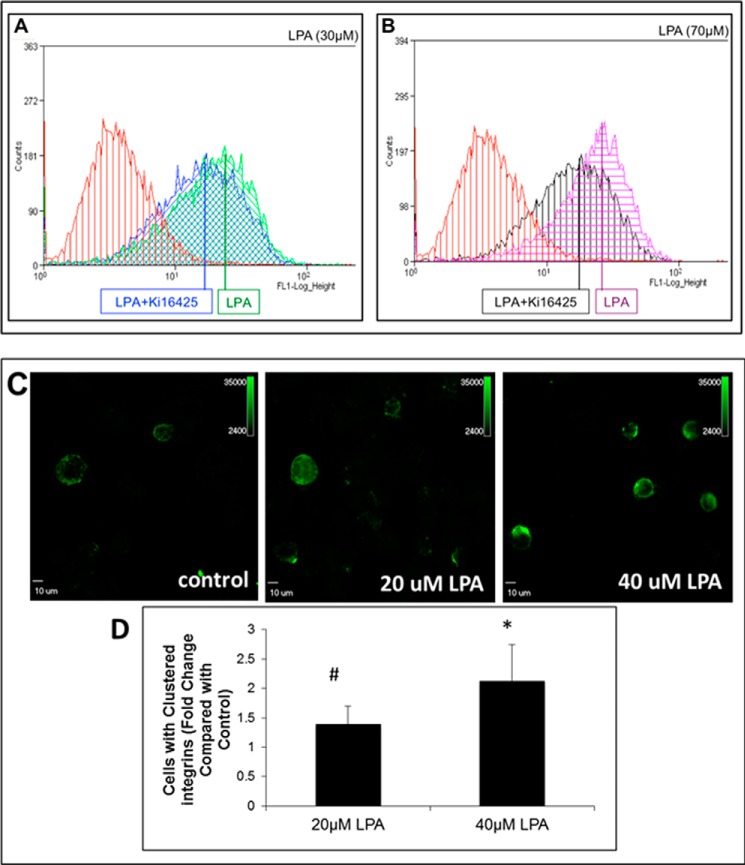
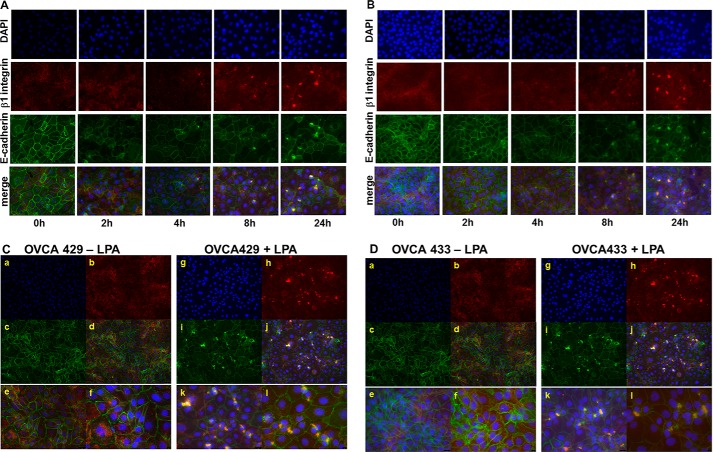
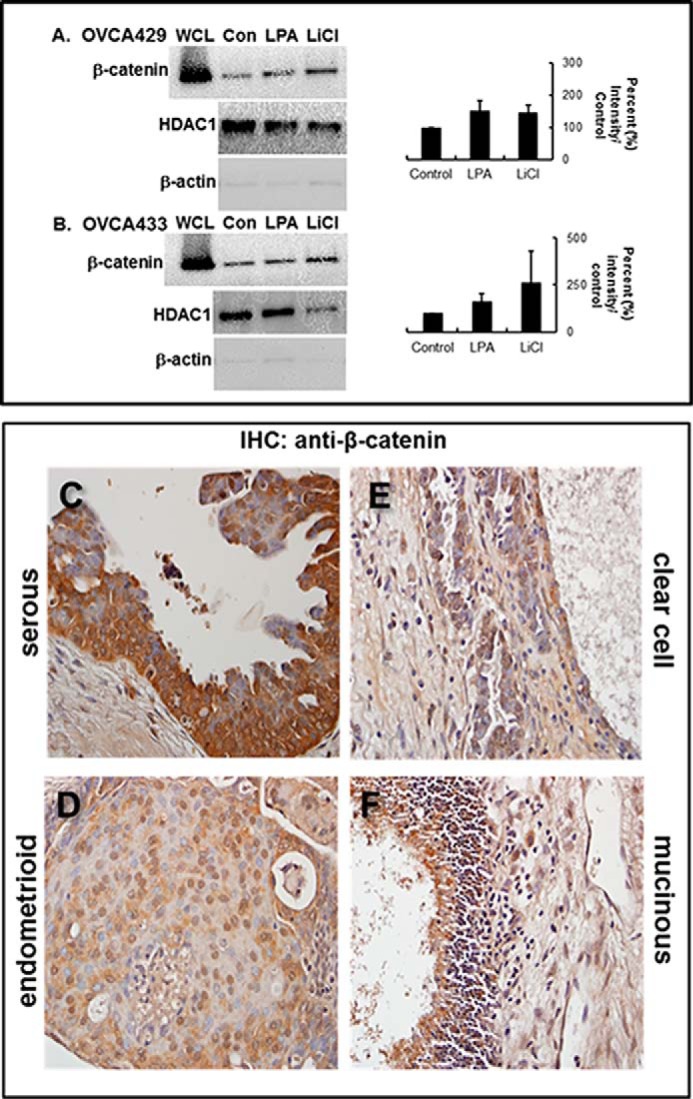
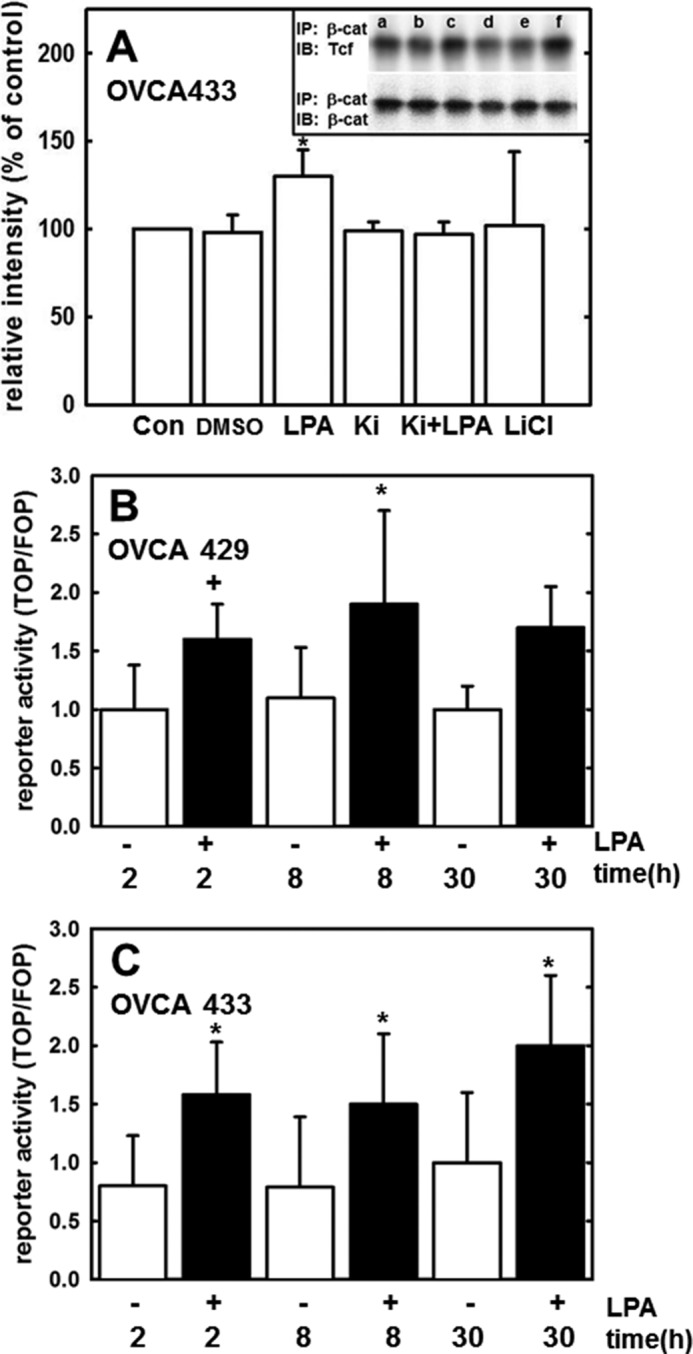
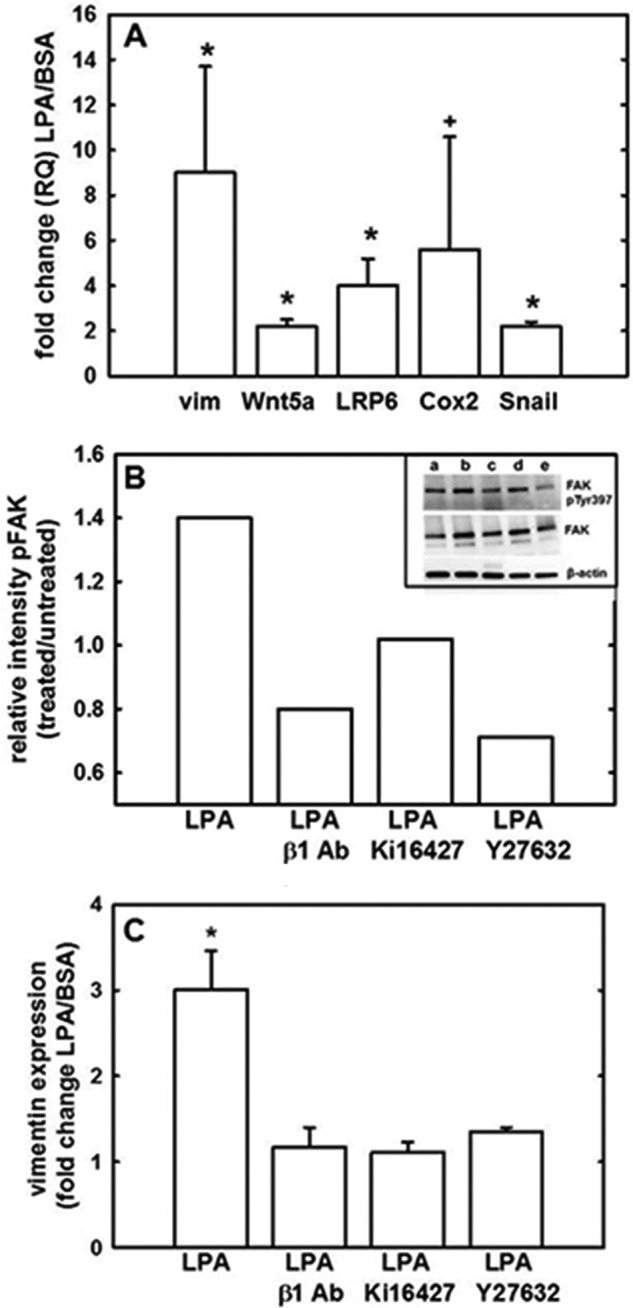
During tumor progression, epithelial ovarian cancer (EOC) cells undergo epithelial-to-mesenchymal transition (EMT), which influences metastatic success. Mutation-dependent activation of Wnt/β-catenin signaling has been implicated in gain of mesenchymal phenotype and loss of differentiation in several solid tumors; however, similar mutations are rare in most EOC histotypes. Nevertheless, evidence for activated Wnt/β-catenin signaling in EOC has been reported, and immunohistochemical analysis of human EOC tumors demonstrates nuclear staining in all histotypes. This study addresses the hypothesis that the bioactive lipid lysophosphatidic acid (LPA), prevalent in the EOC microenvironment, functions to regulate EMT in EOC. Our results demonstrate that LPA induces loss of junctional β-catenin, stimulates clustering of β1 integrins, and enhances the conformationally active population of surface β1 integrins. Furthermore, LPA treatment initiates nuclear translocation of β-catenin and transcriptional activation of Wnt/β-catenin target genes resulting in gain of mesenchymal marker expression. Together these data suggest that LPA initiates EMT in ovarian tumors through β1-integrin-dependent activation of Wnt/β-catenin signaling, providing a novel mechanism for mutation-independent activation of this pathway in EOC progression.

Keywords: LPA; Wnt signaling; integrin; lysophospholipid; ovarian cancer; β-catenin (β-catenin).


Figures

FIGURE 1.
FIGURE 1.
LPA initiates epithelial-to-mesenchymal transition in epithelial ovarian carcinoma cells. Multicellular aggregates formed from OVCA429 or OVCA433 cells were untreated or treated with 40 μm LPA overnight and stained for expression and localization of E-cadherin and vimentin (anti-E-cadherin, green, 1:300; anti-vimentin, red, 1:200) (A–D) or vinculin and F-actin (anti-vinculin, green, 1:100; rhodamine phalloidin labeling, red) (E–H). Nuclei were stained with DAPI (blue). Magnification ×20.
FIGURE 2.
FIGURE 2.
LPA mediates loss of E-cadherin and β-catenin surface expression in an LPA receptor-dependent manner. A–D, OVCA433 cells were untreated (A and C) or treated with 40 μm LPA for 2 h (B and D) and stained for expression of E-cadherin (E-cad) (A and B; anti-E-cadherin, 1:300, green) or β-catenin (β-cat) (C and D; anti-β-catenin, 1:100, red). E–J, cells were pretreated as indicated with the LPA receptor inhibitor, Ki16425 (40 μm; H and I) or DMSO vehicle control (F). Cells were then treated with 40 μm LPA (G and I) for 2 h. Controls included untreated cells (negative control; E) and cells treated with the GSK3-β inhibitor, 40 μm LiCl (positive control; J). Cells were fixed as described above and processed for immunofluorescent staining (anti-β-catenin, green, 1:200). The experiment was repeated in triplicate. K and L, quantitation of junctional β-catenin staining was performed by counting a minimum of 12 fields per treatment and scoring as positive the number of cells with two remaining fluorescent cell-cell borders (30). K, quantitation of data represented by C and D above. L, quantitation of data represented by E–J above. *, p < 0.05
FIGURE 3.
FIGURE 3.
LPA induces β1 integrin activation and clustering. A and B, LPA activation of β1 integrins. OVCA433 cells were serum-starved, pretreated with the LPA receptor inhibitor Ki16425 (40 μm), where indicated, and then treated with the indicated concentrations of LPA for 1 h. Following incubation with anti-active β1 integrin antibody (1:100, 1 h) and mouse anti-IgG Alexa Fluor 488 (1:500, 30 min), cells were analyzed for surface expression of active β1 integrin by flow cytometry. β1 integrin is activated in response to 30 μm LPA (A, green) and 70 μm LPA (B, purple). Inhibition of LPA receptor with Ki16425 partially blocks β1 integrin activation (A, blue, and B, black). Data from untreated control cells are shown in red. Figure shows a representative histogram from triplicate experiments. C and D, immunofluorescent evaluation of β1 integrin clustering. Suspended cells were treated with LPA (40 μm, 1 h) and then incubated with function-blocking anti-β1-integrin antibody (clone MAB1959, 1:50, 40 min) on ice, followed by mouse anti-IgG (37 °C) to cross-link integrins (30 min). Cell suspensions were cytocentrifuged onto 22-mm2 glass coverslips for immunofluorescent staining with anti-β1-integrin (1:200, clone MAB2250) and mouse anti-IgG-Alexa Fluor 488 (1:500). #, p < 0.1; *, p < 0.05.
FIGURE 4.
FIGURE 4.
LPA induces β1 integrin aggregation and β1 integrin/E-cadherin co-localization. A and B, OVCA 429 (A) or OVCA433 (B) cells were grown on coverslips coated with type I collagen (10 μg/ml) prior to treatment with LPA (30 μm) for the time periods shown. Cells were stained to evaluate localization of β1 integrin (anti-β1 integrin, 1:50 and Alexa Fluor 594 goat anti-mouse IgG, 1:400, red) or E-cadherin (anti-E-cadherin, 1:100 and Alexa Fluor 488 goat anti-rabbit IgG, 1:400, green). Nuclei are stained with DAPI (blue). Merged images (×40 magnification) show β1 integrin clustering beginning at 4 h. C and D, co-localization of E-cadherin with clustered β1 integrin. OVCA 429 (C) or OVCA433 (D) cells were grown in the absence (left panels) or presence (right panels) of LPA (30 μm) for 24 h prior to analysis by dual label immunofluorescence microscopy. Panels a and g, DAPI; panels b and h, β1 integrin; panels c and i, E-cadherin; panels d–f and j–l, merged images. Panels a–d and g–j, ×20 magnification; panels e and k, ×40 magnification; panels f and l, ×60 magnification. Merged images demonstrate LPA-dependent co-localization of E-cadherin with clustered β1 integrins. Areas of co-localization of E-cadherin with β1 integrin are visible in cells treated with LPA treatment (right panels, C and D) relative to untreated controls (left panels, C and D).
FIGURE 5.
FIGURE 5.
LPA induces LPA receptor-dependent nuclear translocation of β-catenin. A and B, cells were treated as labeled (Con, untreated control; LPA, 40 μm; LiCl, positive control, 40 μm) and then subjected to subcellular fractionation as described under “Experimental Procedures.” Fractions were electrophoresed on 9% SDS-polyacrylamide gels and immunoblotted for β-catenin expression (anti-β-catenin, 1:1000). From analysis of triplicate blots, β-catenin staining in the nuclear fraction of both OVCA429 (A) and OVCA433 (B) cell lines was increased ∼50% in LPA-treated cells compared with control (graphs). Control blots were probed with HDAC1 (middle panels) or β-actin (lower panels) to detect the presence of nuclear or cytoplasmic compartments, respectively. WCL designates unfractionated whole cell lysate. Molecular mass of β-catenin, 92 kDa. C–F, representative samples of each of the four major EOC histotypes were stained by immunohistochemistry (IHC) with anti-β-catenin (BD Transduction Laboratories, 1:50) and a biotinylated secondary antibody (1:200; Vectastain ABC, Vector Laboratories). Slides were finally subjected to 3,3′-diaminobenzidine peroxidase (Vector Laboratories) exposure and hematoxylin staining. β-Catenin staining is present at cell-cell junctions, in the cytoplasm, and in the nucleus. Nuclear β-catenin is found in serous (C), endometrioid (D), clear cell (E), and mucinous (F) tumors.
FIGURE 6.
FIGURE 6.
β-Catenin co-localization and activation of Tcf/Lef transcription following LPA treatment. A, inset, cells were treated for 24 h as follows: (Con, lane a) untreated; (DMSO, lane b) DMSO vehicle control; (LPA, lane c) LPA 40 μm; (Ki, lane d) Ki16425; LPA receptor inhibitor, 40 μm (Ki + LPA, lane e) LPA + Ki16425; and (LiCl, lane f) LiCl (GSK3-β inhibitor/positive control, 40 μm). Where indicated, inhibitor was preincubated for 15 min prior to addition of LPA. Following treatment, cells were lysed, and β-catenin was immunoprecipitated (IP) as described under “Experimental Procedures.” Lysates were electrophoresed on 9% SDS-polyacrylamide gels and immunoblotted (IB) with an anti-Tcf antibody (inset, 1:1000) or anti-β-catenin (inset, 1:1000). Band intensity was quantified using FUJIFILM MultiGauge version 3.0 and is represented as relative intensity (percent of control). Experiment was repeated in triplicate. Molecular mass of Tcf, 50 kDa; molecular mass of β-catenin, 92 kDa. *, < 0.05. B and C, OVCA429 and OVCA433 cells, respectively, were transiently co-transfected with either FOP reporter construct/Renilla luciferase reporter construct or TOP reporter construct/Renilla luciferase reporter construct and then treated with 40 μm LPA for 2, 8, or 30 h as indicated. Luciferase reporter activity was measured using a luminometer as described under “Experimental Procedures.” Experiment was conducted in triplicate. *, p < 0.05; +, p = 0.08.
FIGURE 7.
FIGURE 7.
LPA-activated transcription of β-catenin target genes is dependent on β1 integrin clustering. A, LPA induces expression of Wnt/β-catenin target genes. OVCA433 cells were treated with 40 μm LPA or 1% BSA in PBS control, and total RNA was isolated and analyzed for changes in gene expression by quantitative RT-PCR (2(−ΔΔCt) method). Data represent the mean of four independent experiments. *, p < 0.05; +, p < 0.1. B, LPA induces phosphorylation of FAK. Inset, OVCA429 cells were as follows: lane a, untreated or lanes b–e, treated with LPA (40 μm) in the presence of β1 integrin blocking antibodies (1:100) (lane c), the LPA receptor inhibitor Ki16427 (10 μm) (lane d), or the Rho/ROCK inhibitor Y27632 (10 μm) (lane e). Cells were lysed and lysates electrophoresed on 4–20% SDS-polyacrylamide gels (Bio-Rad) and immunoblotted for phospho-Tyr-397 FAK (1:1000), total FAK (1:200), or β-actin (1:5000). Experiment was conducted in duplicate. Band intensity was quantified using FUJIFILM MultiGauge version 3.0 and is represented as relative intensity (treated versus untreated, where untreated is designated as 1). Molecular mass of FAK and phospho-FAK, 125 kDa; molecular mass of β-actin, 40 kDa. C, inhibition of LPA-induced vimentin expression. OVCA429 cells were treated with LPA (40 μm) either alone or in the presence of β1 integrin blocking antibodies (1:100), the LPA receptor inhibitor Ki16427 (10 μm), or the Rho/ROCK inhibitor Y27632 (10 μm). Total RNA was isolated and analyzed for changes in vimentin expression by quantitative RT-PCR (2(−ΔΔCt) method). Data represent the mean of triplicate experiments. *, p < 0.05.

References

    1. Cannistra S. A. (2004) Cancer of the ovary. N. Engl. J. Med. 351, 2519–2529 - PubMed
    1. Seidman J. D., Horkayne-Szakaly I., Haiba M., Boice C. R., Kurman R. J., Ronnett B. M. (2004) The histologic type and stage distribution of ovarian carcinomas of surface epithelial origin. Int. J. Gynecol. Pathol. 23, 41–44 - PubMed
    1. Kurman R. J., Shih IeM. (2010) The origin and pathogenesis of epithelial ovarian cancer: a proposed unifying theory. Am. J. Surg. Pathol. 34, 433–443 - PMC - PubMed
    1. American Cancer Society (2010) Cancer facts & figures. American Cancer Society, Atlanta, GA
    1. Surveillance Research Program, NCI (2014) SEER Stat Fact Sheets: Ovary cancer. National Cancer Institute, Bethesda

Publication types

MeSH terms