. 2015 Nov;33(11):3266-80.
doi: 10.1002/stem.2093. Epub 2015 Jul 29.

Genome-Wide MicroRNA and Gene Analysis of Mesenchymal Stem Cell Chondrogenesis Identifies an Essential Role and Multiple Targets for miR-140-5p

Affiliations

Genome-Wide MicroRNA and Gene Analysis of Mesenchymal Stem Cell Chondrogenesis Identifies an Essential Role and Multiple Targets for miR-140-5p

Matt J Barter et al. Stem Cells. 2015 Nov.

Abstract

microRNAs (miRNAs) are abundantly expressed in development where they are critical determinants of cell differentiation and phenotype. Accordingly miRNAs are essential for normal skeletal development and chondrogenesis in particular. However, the question of which miRNAs are specific to the chondrocyte phenotype has not been fully addressed. Using microarray analysis of miRNA expression during mesenchymal stem cell chondrogenic differentiation and detailed examination of the role of essential differentiation factors, such as SOX9, TGF-β, and the cell condensation phase, we characterize the repertoire of specific miRNAs involved in chondrocyte development, highlighting in particular miR-140 and miR-455. Further with the use of mRNA microarray data we integrate miRNA expression and mRNA expression during chondrogenesis to underline the particular importance of miR-140, especially the -5p strand. We provide a detailed identification and validation of direct targets of miR-140-5p in both chondrogenesis and adult chondrocytes with the use of microarray and 3'UTR analysis. This emphasizes the diverse array of targets and pathways regulated by miR-140-5p. We are also able to confirm previous experimentally identified targets but, additionally, identify a novel positive regulation of the Wnt signaling pathway by miR-140-5p. Wnt signaling has a complex role in chondrogenesis and skeletal development and these findings illustrate a previously unidentified role for miR-140-5p in regulation of Wnt signaling in these processes. Together these developments further highlight the role of miRNAs during chondrogenesis to improve our understanding of chondrocyte development and guide cartilage tissue engineering.

Keywords: Chondrogenesis; Differentiation; Epigenetics; Gene expression; Mesenchymal stem cells; miRNA.


Figures

Figure 1
Figure 1
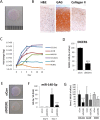
MicroRNA processing machinery is essential for chondrogenesis. (A): Mesenchymal stem cells (MSCs) were cultured in chondrogenic differentiation medium for 14 days in hanging transwell inserts to form a cartilaginous disc. (B): Day 14 chondrogenic discs were fixed, sectioned, and stained with H&E, safranin O (GAG), or anti‐collagen II antibody. (C): RNA was extracted from MSCs undergoing chondrogenic differentiation at the indicated time points between Day 0 and Day 14, and expression of the indicated genes measured by real‐time RT‐PCR. (D–G): MSCs were transfected for 3 days with DICER1‐targeting or nontargeting control siRNA prior to chondrogenic differentiation for 3 days in hanging transwell inserts. RNA was extracted at Days 0 and 3, and the indicated gene expression assessed by real‐time RT‐PCR. (D): DICER1 expression at Day 0 normalized to 18S. (E): Day 3 chondrogenic discs overlaid on transwell membrane. (F): miR‐140‐5p expression normalized to U6. (G): Day 3 chondrogenesis gene expression normalized to 18S. (A), (B), (C), and (E) are representative of experiments performed in four MSC donors. Values in (D), (F), and (G) are the mean ± SEM of data pooled from four separate MSC donors. *, p < .01; ***, p < .001 for DICER1 siRNA versus nontargeting siRNA for each gene per time point. Abbreviation: H&E, hematoxylin and eosin.
Figure 2
Figure 2
Profile of miRNA expression during chondrogenesis. MSCs were cultured in chondrogenic differentiation medium for 14 days in hanging transwell inserts to form a cartilaginous disc. RNA was extracted at the indicated time points between Day 0 and Day 14. (A): Heatmap representation of more than twofold significantly regulated miRNA expression assessed by microarray from one MSC donor. (B): Expression of selected miRNAs in data pooled three from MSC donors by real‐time RT‐PCR. (C): Venn diagram of common miRNAs regulated in human MSC and mouse ATDC5 chondrogenesis. miRNAs in red or blue are upregulated or downregulated, respectively, in both models of chondrogenesis. Abbreviation: MSC, mesenchymal stem cell.
Figure 3
Figure 3
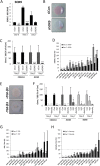
Requirement for SOX9, TGF‐β, and high density in chondrogenic miRNA expression. (A–D): Mesenchymal stem cells (MSCs) were transfected for 3 days with SOX9‐targeting or nontargeting control siRNA prior to chondrogenic differentiation for 7 days in hanging transwell inserts. RNA was extracted at Days 0, 3, and 7, and the indicated gene expression assessed by real‐time RT‐PCR. (A): SOX9 expression normalized to 18S. (B): Day 3 chondrogenesis disc overlaid on transwell membrane. (C): Days 3 and 7 chondrogenesis gene expression normalized to 18S. (D): Days 3 and 7 chondrogenesis miRNA expression following SOX9 depletion. Expression is normalized to U6 and presented as a percentage of nontargeting control levels. (E–H): MSCs were cultured in chondrogenic differentiation medium with or without TGF‐β3 for 7 days in hanging transwell inserts to form a cartilaginous disc or in monolayer at low cell density. (E): Day 3 chondrogenesis disc overlaid on transwell membrane. (F): Days 3 and 7 chondrogenesis gene expression normalized to 18S. (G, H): Days 3 and 7 chondrogenesis miRNA expression following (G) TGF‐β3 removal or (H) monolayer culture. Expression is normalized to U6 and presented as a percentage of control levels. Values are the mean ± SEM of data pooled from three separate MSC donors. *, p < .05; **, p < .01; ***, p < .001 for (A–D) SOX9 siRNA versus nontargeting siRNA or (E–H) the specified treatment versus control for each gene or miRNA per time point.
Figure 4
Figure 4
Profile of mRNA expression during chondrogenesis. Mesenchymal stem cells (MSCs) were cultured in chondrogenic differentiation medium for 14 days in hanging transwell inserts to form a cartilaginous disc. RNA was extracted at the indicated time points between Day 0 and Day 14 and assessed by microarray for one MSC donor. (A): Heatmap and hierarchical clustering representation of top 50 gene expression changes assessed by microarray. (B): Sylamer analysis performed on the sorted gene list of expression changes at Day 14 compared to Day 0. Shown are Sylamer enrichment landscape plots for seven nt sequence words. The blue line represents miR‐140‐5p seed (AACCACT) match sites. (C): Dynamic regulatory event miner (DREM) analysis of microarray time course data of genes and miRNAs. The lines connect the medians of groups of regulated genes. The green nodes are those nodes where a set of genes, jointly upregulated or downregulated until that time, split. The size of the node is proportional to the SD of the expression change of set of genes passing through that node. miRs shown in blue are themselves upregulated in that segment of the time course. Only the miRs with the predicted highest confidence (p ≤ 5 × 10⁻⁶) are shown.
Figure 5
Figure 5
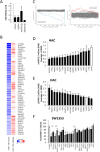
mRNA targets of miR‐140‐5p in chondrocytes. (A–C): HAC were transfected for 48 hours with miR‐140‐5p mimic (mi) or hairpin (hp) inhibitor, or nontargeting controls. RNA was extracted and gene expression assessed by microarray for one HAC donor. (A): miR‐140‐5p expression normalized to U6. (B): Heatmap of top 25 genes downregulated by miR‐140‐5p mimic and top 25 upregulated by miR‐140‐5p hairpin inhibitor ordered by difference between mimic and inhibitor expression levels. (C): Sylamer analysis performed on the ordered gene list of expression changes after miR‐140‐5p mimic or inhibitor treatment compared to nontargeting control. Shown are Sylamer enrichment landscape plots for seven nt sequence words. The colored lines represent miR‐140‐5p seed match sites. (D, E): HAC were transfected for 48 hours with miR‐140‐5p mimic (mi) or power inhibitor (pi), or nontargeting control miRNA mimic or power inhibitor. Expression of selected genes following miR‐140‐5p (D) mimic or (E) inhibitor treatment by real‐time RT‐PCR. The ACAN gene is not a target of miR‐140‐5p and therefore acted as control. Expression is normalized to 18S and presented as fold change compared to nontargeting control levels. Values are the mean ± SEM of data pooled from four separate HAC donors with each experiment performed in hextuplicate. (F): Luciferase expression in SW1353 cells following cotransfection of miR‐140‐5p target 3′UTR reporter constructs and miR‐140‐5p mimic or nontargeting control mimic for 24 hours. Expression is normalized to renilla luciferase and presented as a percentage of control levels. Values are the mean ± SD of data pooled from two to six independent experiments. *, p < .05; **, p < .01; ***, p < .001 for each gene‐specific 3′UTR versus empty pmiRGLO plasmid. #, p < .05; ##, p < .01 for the indicated gene‐specific 3′UTR versus mutant gene‐specific 3′UTR. Abbreviation: HAC, human articular chondrocytes.
Figure 6
Figure 6
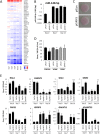
Effect of modulation of miR‐140‐5p levels on chondrogenesis, chondrocyte gene expression, and miR‐140‐5p target genes. (A): Heatmap of mesenchymal stem cell (MSC) chondrogenesis gene expression of the previously identified human articular chondrocytes top 50 miR‐140‐5p targets. (B–E): MSCs were transfected for 3 days with the indicated miR‐140‐5p inhibitors or nontargeting control inhibitors prior to chondrogenic differentiation for 14 days in hanging transwell inserts. RNA was extracted at Days 0, 7, and 14, and the indicated gene expression assessed by real‐time RT‐PCR. (B): miR‐140‐5p expression normalized to 18S. (C): Day 14 chondrogenic discs overlaid on transwell membrane. Representative of experiments performed in four MSC donors. (D): Day 14 chondrogenesis gene expression normalized to 18S. (E): Gene expression of selected experimentally verified miR‐140‐5p targets normalized to 18S. Presented as fold change compared to nontargeting control levels. Values are the mean ± SEM of data pooled from three to four separate MSC donors. *, p < .05; **, p < .01; ***, p < .001 for miR‐140‐5p inhibitor versus nontargeting inhibitor.
Figure 7
Figure 7
Effect of miR‐140‐5p on the Wnt signaling pathway. (A): MSCs were transfected for 3 days with miR‐140‐5p inhibitor or nontargeting control inhibitor prior to chondrogenic differentiation for 14 days in hanging transwell inserts. RNA was extracted at Days 0, 7, and 14, and FZD6 gene expression assessed by real‐time RT‐PCR. Presented as fold change compared to nontargeting control levels. **, p < .01 for miR‐140‐5p inhibitor versus nontargeting inhibitor. (B): MSC, human articular chondrocytes (HAC), or SW1353 cells were transfected with miR‐140‐5p mimic (mi) or nontargeting control miRNA mimic for 48 hours. WISP1 gene expression normalized to 18S. (C): Luciferase expression in SW1353 cells following cotransfection of TOPFlash/FOPFlash Wnt reporter constructs and miR‐140‐5p mimic or nontargeting control mimic for 24 hours +/− Wnt3a (100 ng/ml) stimulation for 24 hours. Expression is normalized to renilla luciferase and presented as fold change compared to nontargeting control levels. Values are the mean ± SD of data pooled from three independent experiments. *, p < .05 for miR‐140‐5p inhibitor versus nontargeting inhibitor. (D): MSCs were transfected with miR‐140‐5p mimic or nontargeting control miRNA mimic for 24 hours +/− Wnt3a (100 ng/ml) stimulation for 24 hours. Whole cell protein was extracted and the indicated proteins measured by immunoblotting. (E): SW1353 cells were transfected with miR‐140‐5p mimic or nontargeting control miRNA mimic for 24 hours. Cytoplasmic and nuclear protein fractions were extracted for immunoblotting. Anti‐Lamin and anti‐GAPDH antibodies were used to confirm nuclear and cytoplasmic fractionation, respectively. (F): Quantification of β‐catenin immunoblot whole cell and nuclear levels in four MSC donors and three independent SW1353 cell experiments. (G): AXIN2 expression after 48 hours normalized to 18S as for (B). For real‐time PCR, values are the mean ± SEM of data pooled from three to four separate MSC or HAC donors, or three independent experiments in SW1353 cells. Abbreviation: MSC, mesenchymal stem cell.

Similar articles

Cited by

References

    1. Onyekwelu I, Goldring MB, Hidaka C. Chondrogenesis, joint formation, and articular cartilage regeneration. J Cell Biochem 2009;107:383–392. - PubMed
    1. Akiyama H. Control of chondrogenesis by the transcription factor Sox9. Mod Rheumatol 2008;18:213–219. - PubMed
    1. Murdoch AD, Grady LM, Ablett MP et al. Chondrogenic differentiation of human bone marrow stem cells in transwell cultures: Generation of scaffold‐free cartilage. Stem Cells 2007;25:2786–2796. - PubMed
    1. Pittenger MF, Mackay AM, Beck SC et al. Multilineage potential of adult human mesenchymal stem cells. Science 1999;284:143–147. - PubMed
    1. Roelofs AJ, Rocke JP, De Bari C. Cell‐based approaches to joint surface repair: A research perspective. Osteoarthritis Cartilage 2013;21:892–900. - PMC - PubMed

Publication types