. 2015 Oct;66(20):6415-29.
doi: 10.1093/jxb/erv353. Epub 2015 Jul 13.

Transcriptome-wide characterization of candidate genes for improving the water use efficiency of energy crops grown on semiarid land

Affiliations

Transcriptome-wide characterization of candidate genes for improving the water use efficiency of energy crops grown on semiarid land

Yangyang Fan et al. J Exp Bot. 2015 Oct.

Abstract

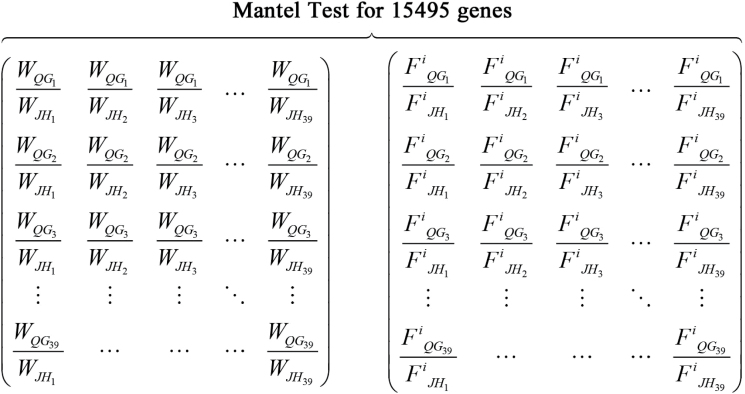
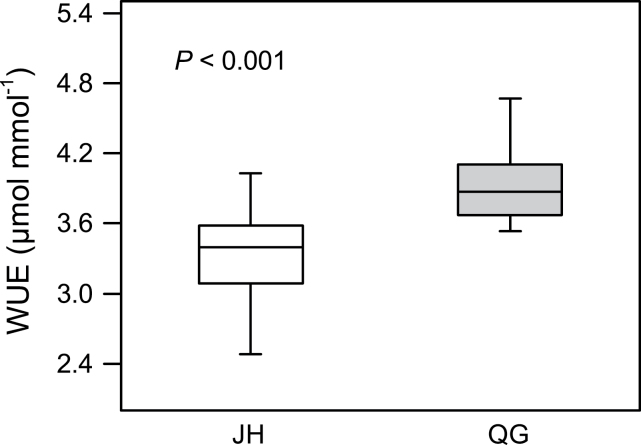
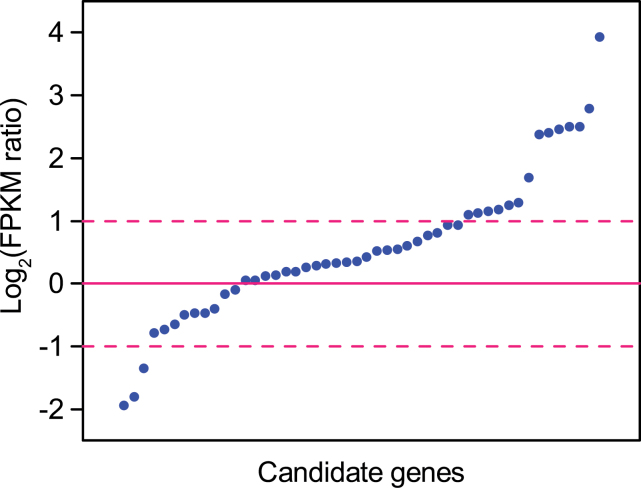
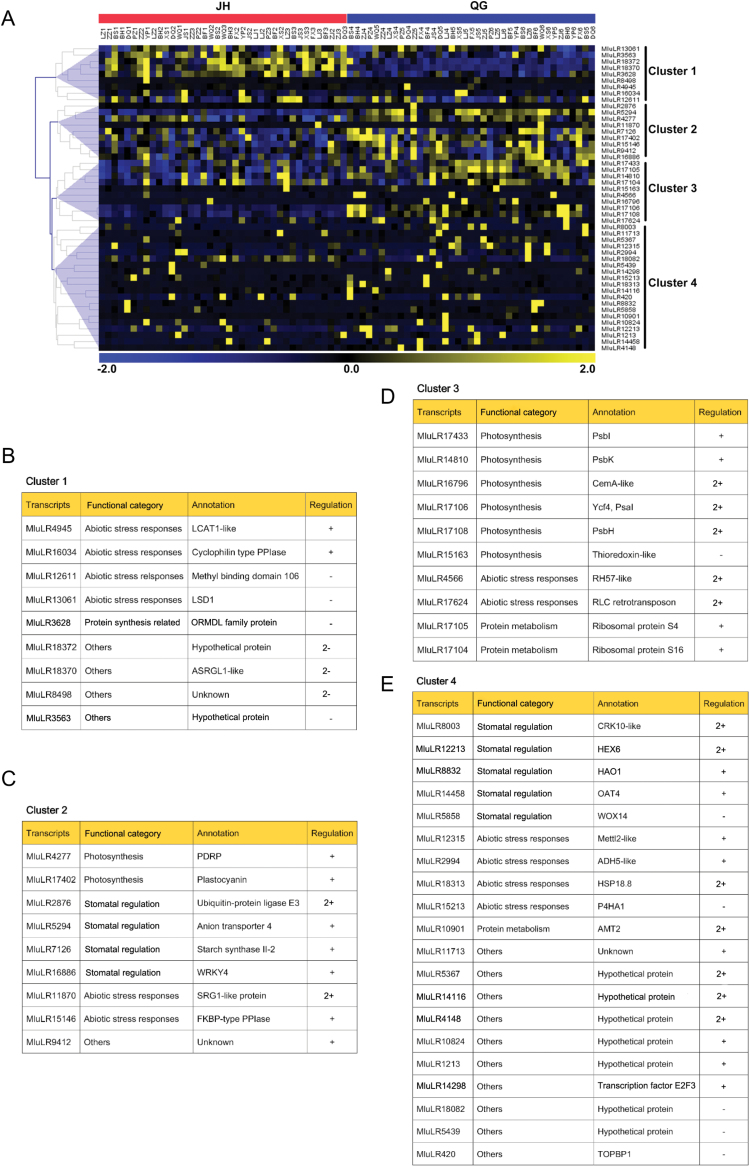
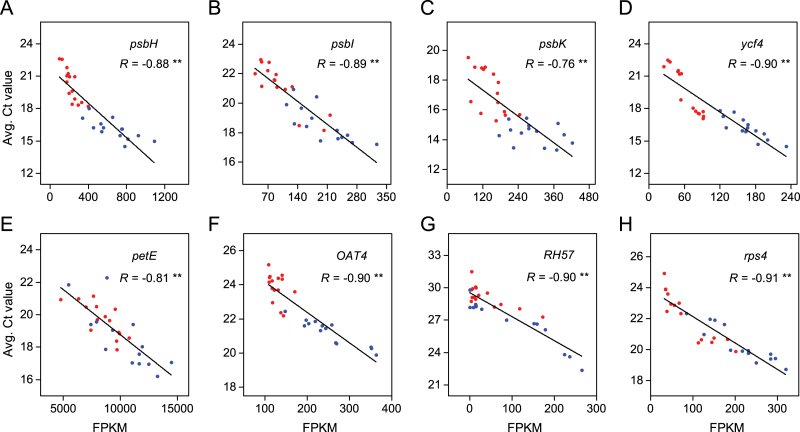
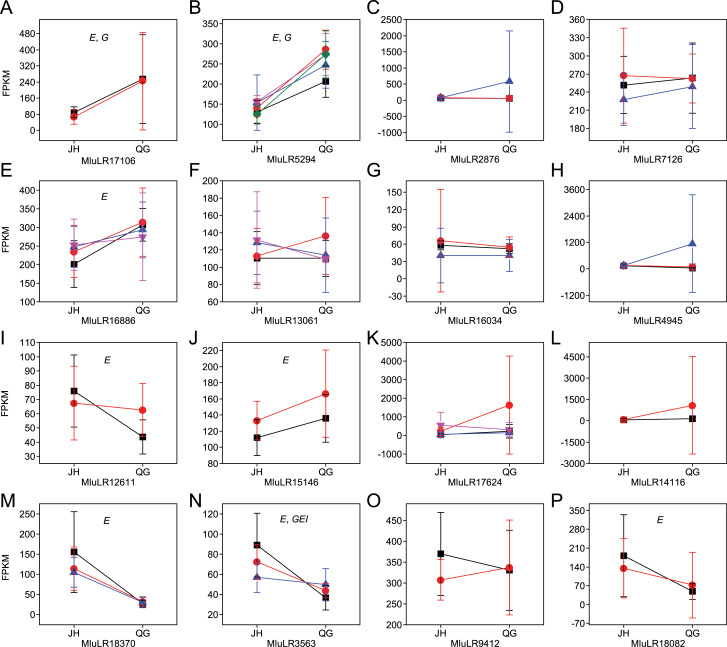
Understanding the genetic basis of water use efficiency (WUE) and its roles in plant adaptation to a drought environment is essential for the production of second-generation energy crops in water-deficit marginal land. In this study, RNA-Seq and WUE measurements were performed for 78 individuals of Miscanthus lutarioriparius grown in two common gardens, one located in warm and wet Central China near the native habitats of the species and the other located in the semiarid Loess Plateau, the domestication site of the energy crop. The field measurements showed that WUE of M. lutarioriparius in the semiarid location was significantly higher than that in the wet location. A matrix correlation analysis was conducted between gene expression levels and WUE to identify candidate genes involved in the improvement of WUE from the native to the domestication site. A total of 48 candidate genes were identified and assigned to functional categories, including photosynthesis, stomatal regulation, protein metabolism, and abiotic stress responses. Of these genes, nearly 73% were up-regulated in the semiarid site. It was also found that the relatively high expression variation of the WUE-related genes was affected to a larger extent by environment than by genetic variation. The study demonstrates that transcriptome-wide correlation between physiological phenotypes and expression levels offers an effective means for identifying candidate genes involved in the adaptation to environmental changes.

Keywords: Abiotic stress; Miscanthus lutarioriparius; RNA-Seq; adaptation; genetic and environmental interaction; water use efficiency..


Figures

Fig. 1.
Fig. 1.
Matrix correlation based on physiological trait and expression data. Water use efficiencies (W) ratio and FPKM (F) ratio matrices are performed by mantel test via Spearman’s rank correlation method. The mantel test is conducted on 15 495 transcripts of M. lutarioriparius (i=1, 2, …, 15 495). Each correlation is conducted by 10 000 permutations.
Fig. 2.
Fig. 2.
Comparison of water use efficiencies (WUE) of M. lutarioriparius between two sites. The empty boxplot shows the mean value of WUE in Jiangxia of Hubei Province (JH) and the solid boxplot the mean value of WUE in Qingyang of Gansu Province (QG). The t test between the WUE values in JH and QG is examined and the result shows that the WUE value of M. lutarioriparius is significantly higher in QG than in JH (P <0.001).
Fig. 3.
Fig. 3.
The distribution of gene expression change patterns of the candidate genes. Fold changes of gene expression levels are expressed in log2 (FPKM ratio), where the FPKM ratio was calculated as the ratio of FPKM (QG) to FPKM (JH). FPKM (JH) and FPKM (QG) values represent the average expression levels of each transcript in the experimental fields in Jiangxia of Hubei Province (JH) and Qingyang of Gansu Province (QG), respectively. The log-ratios beyond zero represent up-regulated genes, while the ratio of 1 and –1 mean 2-fold up-regulation and down-regulation, respectively.
Fig. 4.
Fig. 4.
(A) Hierarchical clustering of 48 candidate genes differentially expressed between individuals in JH (left) and QG (right). The normalized gene expression values (FPKM) of candidate genes of each individual are used for the cluster display. The colour scale (representing the normalized gene expression) is shown at the bottom. The genes which share similar expression patterns are divided into four groups, (B) Cluster 1, (C) Cluster 2, (D) Cluster 3, and (E) Cluster 4. For the full names of abbreviations in annotation see Table 2. Up-regulated (+), down-regulated (–), up-regulated more than 2-fold (2+), down-regulated more than 2-fold (2–).
Fig. 5.
Fig. 5.
Expression level correlation between RNA-Seq and qPCR. Negative correlation between FPKM values of RNA-Seq and average Ct values of qPCR indicate a consistent estimation of the relative expression levels between the two methods. The graphs (A)–(H) represent the genes: MluLR17108 (psbH), MluLR17433 (psbI), MluLR14810 (psbK), MluLR17106 (ycf4), MluLR17402 (petE), MluLR5294 (OAT4), MluLR4566 (RH57), MluLR17105 (rps4), respectively. The R in the graphs indicates the correlation coefficient. ** represents the significant level (P <0.01, Spearman’s rank correlation test). Sequences of PCR primers are given in Table 4. Red and blue dots represent individuals sampled from JH and QG, respectively.
Fig. 6.
Fig. 6.
Expression reaction norms for WUE-related genes with genetic variation responding to growth environments. Detecting significant effects of those factors on the gene expression level represent, respectively, genetic variation for gene expression (G), phenotypic plasticity (E), and genetic variation for phenotypic plasticity (GEI, genotype-by-environment interaction). The graphs (A)–(P) represent the genes: MluLR17106 (ycf4), MluLR5294 (OAT4), MluLR2876 (UBE3), MluLR7126 (SSII-2), MluLR16886 (WRKY4), MluLR13061 (LSD1), MluLR16034 (Cyclophilin-type PPIase), MluLR4945 (LCAT1-like), MluLR12611 (mbd106), MluLR15146 (FKBP-type PPIase), MluLR17624 (RLC), MluLR14116, MluLR18370 (ASRGL1-like), MluLR3563, MluLR9412, and MluLR18082, respectively. The detailed functional annotation of these genes are given in Table 2. The average expression levels (FPKM) are computed only on genotypes with more than or equal to three individuals. Different genotypes are in a different colour and the error bars indicate the standard deviations.

References

    1. Anholt RRH, Mackay TFC. 2004. Quantitative genetic analyses of complex behaviours in Drosophila . Nature Reviews Genetics 5, 838–849. - PubMed
    1. Benjamini Y, Hochberg Y. 1995. Controlling the false discovery rate: a practical and powerful approach to multiple testing. Journal of the Royal Statistical Society, Series B (Statistical Methodology) 57, 289–300.
    1. Berta M, Giovannelli A, Sebastiani F, Camussi A, Racchi ML. 2010. Transcriptome changes in the cambial region of poplar (Populus alba L.) in response to water deficit. Plant Biology 12, 341–354. - PubMed
    1. Bianchi MW, Damerval C, Vartanian N. 2002. Identification of proteins regulated by cross-talk between drought and hormone pathways in Arabidopsis wild-type and auxin-insensitive mutants, axr1 and axf2 . Functional Plant Biology 29, 55–61. - PubMed
    1. Boudreau E, Takahashi Y, Lemieux C, Turmel M, Rochaix JD. 1997. The chloroplast ycf3 and ycf4 open reading frames of Chlamydomonas reinhardtii are required for the accumulation of the photosystem I complex. EMBO Journal 16, 6095–6104. - PMC - PubMed

Publication types