

DNA-PKcs-Mediated Transcriptional Regulation Drives Prostate Cancer Progression and Metastasis
- PMID: 26175416
- PMCID: PMC4531387
- DOI: 10.1016/j.ccell.2015.06.004
DNA-PKcs-Mediated Transcriptional Regulation Drives Prostate Cancer Progression and Metastasis
Abstract
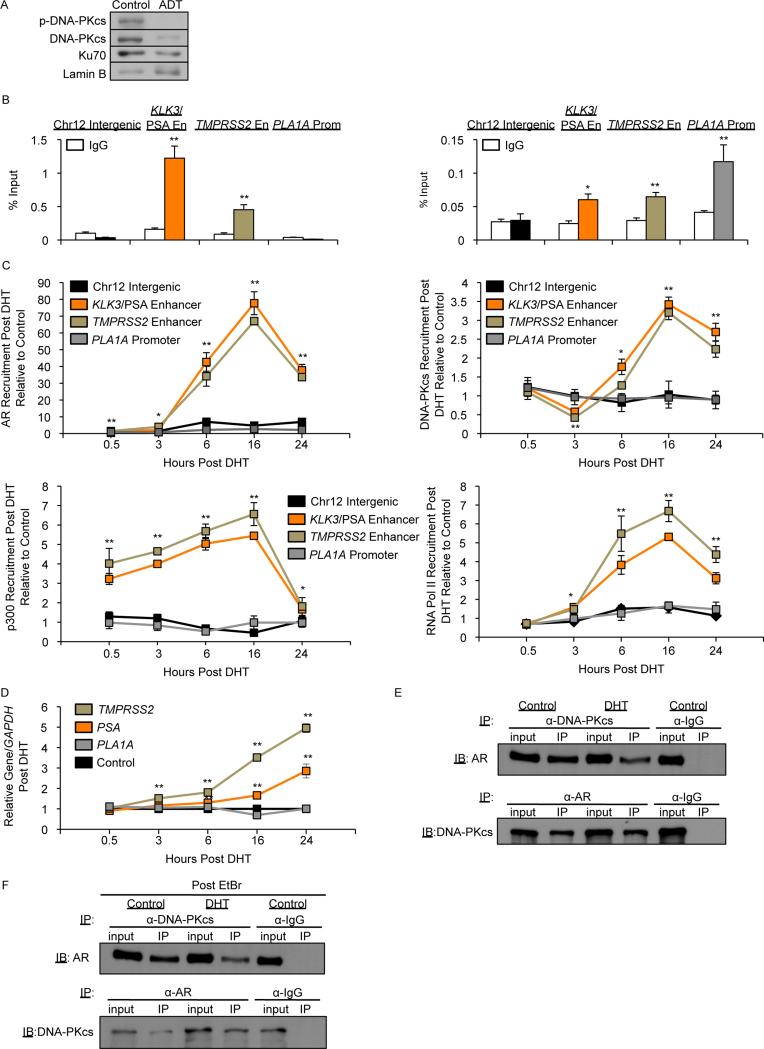
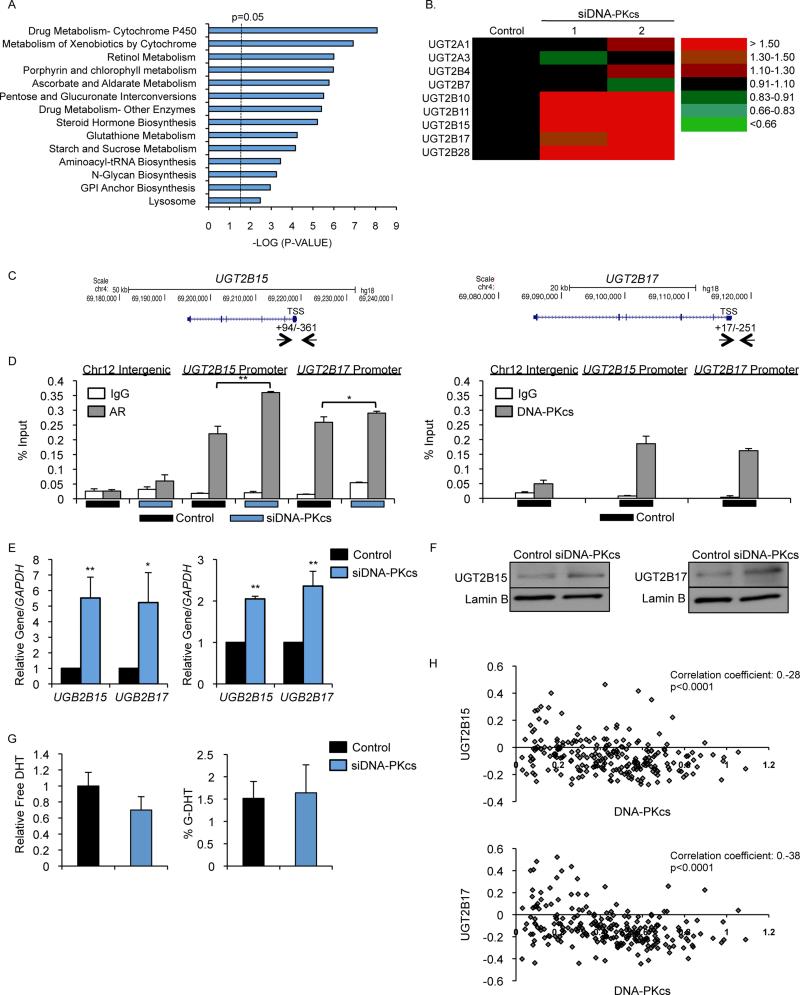
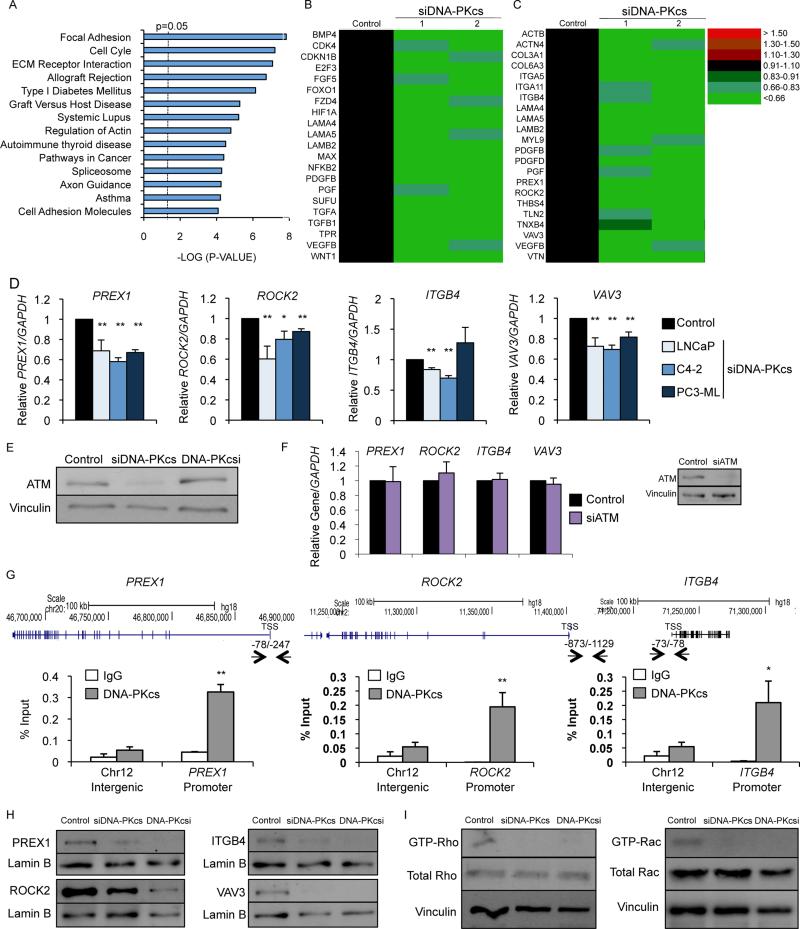
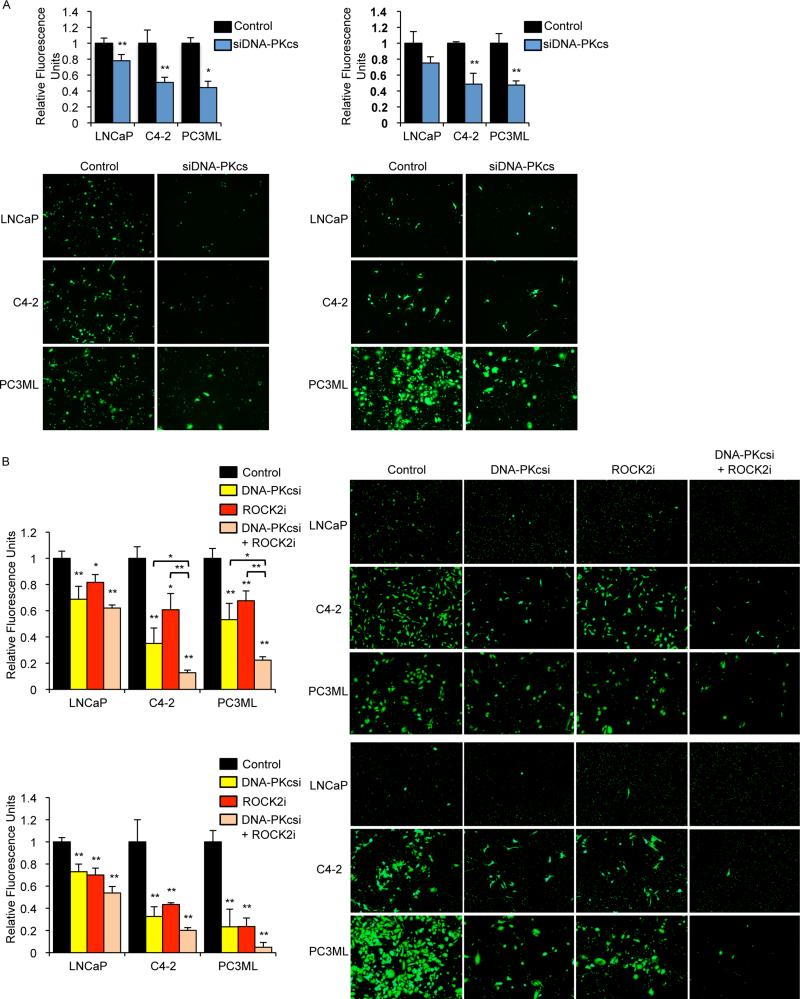
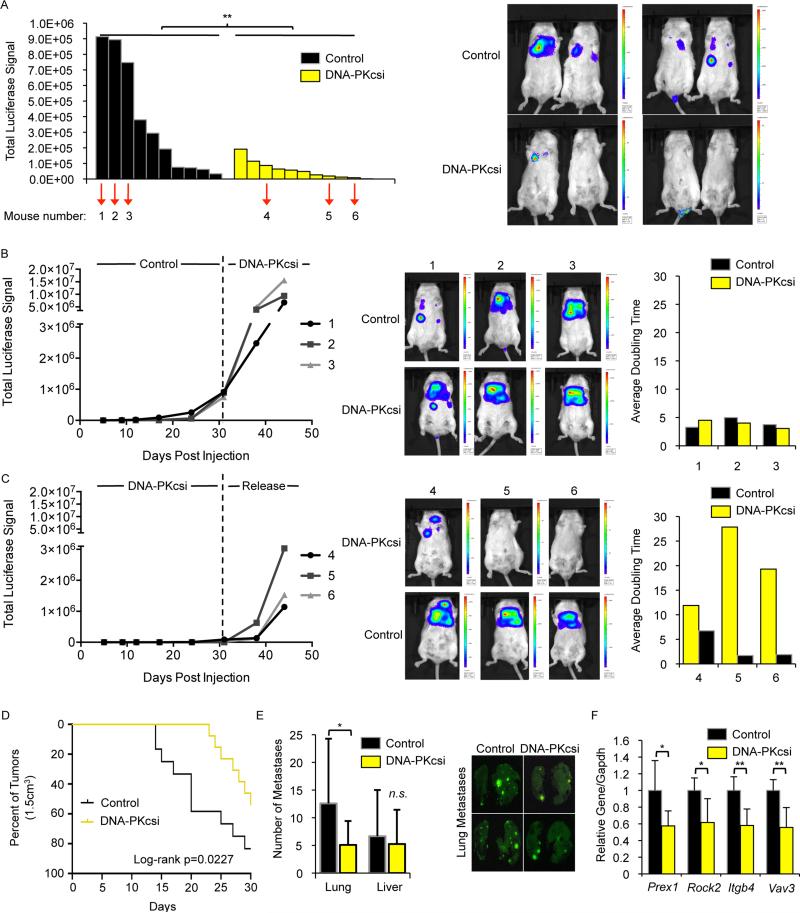
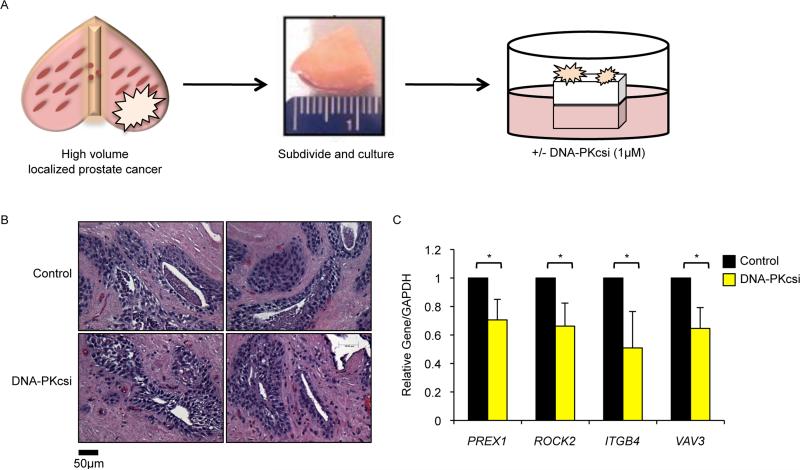
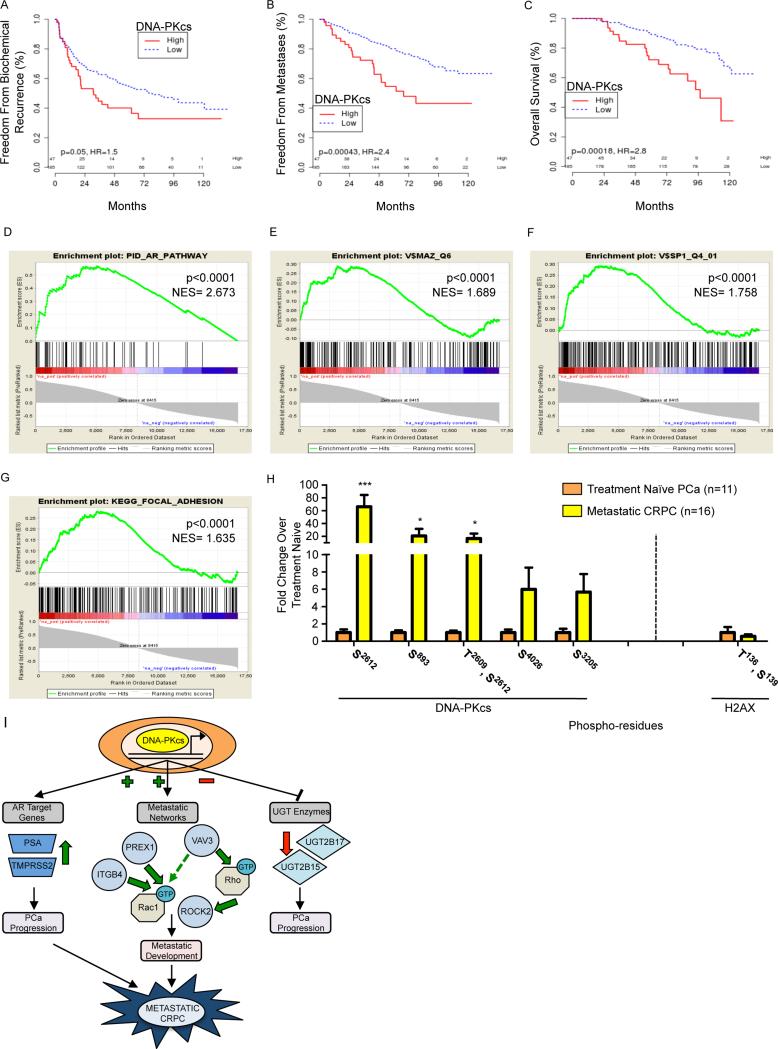
Emerging evidence demonstrates that the DNA repair kinase DNA-PKcs exerts divergent roles in transcriptional regulation of unsolved consequence. Here, in vitro and in vivo interrogation demonstrate that DNA-PKcs functions as a selective modulator of transcriptional networks that induce cell migration, invasion, and metastasis. Accordingly, suppression of DNA-PKcs inhibits tumor metastases. Clinical assessment revealed that DNA-PKcs is significantly elevated in advanced disease and independently predicts for metastases, recurrence, and reduced overall survival. Further investigation demonstrated that DNA-PKcs in advanced tumors is highly activated, independent of DNA damage indicators. Combined, these findings reveal unexpected DNA-PKcs functions, identify DNA-PKcs as a potent driver of tumor progression and metastases, and nominate DNA-PKcs as a therapeutic target for advanced malignancies.
Copyright © 2015 Elsevier Inc. All rights reserved.
Figures

Similar articles
-
A hormone-DNA repair circuit governs the response to genotoxic insult.Cancer Discov. 2013 Nov;3(11):1254-71. doi: 10.1158/2159-8290.CD-13-0108. Epub 2013 Sep 11. Cancer Discov. 2013. PMID: 24027197 Free PMC article.
-
DNA-PKcs expression predicts response to radiotherapy in prostate cancer.Int J Radiat Oncol Biol Phys. 2012 Dec 1;84(5):1179-85. doi: 10.1016/j.ijrobp.2012.02.014. Epub 2012 Apr 9. Int J Radiat Oncol Biol Phys. 2012. PMID: 22494583
-
DNA-PKcs: A promising therapeutic target in human hepatocellular carcinoma?DNA Repair (Amst). 2016 Nov;47:12-20. doi: 10.1016/j.dnarep.2016.10.004. Epub 2016 Oct 15. DNA Repair (Amst). 2016. PMID: 27789167 Review.
-
Therapeutic targeting of a robust non-oncogene addiction to PRKDC in ATM-defective tumors.Sci Transl Med. 2013 Jun 12;5(189):189ra78. doi: 10.1126/scitranslmed.3005814. Sci Transl Med. 2013. PMID: 23761041
-
Emerging functions of PRKDC in the initiation and progression of cancer.Tumori. 2021 Dec;107(6):483-488. doi: 10.1177/0300891620950472. Epub 2020 Aug 31. Tumori. 2021. PMID: 32867618 Review.
Cited by
-
Biomarker analysis of the MITO2 phase III trial of first-line treatment in ovarian cancer: predictive value of DNA-PK and phosphorylated ACC.Oncotarget. 2016 Nov 8;7(45):72654-72661. doi: 10.18632/oncotarget.12056. Oncotarget. 2016. PMID: 27655643 Free PMC article. Clinical Trial.
-
Deubiquitinase USP9X regulates the invasion of prostate cancer cells by regulating the ERK pathway and mitochondrial dynamics.Oncol Rep. 2019 Jun;41(6):3292-3304. doi: 10.3892/or.2019.7131. Epub 2019 Apr 18. Oncol Rep. 2019. PMID: 31002345 Free PMC article.
-
Gut Microbiota Dysbiosis Accelerates Prostate Cancer Progression Through Increased LPCAT1 Expression and Enhanced DNA Repair Pathways.Front Oncol. 2021 Jun 17;11:679712. doi: 10.3389/fonc.2021.679712. eCollection 2021. Front Oncol. 2021. PMID: 34221998 Free PMC article.
-
Epigenetic determinants of metastasis.Mol Oncol. 2017 Jan;11(1):79-96. doi: 10.1016/j.molonc.2016.09.008. Epub 2016 Oct 8. Mol Oncol. 2017. PMID: 27756687 Free PMC article. Review.
-
USP22 Functions as an Oncogenic Driver in Prostate Cancer by Regulating Cell Proliferation and DNA Repair.Cancer Res. 2020 Feb 1;80(3):430-443. doi: 10.1158/0008-5472.CAN-19-1033. Epub 2019 Nov 18. Cancer Res. 2020. PMID: 31740444 Free PMC article.
References
-
- Al-Ubaidi FL, Schultz N, Loseva O, Egevad L, Granfors T, Helleday T. Castration therapy results in decreased Ku70 levels in prostate cancer. Clin Cancer Res. 2013;19:1547–56. - PubMed
-
- Aytes A, Mitrofanova A, Kinkade CW, Lefebvre C, Lei M, Phelan V, LeKaye HC, Koutcher JA, Cardiff RD, Califano A, et al. ETV4 promotes metastasis in response to activation of PI3-kinase and Ras signaling in a mouse model of advanced prostate cancer. Proc Natl Acad Sci U S A. 2013;110:E3506–15. - PMC - PubMed
Publication types
MeSH terms
Substances
Associated data
- Actions
Grants and funding
- CA173481/CA/NCI NIH HHS/United States
- CA183929/CA/NCI NIH HHS/United States
- R25 CA098010/CA/NCI NIH HHS/United States
- CA176401/CA/NCI NIH HHS/United States
- UL1TR000124/TR/NCATS NIH HHS/United States
- R01 CA173481/CA/NCI NIH HHS/United States
- CA168585/CA/NCI NIH HHS/United States
- UL1 TR000124/TR/NCATS NIH HHS/United States
- R01 CA159945/CA/NCI NIH HHS/United States
- R25T CA098010/CA/NCI NIH HHS/United States
- CA159945/CA/NCI NIH HHS/United States
- GM089778/GM/NIGMS NIH HHS/United States
- R01 CA176401/CA/NCI NIH HHS/United States
- P01 CA168585/CA/NCI NIH HHS/United States
- R01 GM089778/GM/NIGMS NIH HHS/United States
- P30 CA056036/CA/NCI NIH HHS/United States
- R01 CA183929/CA/NCI NIH HHS/United States
LinkOut - more resources
Full Text Sources
Other Literature Sources
Medical
Molecular Biology Databases
