

Efficacy of aliskiren, compared with angiotensin II blockade, in slowing the progression of diabetic nephropathy in db/db mice: should the combination therapy be a focus?
- PMID: 26175845
- PMCID: PMC4494135
Efficacy of aliskiren, compared with angiotensin II blockade, in slowing the progression of diabetic nephropathy in db/db mice: should the combination therapy be a focus?
Abstract
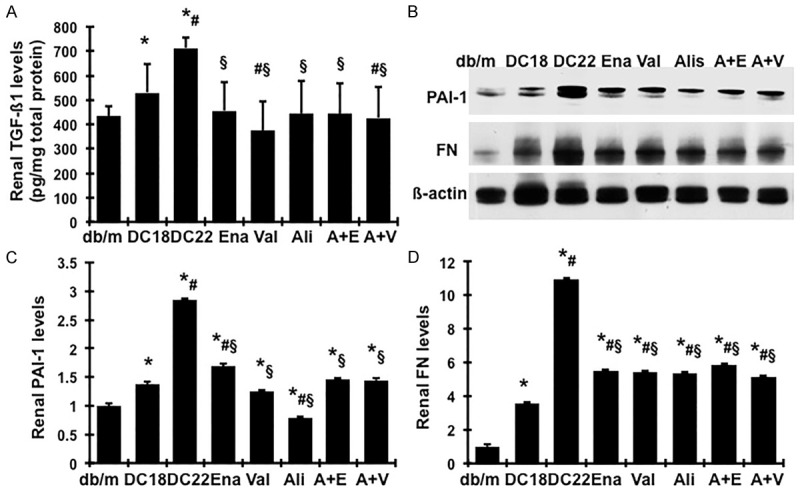
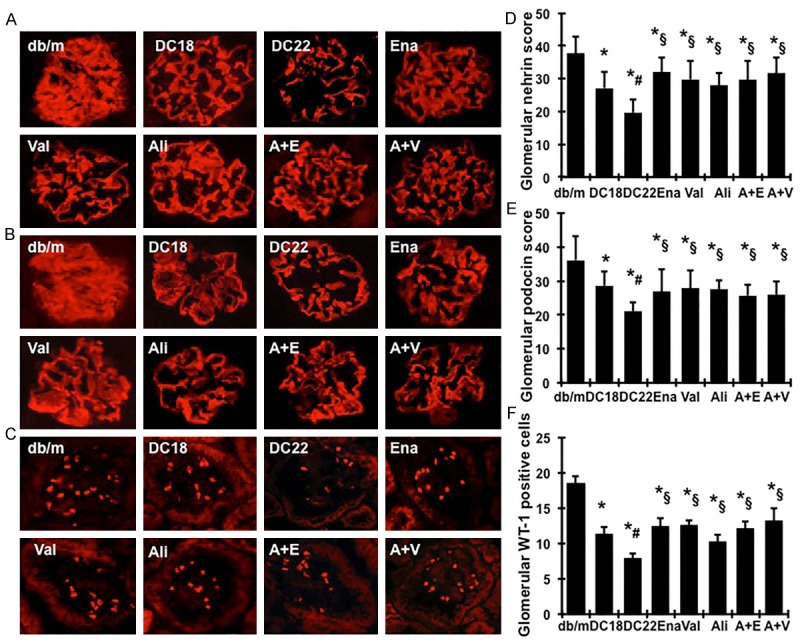
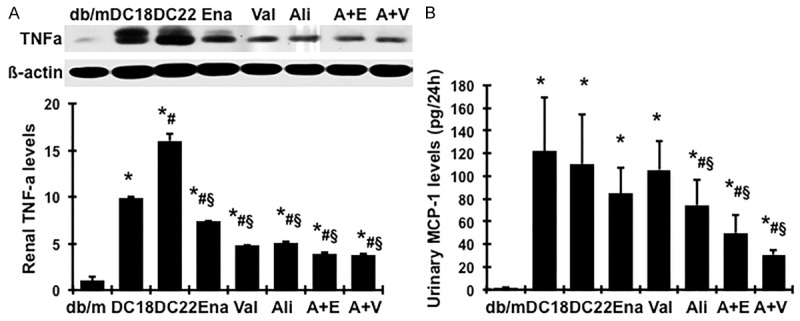
Although the intensive use of angiotensin II blockade (ACEI or ARB), progression of diabetic nephropathy is common. A feedback increase in renin production often accompanies angiotensin II blockade. We therefore examined whether aliskiren, a direct renin inhibitor, confers better renoprotection than angiotensin II blockade and whether the addition of aliskiren to an ACEI or ARB would enhance the efficacy in slowing the progression of glomerulosclerosis in diabetes. Untreated db/db mice developed progressive mesangial matrix expansion and albuminuria between weeks 18 and 22, associated with reduction of WT-1 immunopositive podocytes and nephrin and podocin production and induction of desmin and B7-1 generation and renal expression of TGFß1, PAI-1, fibronectin and type IV collagen. Treatment with aliskiren at 30 mg/kg/d inhibited the increases in albuminuria and markers of renal fibrosis and the changes that are indicative of podocyte injury seen in the db/db mice. Notably, the therapeutic effect of aliskiren was similar to that of either enalapril or valsartan given alone at maximally effective doses. Combined therapy caused the loss of 10% ~ 16.6% of db/db mice, yielded no further reduction in renal fibrosis and podocyte injury but further reduced albuminuria and renal production of TNFα, Nox2 and p47phox and urine MCP-1 and malondialdehyde levels, the markers of renal inflammation and oxidative stress. These results suggest that aliskiren, enalapril and valsartan are equally effective in slowing the progression of diabetic nephropathy. The use of combination therapy with aliskiren and ACEI/ARB may not be strongly supported.
Keywords: Direct renin inhibitor (DRI); albuminuria; angiotensin II receptor blocker (ARB); angiotensin converting enzyme inhibitor (ACEI); podocyte; renal fibrosis.
Figures


Similar articles
-
An additive effect of eplerenone to ACE inhibitor on slowing the progression of diabetic nephropathy in the db/db mice.Am J Transl Res. 2016 Mar 15;8(3):1339-54. eCollection 2016. Am J Transl Res. 2016. PMID: 27186263 Free PMC article.
-
Valsartan slows the progression of diabetic nephropathy in db/db mice via a reduction in podocyte injury, and renal oxidative stress and inflammation.Clin Sci (Lond). 2014 May;126(10):707-20. doi: 10.1042/CS20130223. Clin Sci (Lond). 2014. PMID: 24195695
-
An additive effect of anti-PAI-1 antibody to ACE inhibitor on slowing the progression of diabetic kidney disease.Am J Physiol Renal Physiol. 2016 Nov 1;311(5):F852-F863. doi: 10.1152/ajprenal.00564.2015. Epub 2016 Aug 10. Am J Physiol Renal Physiol. 2016. PMID: 27511457 Free PMC article.
-
[Direct renin inhibitor aliskiren in the treatment of cardiovascular and renal diseases].Vnitr Lek. 2010 Feb;56(2):120-6. Vnitr Lek. 2010. PMID: 20329582 Review. Czech.
-
Update on role of direct renin inhibitor in diabetic kidney disease.Ren Fail. 2014 Jul;36(6):963-9. doi: 10.3109/0886022X.2014.900425. Epub 2014 Mar 31. Ren Fail. 2014. PMID: 24678880 Review.
Cited by
-
Systemic AAV10.COMP-Ang1 rescues renal glomeruli and pancreatic islets in type 2 diabetic mice.BMJ Open Diabetes Res Care. 2020 Aug;8(1):e000882. doi: 10.1136/bmjdrc-2019-000882. BMJ Open Diabetes Res Care. 2020. PMID: 32792355 Free PMC article.
-
An additive effect of eplerenone to ACE inhibitor on slowing the progression of diabetic nephropathy in the db/db mice.Am J Transl Res. 2016 Mar 15;8(3):1339-54. eCollection 2016. Am J Transl Res. 2016. PMID: 27186263 Free PMC article.
-
Diabetic fibrosis.Biochim Biophys Acta Mol Basis Dis. 2021 Apr 1;1867(4):166044. doi: 10.1016/j.bbadis.2020.166044. Epub 2020 Dec 28. Biochim Biophys Acta Mol Basis Dis. 2021. PMID: 33378699 Free PMC article. Review.
-
Enhanced Cardiorenal Protective Effects of Combining SGLT2 Inhibition, Endothelin Receptor Antagonism and RAS Blockade in Type 2 Diabetic Mice.Int J Mol Sci. 2022 Oct 24;23(21):12823. doi: 10.3390/ijms232112823. Int J Mol Sci. 2022. PMID: 36361612 Free PMC article.
-
Aliskiren Attenuates the Inflammatory Response and Wound Healing Process in Diabetic Mice With Periodontal Disease.Front Pharmacol. 2019 Jul 4;10:708. doi: 10.3389/fphar.2019.00708. eCollection 2019. Front Pharmacol. 2019. PMID: 31333451 Free PMC article.
References
-
- Lewis EJ, Hunsicker LG, Bain RP, Rohde RD. The effect of angiotensin-converting-enzyme inhibition on diabetic nephropathy. The Collaborative Study Group. N Engl J Med. 1993;329:1456–1462. - PubMed
-
- Morgan T, Anderson A, Bertram D, MacInnis RJ. Effect of candesartan and lisinopril alone and in combination on blood pressure and microalbuminuria. J Renin Angiotensin Aldosterone Syst. 2004;5:64–71. - PubMed
-
- Forclaz A, Maillard M, Nussberger J, Brunner HR, Burnier M. Angiotensin II receptor blockade: is there truly a benefit of adding an ACE inhibitor? Hypertension. 2003;41:31–36. - PubMed
-
- Doulton TW. ACE inhibitor-angiotensin receptor blocker combinations: a clinician’s perspective. Mini Rev Med Chem. 2006;6:491–497. - PubMed
-
- Azizi M, Bissery A, Lamarre-Cliche M, Menard J. Integrating drug pharmacokinetics for phenotyping individual renin response to angiotensin II blockade in humans. Hypertension. 2004;43:785–790. - PubMed
Grants and funding
LinkOut - more resources
Full Text Sources
Miscellaneous