. 2015 Jul 7:2:150031.
doi: 10.1038/sdata.2015.31. eCollection 2015.

Brain Genomics Superstruct Project initial data release with structural, functional, and behavioral measures

Affiliations

Brain Genomics Superstruct Project initial data release with structural, functional, and behavioral measures

Avram J Holmes et al. Sci Data. .

Abstract

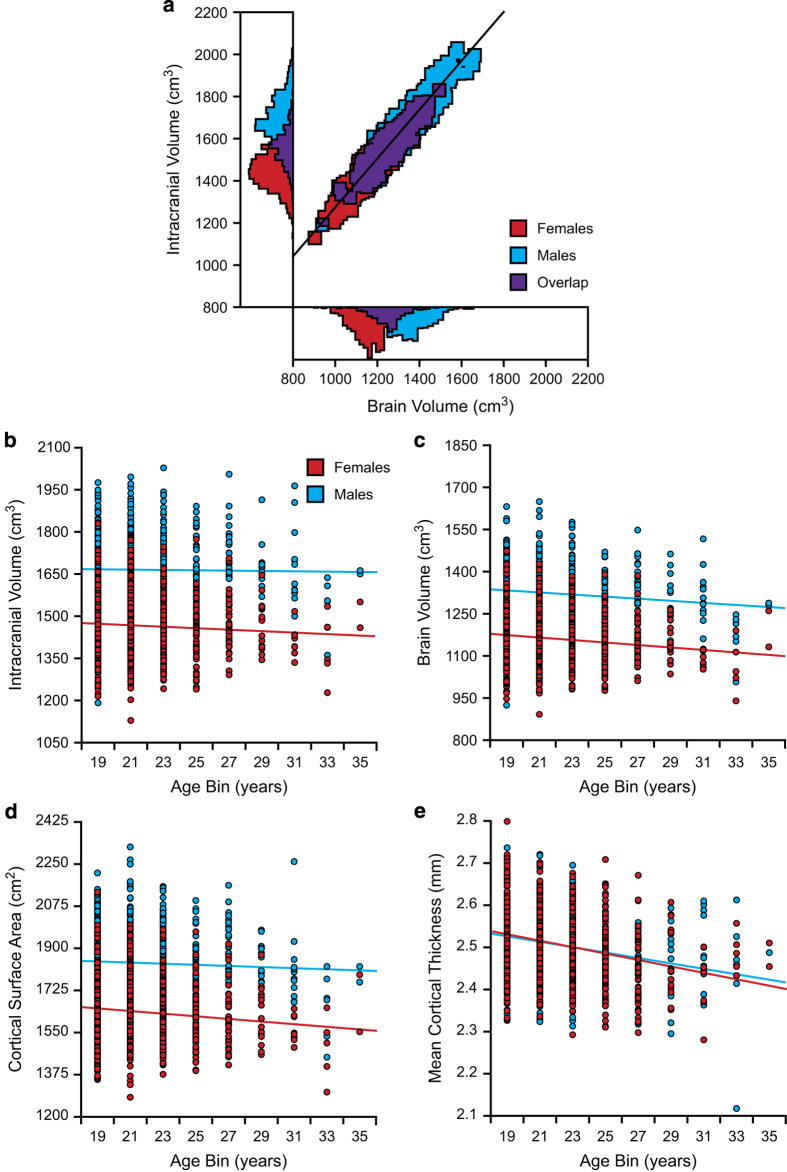
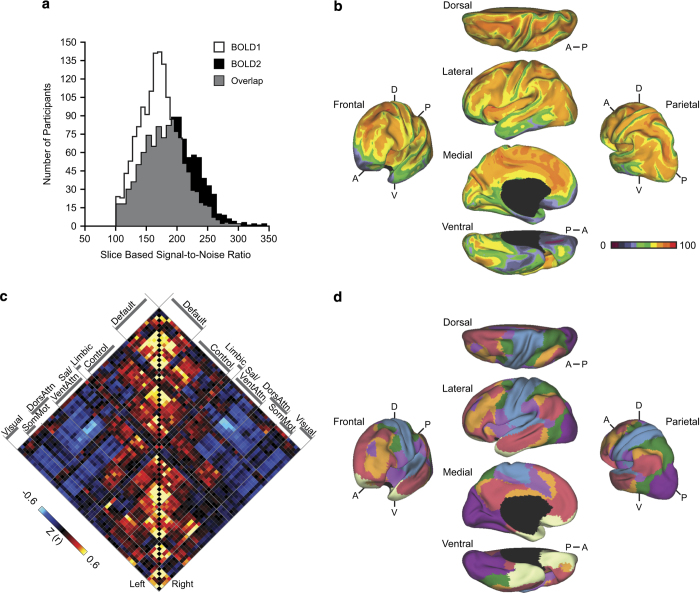
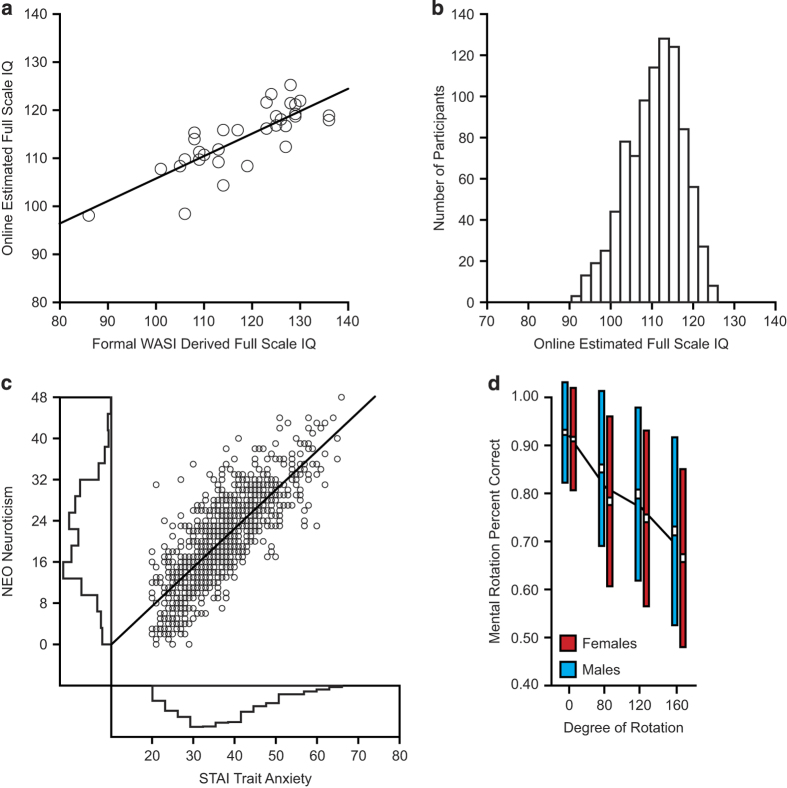
The goal of the Brain Genomics Superstruct Project (GSP) is to enable large-scale exploration of the links between brain function, behavior, and ultimately genetic variation. To provide the broader scientific community data to probe these associations, a repository of structural and functional magnetic resonance imaging (MRI) scans linked to genetic information was constructed from a sample of healthy individuals. The initial release, detailed in the present manuscript, encompasses quality screened cross-sectional data from 1,570 participants ages 18 to 35 years who were scanned with MRI and completed demographic and health questionnaires. Personality and cognitive measures were obtained on a subset of participants. Each dataset contains a T1-weighted structural MRI scan and either one (n=1,570) or two (n=1,139) resting state functional MRI scans. Test-retest reliability datasets are included from 69 participants scanned within six months of their initial visit. For the majority of participants self-report behavioral and cognitive measures are included (n=926 and n=892 respectively). Analyses of data quality, structure, function, personality, and cognition are presented to demonstrate the dataset's utility.


Conflict of interest statement

The authors declare no competing financial interests.

Figures

Figure 1
Figure 1. Structural brain volume and morphometric measures.
(a) A scatter plot of the derived structural MRI estimates from the 1,570 participants included in the present data release reveals expected relations between sex, intracranial volume (ICV), and brain volume. Histograms of both brain volume and ICV are represented on the x and y axes respectively. (be) Scatter plots display the correlations between age (2 year bins) and morphometric estimates of (b) ICV (Females r=−0.07; Males r=−0.01), (c) brain volume (Females r=−0.14; Males r=−0.11), (d) cortical surface area (Females r=−0.12; Males r=−0.05), and (e) mean cortical thickness (Females r=−0.28; Males r=−0.26). Note ICV differs by sex but minimally by age reflecting the sex difference in head size that is achieved by adolescence and remains stable. By contrast, cortical thickness is nearly identical between the sexes but decreases progressively with age.
Figure 2
Figure 2. Functional measures of brain networks.
(a) Histograms of mean slice-based temporal signal-to-noise (sSNR) values for the first and second rest runs illustrate variance in data quality across subjects. (b) The mean voxel-based temporal SNR map of the first rest run from the full sample (n=1,570) illustrates spatial variance in data quality across the cortical surface. The map is displayed for multiple views of the left hemisphere in Caret PALS space. A, anterior; P, posterior; D, dorsal; V, ventral. Note the regions of reduced SNR near to the sinuses and inner ear space. (c) A correlation matrix shows the complete coupling architecture of the full cerebral cortex measured at rest. Regions determined based on the 17-network solution from Yeo et al.. Values reflect z-transformed Pearson correlations between every region and every other region. Within-network correlations fall along the diagonal displayed in the center. Between-network correlations are plotted away from the diagonal and reveal both positive (red) and negative (blue) correlations. (d) The functional network organization of the human cerebral cortex revealed through intrinsic functional connectivity. Colors reflect regions estimated to be within the same network. The approach groups similar correlation profiles based on a winner-take-all solution, with every surface vertex assigned to its best-fitting network. The present data fully cover the striatum, thalamus, and cerebellum allowing for analyses that extend beyond the cerebral cortex (see Buckner et al. and Choi et al.).
Figure 3
Figure 3. IQ, behavioral, and personality measures.
(a) Online estimates of full scale IQ are consistent with standard Wechsler Abbreviated Scale of Intelligence (WASI) full-scale IQ estimates. Scatter plot reflects relation between average online and WASI estimates of full scale IQ (n=33; r=0.80). (b) Histogram reflects the distribution of the mean derived estimates of full scale IQ. Consistent with the sample recruitment from Boston area universities and colleges, MGH, and the surrounding communities, the mean estimated full scale IQ for the sample is 110.7±6.7. (c) Participants exhibit expected personality and temperamental characteristics. Scatter plot of available data reflects expected relations between STAI trait anxiety and NEO neuroticism. Histograms of anxiety and neuroticism are represented on the x and y axes respectively. (d) Graphs reflect mental rotation task performance for females and males. White boxes indicate standard error, colored boxes reflect standard deviation, and the black lines denote the sample mean for each condition. Performance decreases with more difficult rotations.

Dataset use reported in

  • doi: 10.1152/jn.00338.2011
  • doi: 10.1152/jn.00339.2011
  • doi: 10.1152/jn.00270.2012
  • doi: 10.1523/JNEUROSCI.2531-12.2012
  • doi: 10.1016/j.neuroimage.2011.07.044
  • doi: 10.1001/jamapsychiatry.2013.3469
  • doi: 10.1073/pnas.1317424111
  • doi: 10.1152/jn.00598.2012
  • doi: 10.1016/j.neuroimage.2013.10.046
  • doi: 10.1098/rstb.2013.0526

References

Data Citations

    1. Buckner R. L., Roffman J. L., Smoller J. W. 2014. Harvard Dataverse. http://dx.doi.org/10.7910/DVN/25833 - DOI - PubMed
    1. Holmes A. J. 2014. Brain Genomics Superstruct Project (GSP) LONI Image Data Archive. http://neuroinformatics.harvard.edu/gsp/loni

References

    1. Van Essen D. C. & Ugurbil K. The future of the human connectome. Neuroimage 62, 1299–1310 (2012). - PMC - PubMed
    1. Buckner R. L., Krienen F. M. & Yeo B. T. T. Opportunities and limitations of intrinsic functional connectivity MRI. Nat. Neurosci. 16, 832–837 (2013). - PubMed
    1. Craddock R. C. et al. Imaging human connectomes at the macroscale. Nat. Methods 10, 524–539 (2013). - PMC - PubMed
    1. Jack C. R. et al. The Alzheimer's disease neuroimaging initiative (ADNI): MRI methods. J. Magn. Reson. Imaging 27, 685–691 (2008). - PMC - PubMed
    1. Biswal B. B. et al. Toward discovery science of human brain function. Proc. Natl Acad. Sci. USA 107, 4734–4739 (2010). - PMC - PubMed

Publication types

LinkOut - more resources