. 2015;14(18):2924-37.
doi: 10.1080/15384101.2015.1064205.

Integrin-linked kinase regulates senescence in an Rb-dependent manner in cancer cell lines

Affiliations

Integrin-linked kinase regulates senescence in an Rb-dependent manner in cancer cell lines

Rose Duminuco et al. Cell Cycle. 2015.

Abstract

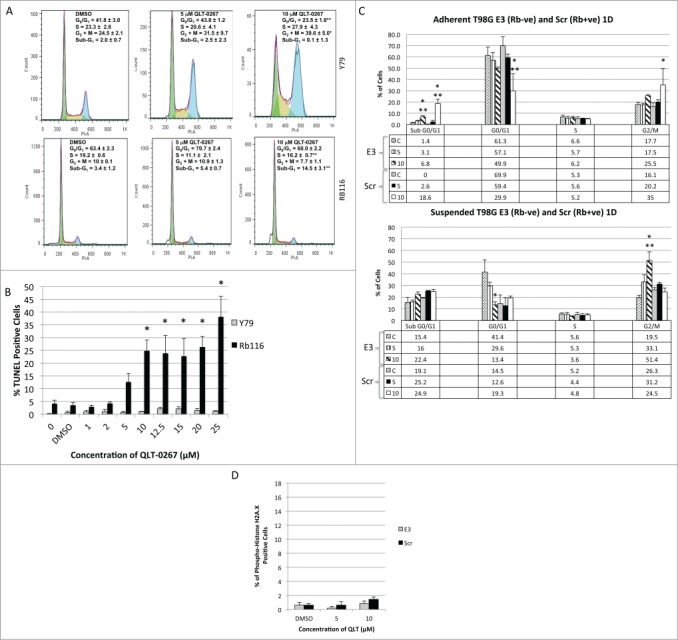
Anti-integrin-linked kinase (ILK) therapies result in aberrant mitosis including altered mitotic spindle organization, centrosome declustering and mitotic arrest. In contrast to cells that expressed the retinoblastoma tumor suppressor protein Rb, we have shown that in retinoblastoma cell lines that do not express Rb, anti-ILK therapies induced aberrant mitosis that led to the accumulation of temporarily viable multinucleated cells. The present work was undertaken to: 1) determine the ultimate fate of cells that had survived anti-ILK therapies and 2) determine whether or not Rb expression altered the outcome of these cells. Our data indicate that ILK, a chemotherapy drug target is expressed in both well-differentiated, Rb-negative and relatively undifferentiated, Rb-positive retinoblastoma tissue. We show that small molecule targeting of ILK in Rb-positive and Rb-deficient cancer cells results in increased centrosomal declustering, aberrant mitotic spindle formation and multinucleation. However, anti-ILK therapies in vitro have different outcomes in retinoblastoma and glioblastoma cell lines that depend on Rb expression. TUNEL labeling and propidium iodide FACS analysis indicate that Rb-positive cells exposed to anti-ILK therapies are more susceptible to apoptosis and senescence than their Rb-deficient counterparts wherein aberrant mitosis induced by anti-ILK therapies exhibit mitotic arrest instead. These studies are the first to show a role for ILK in chemotherapy-induced senescence in Rb-positive cancer lines. Taken together these results indicate that the oncosuppressive outcomes for anti-ILK therapies in vitro, depend on the expression of the tumor suppressor Rb, a known G1 checkpoint and senescence regulator.

Keywords: Integrin-linked kinase; cancer; centrosome declustering; mitotic arrest; multinucleation; multipolar mitosis; retinoblastoma; senescence.


Figures

Figure 1.
Figure 1.
ILK expression in Rb positive and Rb deficient retinoblastoma. (A) Sections of retinoblastoma tissue taken from 8 different patients that were Rb mutant (Rb1–7) or Rb positive (Rb8). Serial sections of Rb mutant retinoblastoma tissue were stained with haemoxylin and eosin (HE) or with a monoclonal antibody to ILK (ILK Sc). The area enclosed by the black box in the low magnification view (upper) is shown at a higher magnification below (lower). Black arrows depict Homer Wright rosettes seen in well-differentiated retinoblastoma tissue and other tumors of neuronal origin. Calibration bars represent 3 mm (upper) and 100 μm (lower) (B) Immunohistochemical staining of well differentiated retinoblastoma tissue (P2–4) or more undifferentiated tissue (P5–8) for ILK. Well-differentiated tissue exhibit classic Flexner-Wintersteiner rosettes, characteristic of retinoblastoma (blue arrows) while Rb positive tissue (P8) have a preponderance of undifferentiated cells. Calibration bar represent 50 μm.
Figure 2.
Figure 2.
Rb and ILK expression in retinoblastoma and glioblastoma lines. (A) Staining of additional Western blots of Rb116 cells as compared to Y79 and Weri-Rb (2 lines known to lack Rb expression). (Left Upper) Western blots of retinoblastoma cell lysates from 3 separate trials (designated T1-T3) were first probed with a rabbit antibody that recognizes Rb phosphorylated on serine 795 (phospho-Rb Ser795) and then stripped and reprobed with a mouse anti-Rb antibody. (Left Lower) Bar graph represents densitometric analysis of blots probed first for Rb and then for phospho-Rb Ser795. Rb116 cells are shown to have relatively high levels of Rb phosphorylated on serine 795 and overall Rb expression. (Right Upper) Western blots of retinoblastoma lysates, run in parallel, were probed with a mouse anti-ILK antibody and then stripped and reprobed with an anti-Gapdh antibody. (Right Lower) Bar graph represents densitometric analysis of blots probed first for ILK and then for Gapdh. (B) Lysates of T98G cells that were expressing normal levels of Rb (Scr) or were downregulated for Rb (E3) were run. Western blots probed with a mouse anti-ILK antibody and then stripped and reprobed with an anti-Gapdh antibody are shown.
Figure 3.
Figure 3.
QLT-0267 increases multinucleation in Rb positive and Rb deficient cell lines in a concentration-dependent manner. (A) Nuclear size of Rb positive retinoblastoma cells (Rb116) exposed to increasing concentrations of QLT-0267, was determined over 5 d in culture. Controls lacking drug vehicle, labeled 0 or with drug vehicle alone, labeled DMSO, were also included. The nuclear size of Rb116 cells is measured as a unit of Hoechst-stained area by Metamorph Premier software. An ANOVA followed by Dunnett's post hoc test was used to determine the significance of observed differences (*p < 0.05, QLT-0267 treated cells different from vehicle control). (B) A corresponding decrease in total Rb116 cell number with increasing QLT-0267 concentration was also observed for this same data sample. Data represent the mean ± SEM, n = 3 independent experiments with greater than 500 cells/treatment (over 5000 cells were counted in the controls). Nuclei number and nuclear area have been taken from the same data set. (C) Changes in nuclear number in retinoblastoma Rb116 cells exposed to increasing concentrations of QLT-0267 were determined over 5 d in culture. Cells were fixed and stained with Hoechst and tubulin to visualize binucleate (Bi, blue), trinucleate (Tri, red), tetranucleate (Tetra, green) and polynucleate (Poly or greater than 4 nuclei, purple). Data for the percentage of multinucleated cells are represented as the mean ± SEM of 4 independent experiments. An ANOVA followed by Dunnett's post hoc test was used to determine the significance of observed differences (*p < 0.05, different from vehicle control; vehicle control and nonvehicle control were not statistically different). (D) Shown are representative Rb116 cells after they were stained for α-tubulin, pericentrin and Hoechst following a 5-day exposure to 5 or 10 μM QLT-0267 or DMSO control. White arrows depict cells that are multinucleated as determined by scanning through individual z-stacks. Associated numbers indicate the number of nuclei that is present. (Inset) A quadrinucleated cell is represented following a 5-day exposure to 5 or 10 μM QLT-0267 or DMSO control. Centrosome amplification is evident in both mononucleated and multinucleated cell populations. (E) Representative T98G cells are shown following a 5-day exposure to 5 or 10 μM QLT-0267 or DMSO control. Multinucleation was evident after cells were stained for α-tubulin, pericentrin and DAPI. White arrows depict cells that are multinucleated following analysis of z-stacks. Multinucleation increased in both QLT-0276 treated T98G cell lines (those with stably integrated shRb (T98G E3) and those with shScramble (T98G Scr)). (F) The percentage of cells that were mononucleated (Mono) or multinucleated following a 5-day exposure to QLT-0267 or DMSO control were quantitated. Multinucleated cells were further categorized as binucleated (Bi), trinucleated (Tri) or cells having greater than 3 nuclei (>Tri). *p < 0.05, percentage of multinucleated cells different from vehicle control within the same cell line. Data are mean ± SEM from 3 independent experiments. Significance was determined using an ANOVA and Fisher's (LSD) test.
Figure 4.
Figure 4.
For figure legend, see page 2930.
Figure 5.
Figure 5.
ILK Inhibition effects apoptosis and G2+M-phase arrest in an Rb-dependent manner. (A) Rb116 and Y79 cells were exposed to 5 and 10 μM QLT-0267 or drug vehicle for 5 d. Cells were then stained with propidium iodide for the fluorescence-activated cell sorting analysis. The percentage of cells in sub-G1, G0/G1-, S- and G2+M-phase is expressed as an average ± SEM of independent platings (n = 2−5) for both QLT-0267 and vehicle treated groups. A marked increase in the percentage of Y79 cells in the G2+M-phase was observed in QLT-0267 treated cells as compared to vehicle control. The ILK inhibitor induces a significant sub-G1 peak in Rb positive Rb116 cell lines but not Rb negative Y79 cells following a long-term exposure to QLT-0267. Rb116 cells do not show any significant mitotic arrest, but show a significant sub-G1 peak indicative of apoptosis at 10 μM QLT-0267. Data are represented as the mean ± SEM, n = 3−6 independent experiments. *p < 0.10, different from vehicle control and **p < 0.10, different from vehicle control and lower QLT-0267 concentration, as determined using an ANOVA and Fisher's (LSD) test. (B) TUNEL positive retinoblastoma cells (Y79 and Rb116) exposed to increasing concentrations of QLT-0267 were determined following 5 d in culture. A significant increase in the percent of TUNEL positive cells was observed for Rb116 at QLT-0267 concentrations greater than or equal to 10 μM while a significant increase in TUNEL positive Y79 cells was not observed. Data are represented as the mean ± SEM, n = 3−6 independent experiments. *p < 0.05, different from vehicle control as determined using an ANOVA and Fisher's (LSD) test; vehicle control and nonvehicle control were not statistically different. (C) T98G cells expressing normal levels of Rb (labeled Scr) and those having Rb downregulated (labeled E3) were exposed to 5 and 10 μM QLT-0267 or drug vehicle for one day (1D). Nonadherent or suspended cells (lower panel) were separated from adherent populations (upper panel) and fluorescent-activated cell sorting analysis was performed. The percentage of cells in sub-G1, G0/G1-, S- and G2+M-phase (G2/M) is expressed as an average ± SEM of 3 independent platings. The ILK inhibitor induces a significantly higher sub-G1 peak in T98G cells expressing normal levels of Rb (T98G Scr) than those downregulated for Rb (T98G E3). In adherent populations, T98G Scr exhibited a G2+M-phase arrest. However, G2+M-phase arrest was only observed in suspended populations of T98G E3 cells (downregulated for Rb). *p < 0.05, different from vehicle control and ** different from other QLT-0267 treatments as determined using an ANOVA and Fisher's (LSD) test. (D) Early DNA damage response is not apparent in T98G cells following a 6 hour exposure to QLT-0267. Increased phospho-histone H2A.X staining was not observed in T98G Scr and T98G E3 cell lines, exposed to 5 and 10 μM QLT-0267 as compared to vehicle control.
Figure 6.
Figure 6.
ILK inhibition and knockdown effects senescence in an Rb-dependent manner in retinoblastoma cells. (A) Retinoblastoma lines that were either Rb-ve (Y79) or Rb+ve (Rb116) were stained for SA-β-gal activity, a classical marker of senescence after a 5-day exposure to QLT-0267 or DMSO control. A concentration-dependent increase in cellular senescence was observed in Rb116 cells while comparatively little senescence was observed in Y79 cells, even at the highest QLT-0267 concentrations. Data are represented as the mean ± SEM, n = 3 −5 independent experiments. *p < 0.05, different from vehicle control; **p < 0.05, different from the other cell line at the same drug concentration and ***p < 0.05 different from the same cell line treated with lower QLT-0267 concentrations. Significance was determined using an ANOVA and Fisher's (LSD) test (B) Representative figures used in the analysis of SA-β-gal staining is shown. An Rb+ve (Rb116) and Rb-ve (Y79) retinoblastoma cell line was exposed to increasing QLT-0267 indicates that in Rb116 cells increased SA-β-gal activity staining within the perinuclear compartment was observed with QLT-0267 concentrations ≥ 5 µM. In Rb116 cells, SA-β-gal staining was often observed within the perinuclear compartment of enlarged cells having one or more enlarged prominent nuclei. Although an increase in cell size was observed in Y79 cells with increasing drug concentration, evidence of SA-β-gal activity was not. (C) Retinoblastoma lines were treated twice with control (C RNAi) or ILK siRNA (ILK RNAi). Three days following the last siRNA treatment, cells were stained for SA-β-gal activity. Histograms of the % SA-β-gal stained cells indicate that ILK knockdown resulted in a significantly higher level of senescence in Rb116 cells. *p < 0.05, different from control and all other groups as determined using a one-way ANOVA and Fisher's (LSD) test. (D) Representative figures used in the analysis of SA-ß-gal staining are shown. SA-β-gal staining is seen here within the perinuclear compartment of enlarged and normal sized cells.
Figure 7.
Figure 7.
ILK Inhibition and Knockdown Effects Senescence in an Rb-Dependent Manner in Glioblastoma Cells. (A) QLT-0267-induced senescence was significantly higher in T98G Rb+ve cells (T98G Scr) as compared T98G Rb-ve cells (T98G E3), n = 4−5 *p < 0.05, different from vehicle control and from T98G E3 cells treated with the same concentration of QLT-0267 as determined using an ANOVA and Fisher's (LSD) test. (B) Representative figures used in the analysis of SA-β-gal activity in T98G cells are shown. T98G cells (Scr and E3) exposed to 5, 10 or 12.5 µM QLT-0267 or drug vehicle alone indicate a higher level of senescence in T98G Scr cell as compared to T98G E3 cells. With increasing concentration of QLT-0267 morphological changes indicative of senescence include an increase in cells that are flattened and enlarged having a prominent nucleus and increased cytoplasmic granularity. Additionally, increased SA-β-gal activity staining within the perinuclear compartment was observed. (C) T98G cells were treated twice with control (C RNAi) or ILK siRNA (ILK RNAi). Three days following the last siRNA treatment, cells were stained for SA-β-gal activity. (Upper) Representative photographs of T98G Scr or T98G E3 cells following ILK knockdown are shown above the histograms. (Lower) Histograms of the % SA-β-gal stained cells indicate that ILK knockdown resulted in a significantly higher level of senescence in T98G cells expressing normal levels of Rb (T98G Scr) as compared those cells with Rb knocked down (T98G E3). n = 3. *p < 0.05, different from all other groups as determined using a one-way ANOVA and Fisher's (LSD) test.

Similar articles

Cited by

References

    1. Akhtar N, Streuli CH. An integrin-ILK-microtubule network orients cell polarity and lumen formation in glandular epithelium. Nat Cell Biol 2012; 15(1):17-27. - PMC - PubMed
    1. Fielding AB, Lim S, Montgomery K, Dobreva I, Dedhar S. A critical role of integrin-linked kinase, ch-TOG and TACC3 in centrosome clustering in cancer cells. Oncogene 2011; 30:521-34; PMID:20838383; http://dx.doi.org/10.1038/onc.2010.431 - DOI - PubMed
    1. Fielding AB, Dobreva I, McDonald PC, Foster LJ, Dedhar S. Integrin-linked kinase localizes to the centrosome and regulates mitotic spindle organization. J Cell Biol 2008; 180:681-9; PMID:18283114; http://dx.doi.org/10.1083/jcb.200710074 - DOI - PMC - PubMed
    1. Fielding AB, Dobreva I, Dedhar S. Beyond focal adhesions: integrin-linked kinase associates with tubulin and regulates mitotic spindle organization. Cell Cycle 2008; 7:1899-906; PMID:18604167; http://dx.doi.org/10.4161/cc.7.13.6204 - DOI - PubMed
    1. Lim S, Kawamura E, Fielding AB, Maydan M, Dedhar S. Integrin-linked kinase regulates interphase and mitotic microtubule dynamics. PloS one 2013; 8:e53702; PMID:23349730; http://dx.doi.org/10.1371/journal.pone.0053702 - DOI - PMC - PubMed

Publication types

MeSH terms

LinkOut - more resources