

Stage III Non-Small Cell Lung Cancer: Prognostic Value of FDG PET Quantitative Imaging Features Combined with Clinical Prognostic Factors
- PMID: 26176655
- PMCID: PMC4699494
- DOI: 10.1148/radiol.2015142920
Stage III Non-Small Cell Lung Cancer: Prognostic Value of FDG PET Quantitative Imaging Features Combined with Clinical Prognostic Factors
Abstract
Purpose: To determine whether quantitative imaging features from pretreatment positron emission tomography (PET) can enhance patient overall survival risk stratification beyond what can be achieved with conventional prognostic factors in patients with stage III non-small cell lung cancer (NSCLC).
Materials and methods: The institutional review board approved this retrospective chart review study and waived the requirement to obtain informed consent. The authors retrospectively identified 195 patients with stage III NSCLC treated definitively with radiation therapy between January 2008 and January 2013. All patients underwent pretreatment PET/computed tomography before treatment. Conventional PET metrics, along with histogram, shape and volume, and co-occurrence matrix features, were extracted. Linear predictors of overall survival were developed from leave-one-out cross-validation. Predictive Kaplan-Meier curves were used to compare the linear predictors with both quantitative imaging features and conventional prognostic factors to those generated with conventional prognostic factors alone. The Harrell concordance index was used to quantify the discriminatory power of the linear predictors for survival differences of at least 0, 6, 12, 18, and 24 months. Models were generated with features present in more than 50% of the cross-validation folds.
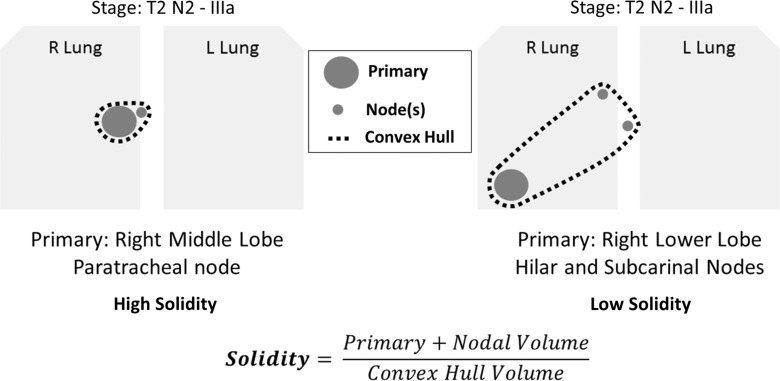
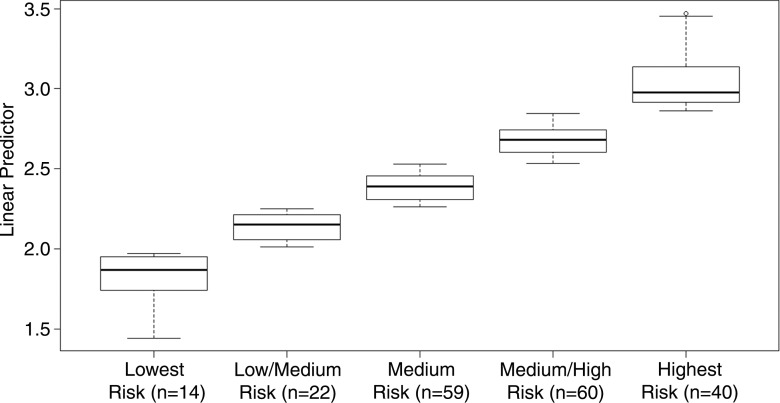
Results: Linear predictors of overall survival generated with both quantitative imaging features and conventional prognostic factors demonstrated improved risk stratification compared with those generated with conventional prognostic factors alone in terms of log-rank statistic (P = .18 vs P = .0001, respectively) and concordance index (0.62 vs 0.58, respectively). The use of quantitative imaging features selected during cross-validation improved the model using conventional prognostic factors alone (P = .007). Disease solidity and primary tumor energy from the co-occurrence matrix were found to be selected in all folds of cross-validation.
Conclusion: Pretreatment PET features were associated with overall survival when adjusting for conventional prognostic factors in patients with stage III NSCLC.
© RSNA, 2015.
Figures

References
-
- Dehing-Oberije C, Yu S, De Ruysscher D, et al. . Development and external validation of prognostic model for 2-year survival of non–small-cell lung cancer patients treated with chemoradiotherapy. Int J Radiat Oncol Biol Phys 2009;74(2):355–362. - PubMed
-
- MacManus M, Nestle U, Rosenzweig KE, et al. . Use of PET and PET/CT for radiation therapy planning: IAEA expert report 2006–2007. Radiother Oncol 2009;91(1):85–94. - PubMed
-
- Berghmans T, Dusart M, Paesmans M, et al. . Primary tumor standardized uptake value (SUVmax) measured on fluorodeoxyglucose positron emission tomography (FDG-PET) is of prognostic value for survival in non–small cell lung cancer (NSCLC): a systematic review and meta-analysis (MA) by the European Lung Cancer Working Party for the IASLC Lung Cancer Staging Project. J Thorac Oncol 2008;3(1):6–12. - PubMed
-
- Machtay M, Duan F, Siegel BA, et al. . Prediction of survival by [18F]fluorodeoxyglucose positron emission tomography in patients with locally advanced non-small-cell lung cancer undergoing definitive chemoradiation therapy: results of the ACRIN 6668/RTOG 0235 trial. J Clin Oncol 2013;31(30):3823–3830. - PMC - PubMed
-
- Im HJ, Pak K, Cheon GJ, et al. . Prognostic value of volumetric parameters of (18)F-FDG PET in non–small-cell lung cancer: a meta-analysis. Eur J Nucl Med Mol Imaging 2015;42(2):241–251. - PubMed
Publication types
MeSH terms
Substances
Grants and funding
LinkOut - more resources
Full Text Sources
Other Literature Sources
Medical
