Histological Stratification of Thick and Thin Plaque Psoriasis Explores Molecular Phenotypes with Clinical Implications
- PMID: 26176783
- PMCID: PMC4503455
- DOI: 10.1371/journal.pone.0132454
Histological Stratification of Thick and Thin Plaque Psoriasis Explores Molecular Phenotypes with Clinical Implications
Abstract
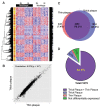
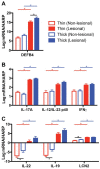
Psoriasis, which presents as red, scaly patches on the body, is a common, autoimmune skin disease that affects 2 to 3 percent of the world population. To leverage recent molecular findings into the personalized treatment of psoriasis, we need a strategy that integrates clinical stratification with molecular phenotyping. In this study, we sought to stratify psoriasis patients by histological measurements of epidermal thickness, and to compare their molecular characterizations by gene expression, serum cytokines, and response to biologics. We obtained histological measures of epidermal thickness in a cohort of 609 psoriasis patients, and identified a mixture of two subpopulations-thick and thin plaque psoriasis-from which they were derived. This stratification was verified in a subcohort of 65 patients from a previously published study with significant differences in inflammatory cell infiltrates in the psoriatic skin. Thick and thin plaque psoriasis shared 84.8% of the meta-analysis-derived psoriasis transcriptome, but a stronger dysregulation of the meta-analysis-derived psoriasis transcriptome was seen in thick plaque psoriasis on microarray. RT-PCR revealed that gene expression in thick and thin plaque psoriasis was different not only within psoriatic lesional skin but also in peripheral non-lesional skin. Additionally, differences in circulating cytokines and their changes in response to biologic treatments were found between the two subgroups. All together, we were able to integrate histological stratification with molecular phenotyping as a way of exploring clinical phenotypes with different expression levels of the psoriasis transcriptome and circulating cytokines.
Conflict of interest statement
Figures


Similar articles
-
Observations of psoriasis in the absence of therapeutic intervention identifies two unappreciated morphologic variants, thin-plaque and thick-plaque psoriasis, and their associated phenotypes.J Invest Dermatol. 2006 Nov;126(11):2397-403. doi: 10.1038/sj.jid.5700489. Epub 2006 Jul 20. J Invest Dermatol. 2006. PMID: 16858419
-
Assessment of epidermal subpopulations and proliferation in healthy skin, symptomless and lesional skin of spreading psoriasis.Br J Dermatol. 2006 Oct;155(4):688-94. doi: 10.1111/j.1365-2133.2006.07403.x. Br J Dermatol. 2006. PMID: 16965416
-
Transcriptional landscape of psoriasis identifies the involvement of IL36 and IL36RN.BMC Genomics. 2015 Apr 19;16(1):322. doi: 10.1186/s12864-015-1508-2. BMC Genomics. 2015. PMID: 25897967 Free PMC article.
-
Expression of p53 in lesions and unaffected skin of patients with plaque-type and guttate psoriasis: a quantitative comparative study.J Dermatol. 2007 Jun;34(6):367-74. doi: 10.1111/j.1346-8138.2007.00290.x. J Dermatol. 2007. PMID: 17535401 Review.
-
Clinical application of serum biomarkers for detecting and monitoring of chronic plaque psoriasis.Front Mol Biosci. 2023 Jul 21;10:1196323. doi: 10.3389/fmolb.2023.1196323. eCollection 2023. Front Mol Biosci. 2023. PMID: 37546687 Free PMC article. Review.
Cited by
-
Antidrug antibody formation during tumor necrosis factor α inhibitor treatment of severe psoriatic patients in the real-life practice.Postepy Dermatol Alergol. 2019 Oct;36(5):589-594. doi: 10.5114/ada.2019.89507. Epub 2019 Nov 12. Postepy Dermatol Alergol. 2019. PMID: 31839776 Free PMC article.
-
I_MDS: an inflammatory bowel disease molecular activity score to classify patients with differing disease-driving pathways and therapeutic response to anti-TNF treatment.PLoS Comput Biol. 2019 Apr 30;15(4):e1006951. doi: 10.1371/journal.pcbi.1006951. eCollection 2019 Apr. PLoS Comput Biol. 2019. PMID: 31039157 Free PMC article.
-
MiR-150 regulates human keratinocyte proliferation in hypoxic conditions through targeting HIF-1α and VEGFA: Implications for psoriasis treatment.PLoS One. 2017 Apr 11;12(4):e0175459. doi: 10.1371/journal.pone.0175459. eCollection 2017. PLoS One. 2017. PMID: 28399173 Free PMC article.
-
Response to Inhibition of Receptor-Interacting Protein Kinase 1 (RIPK1) in Active Plaque Psoriasis: A Randomized Placebo-Controlled Study.Clin Pharmacol Ther. 2020 Oct;108(4):808-816. doi: 10.1002/cpt.1852. Epub 2020 Jul 7. Clin Pharmacol Ther. 2020. PMID: 32301501 Free PMC article. Clinical Trial.
-
Disease-Dependent Antiapoptotic Effects of Cannabidiol for Keratinocytes Observed upon UV Irradiation.Int J Mol Sci. 2021 Sep 15;22(18):9956. doi: 10.3390/ijms22189956. Int J Mol Sci. 2021. PMID: 34576119 Free PMC article.
References
-
- Koo J. Population-based epidemiologic study of psoriasis with emphasis on quality of life assessment. Dermatologic clinics. 1996;14(3):485–96. . - PubMed
-
- Neimann AL, Shin DB, Wang X, Margolis DJ, Troxel AB, Gelfand JM. Prevalence of cardiovascular risk factors in patients with psoriasis. Journal of the American Academy of Dermatology. 2006;55(5):829–35. - PubMed
Publication types
MeSH terms
Substances
LinkOut - more resources
Full Text Sources
Other Literature Sources
Medical

